| Param | Original file | Final file |
|---|---|---|
| Filename | modeM0/AS1T02_112T01_9000002390_16240cztM0_level2.evt | modeM0/AS1T02_112T01_9000002390_16240cztM0_level2_quad_clean.evt |
| Size (bytes) | 510,379,200 | 100,915,200 |
| Size | 486.7 MB | 96.2 MB |
| Events in quadrant A | 3,787,092 | 658,273 |
| Events in quadrant B | 3,798,900 | 667,294 |
| Events in quadrant C | 3,725,468 | 654,609 |
| Events in quadrant D | 3,723,699 | 641,981 |
| Mode SS | |||
|---|---|---|---|
| Quadrant | BADHDUFLAG | Total packets | Discarded packets |
| A | 0 | 124 | 0 |
| B | 0 | 124 | 0 |
| C | 0 | 124 | 0 |
| D | 0 | 124 | 0 |
| Mode M9 | |||
|---|---|---|---|
| Quadrant | BADHDUFLAG | Total packets | Discarded packets |
| A | 0 | 22 | 0 |
| B | 0 | 22 | 0 |
| C | 0 | 22 | 0 |
| D | 0 | 23 | 0 |
| Mode M0 | |||
|---|---|---|---|
| Quadrant | BADHDUFLAG | Total packets | Discarded packets |
| A | 0 | 15209 | 3 |
| B | 0 | 15317 | 2 |
| C | 0 | 15317 | 2 |
| D | 0 | 14892 | 2 |
| Quadrant | Total seconds | Saturated seconds | Saturation percentage |
|---|---|---|---|
| A | 6228 | 182 | 2.922286% |
| B | 6228 | 153 | 2.456647% |
| C | 6228 | 167 | 2.681439% |
| D | 6228 | 108 | 1.734104% |
Noise dominated data is calculated using 1-second bins in cleaned event files. If a bin has >2000 counts, and if more than 50% of those come from <1% of pixels, then it is considered to be noise-dominated and hence unusable.
| Quadrant | # 1 sec bins | Bins with >0 counts | Bins with >2000 counts | High rate bins dominated by noise | Noise dominated (total time) | Noise dominated (detector-on time) | Marked lightcurve |
|---|---|---|---|---|---|---|---|
| A | 7544 | 6230 | 69 | 69 | 0.91% | 1.11% | 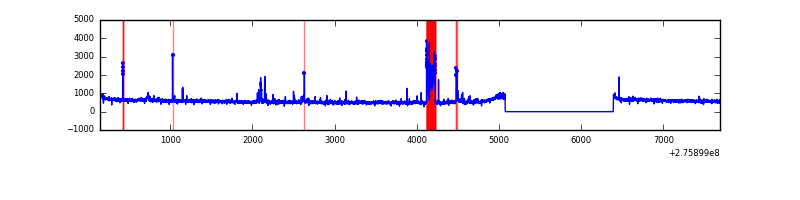 |
| B | 7544 | 6230 | 21 | 21 | 0.28% | 0.34% | 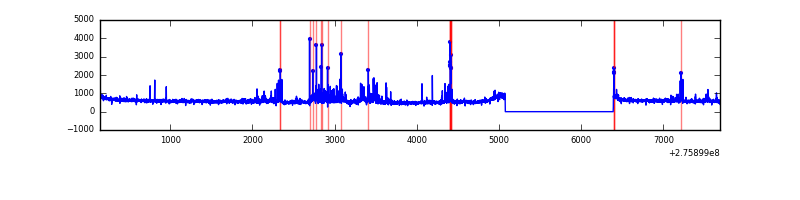 |
| C | 7544 | 6230 | 0 | 0 | 0.00% | 0.00% | 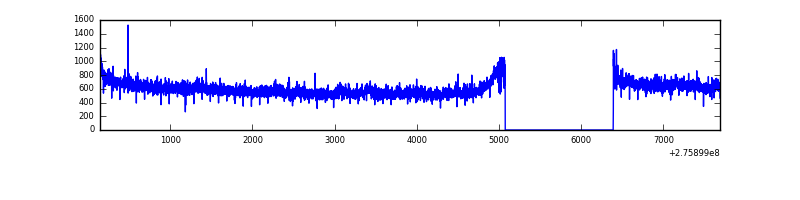 |
| D | 7544 | 6230 | 16 | 16 | 0.21% | 0.26% | 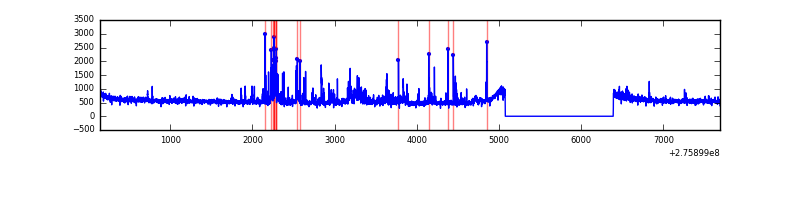 |
Top three noisy pixels from each quadrant. If the there are fewer than three noisy pixels in the level2.evt file, extra rows are filled as -1
| Pixel properties | Quadrant properties | ||||||
|---|---|---|---|---|---|---|---|
| Quadrant | DetID | PixID | Counts | Sigma | Mean | Median | Sigma |
| A | 15 | 174 | 296987 | 1672.73 | 884 | 871 | 177.0 |
| A | 8 | 247 | 59299 | 330.05 | 884 | 871 | 177.0 |
| A | 9 | 143 | 24786 | 135.09 | 884 | 871 | 177.0 |
| B | 7 | 220 | 117342 | 711.86 | 872 | 855 | 163.6 |
| B | 0 | 198 | 57069 | 343.53 | 872 | 855 | 163.6 |
| B | 0 | 189 | 53486 | 321.63 | 872 | 855 | 163.6 |
| C | 3 | 233 | 303840 | 1568.57 | 842 | 851 | 193.2 |
| C | 14 | 238 | 132410 | 681.08 | 842 | 851 | 193.2 |
| C | 13 | 61 | 5944 | 26.37 | 842 | 851 | 193.2 |
| D | 1 | 52 | 332059 | 1590.03 | 865 | 842 | 208.3 |
| D | 5 | 222 | 44122 | 207.77 | 865 | 842 | 208.3 |
| D | 12 | 233 | 33597 | 157.24 | 865 | 842 | 208.3 |
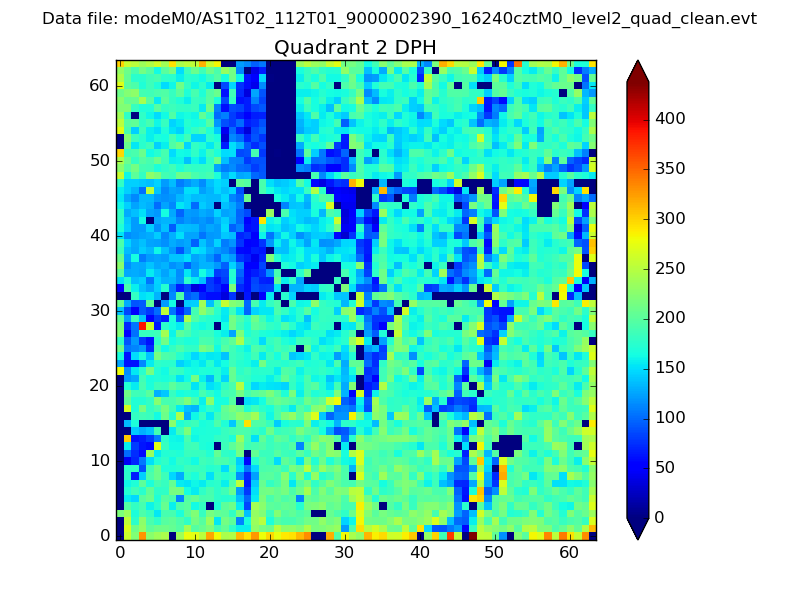
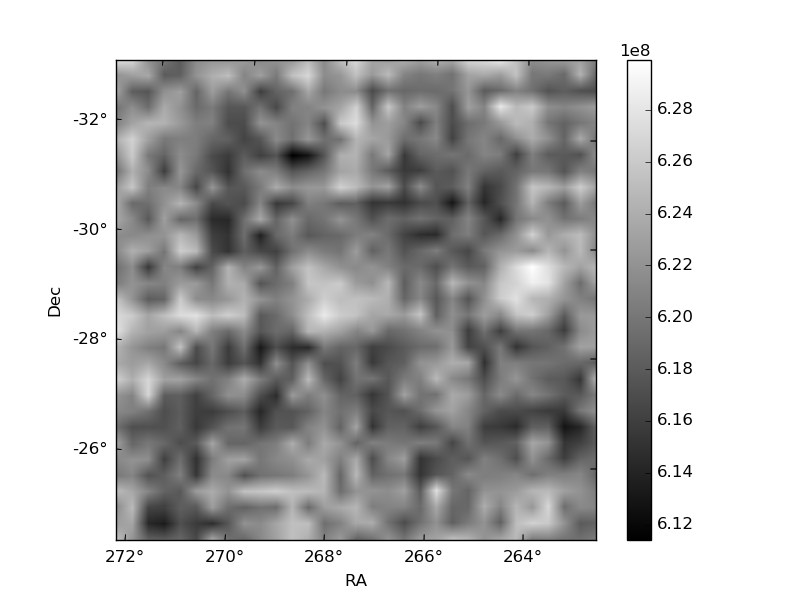
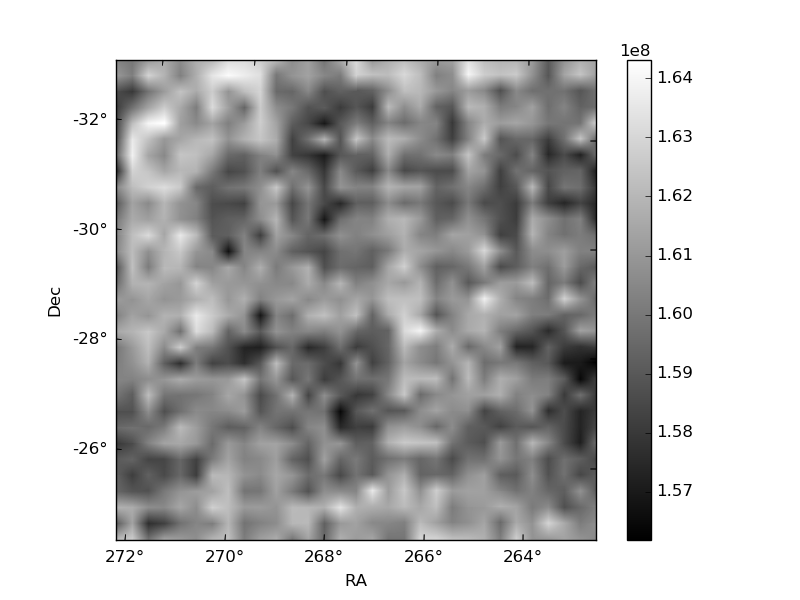
Histogram calculated using DETX and DETY for each event in the final _common_clean file
| Quadrant A | 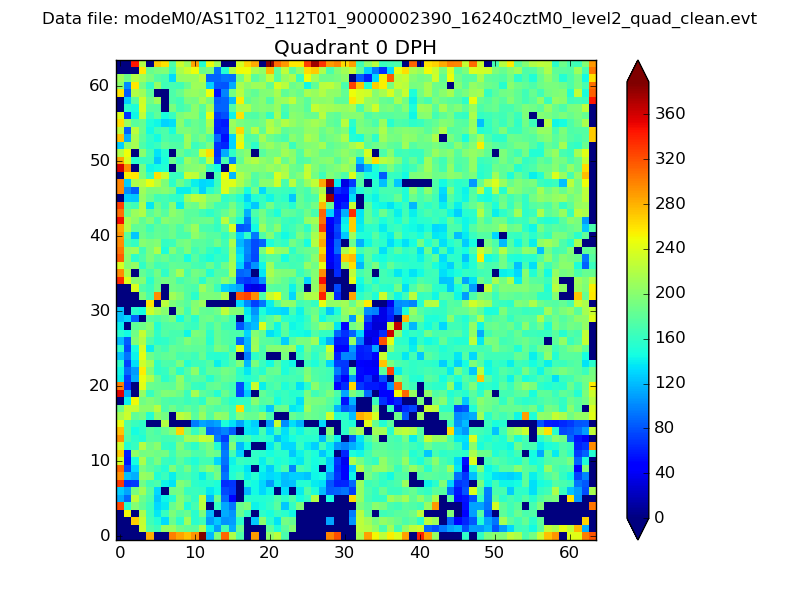 |
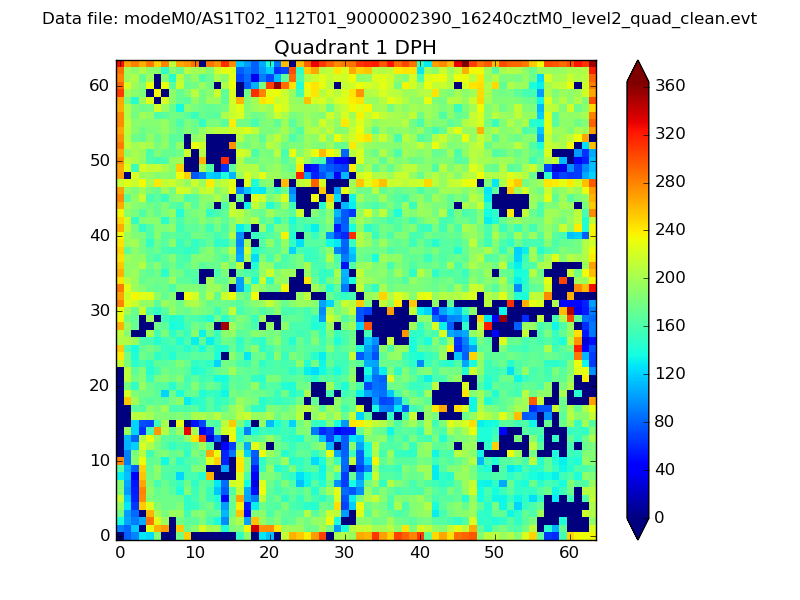 |
Quadrant B |
|---|---|---|---|
| Quadrant D | 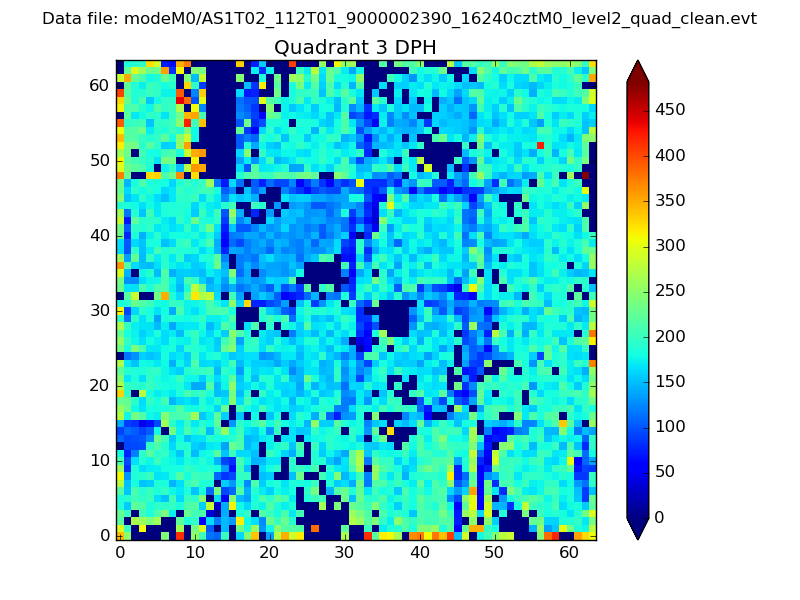 |
 |
Quadrant C |
| Plot type | Count rate plots | Images |
|---|---|---|
| Comparison with Poisson distribution Blue bars denote a histogram of data divided into 1 sec bins. Red curve is a Poisson curve with rate = median count rate of data. |
 |
 |
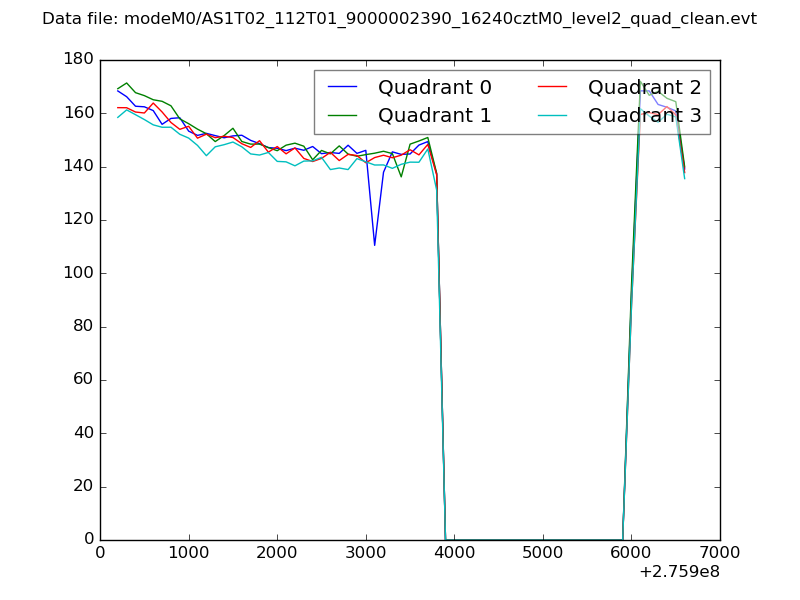
| Quadrant-wise count rates Data is divided into 100 sec bins |
 |
|
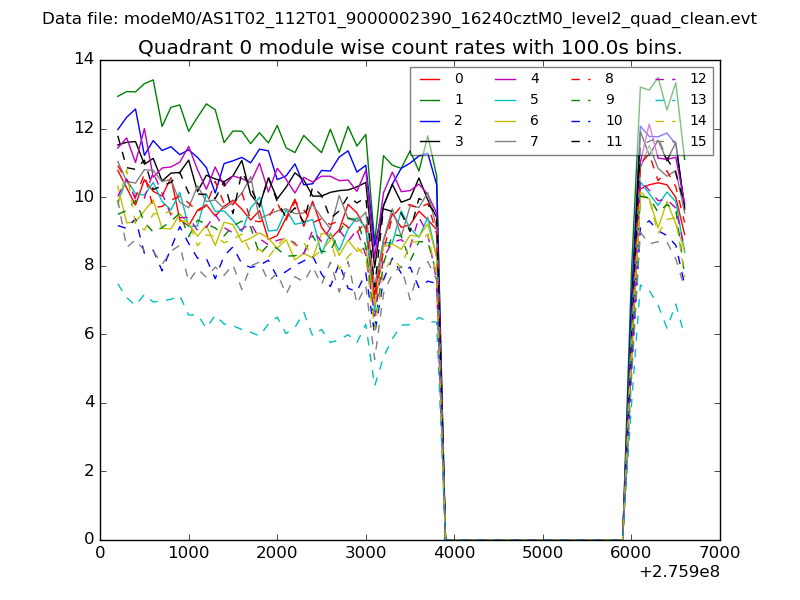
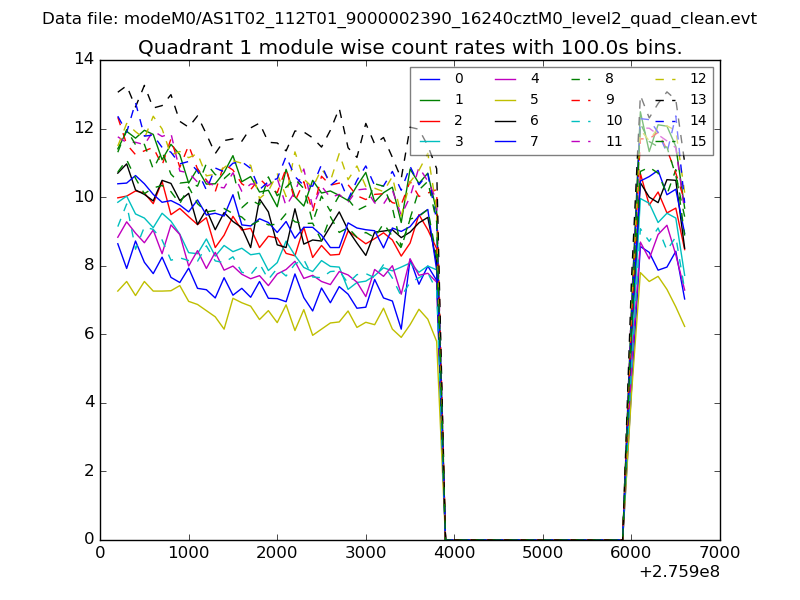
| Module-wise count rates for Quadrant A Data is divided into 100 sec bins |
 |
 |
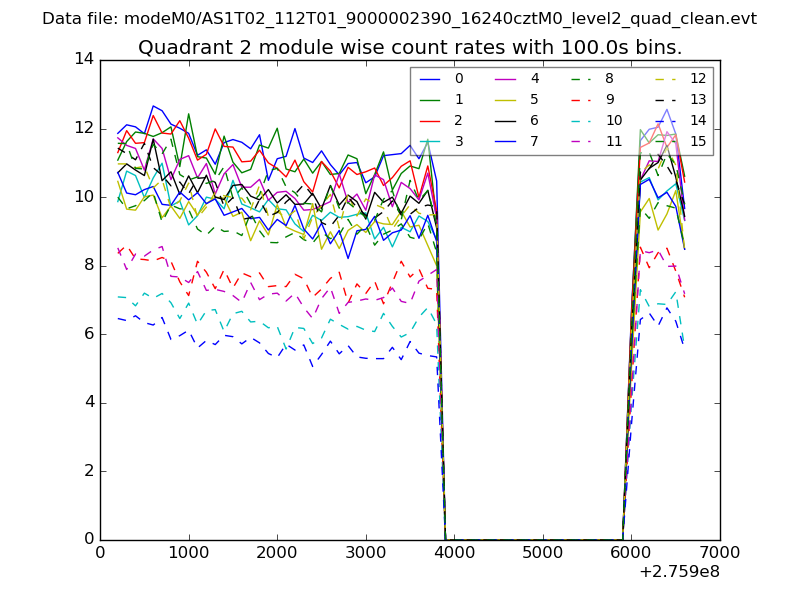
| Module-wise count rates for Quadrant B Data is divided into 100 sec bins |
 |
 |
| Module-wise count rates for Quadrant C Data is divided into 100 sec bins |
 |
 |
| Module-wise count rates for Quadrant D Data is divided into 100 sec bins |
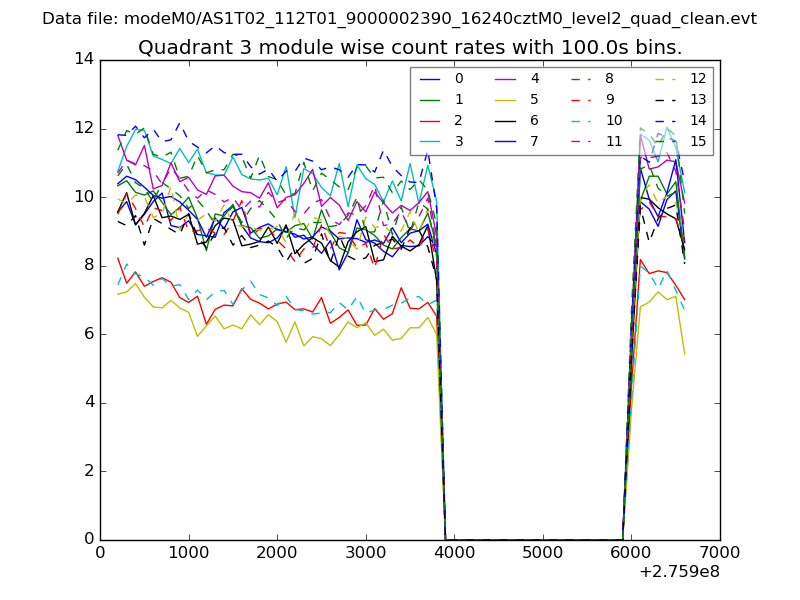 |
 |
| Parameter | Plot |
|---|---|
| CZT HV Monitor | 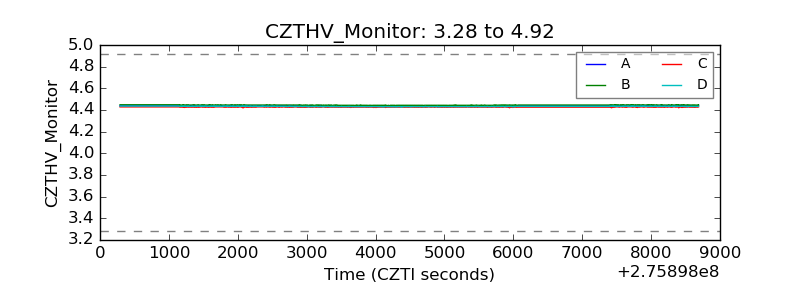 |
| D_VDD | 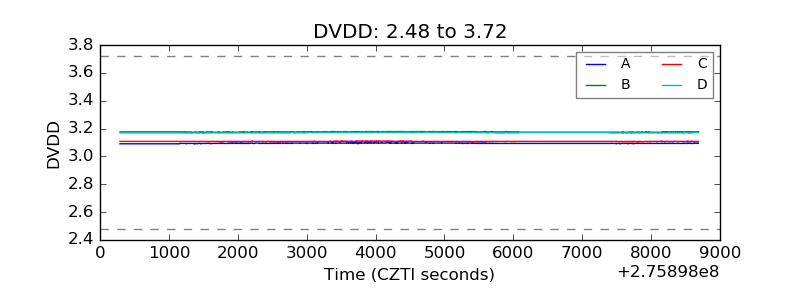 |
| Temperature 1 | 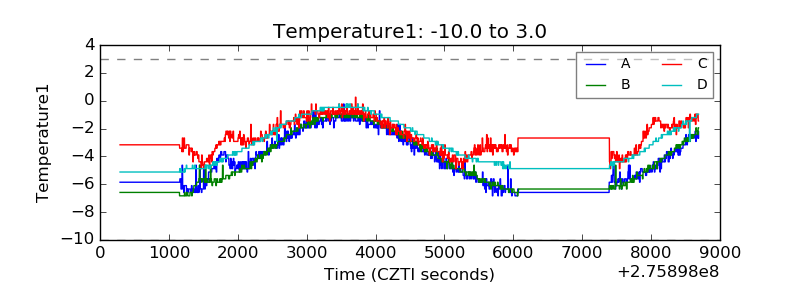 |
| Veto HV Monitor | 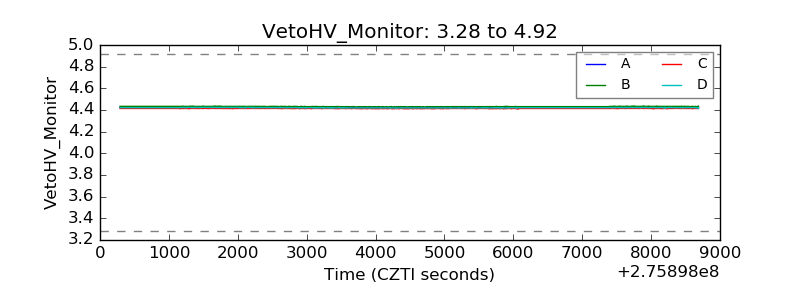 |
| Veto LLD | 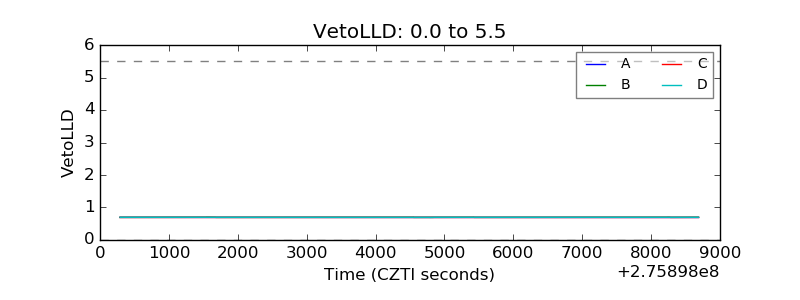 |
| Alpha Counter | 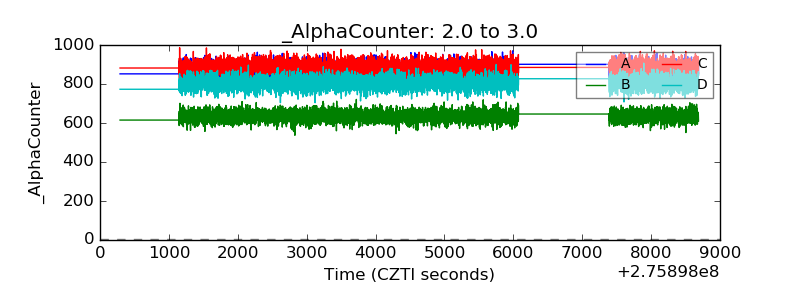 |
| _CPM_Rate | 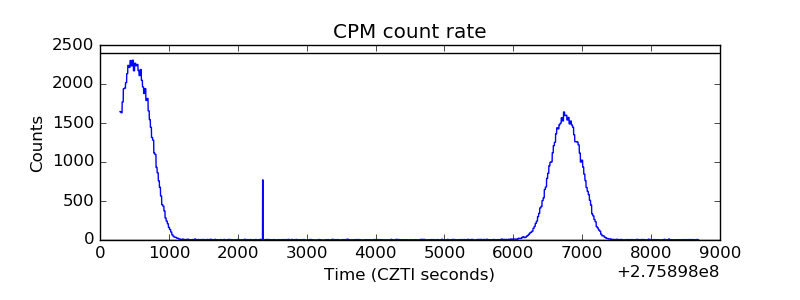 |
| CZT Counter | 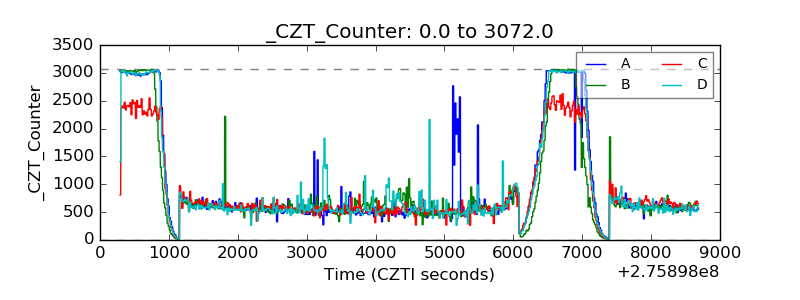 |
| +2.5 Volts monitor |  |
| +5 Volts monitor | 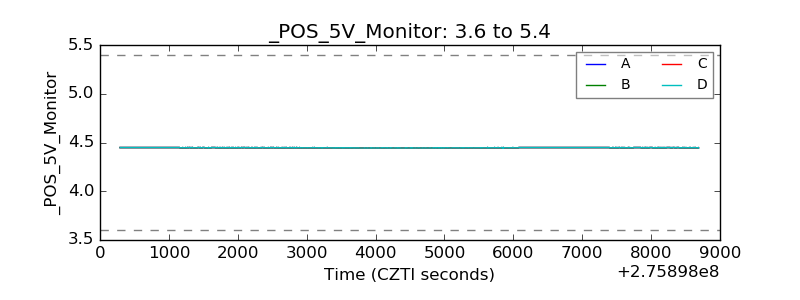 |
| _ROLL_ROT | 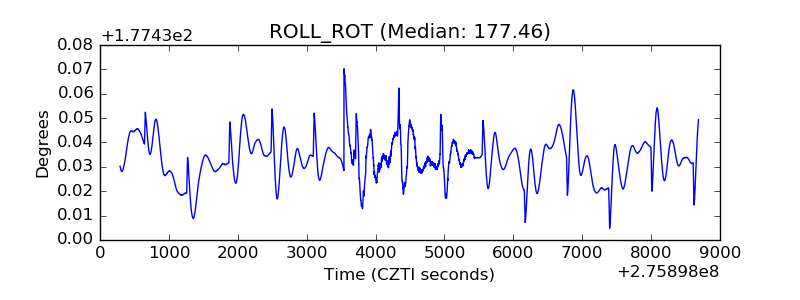 |
| _Roll_DEC |  |
| _Roll_RA | 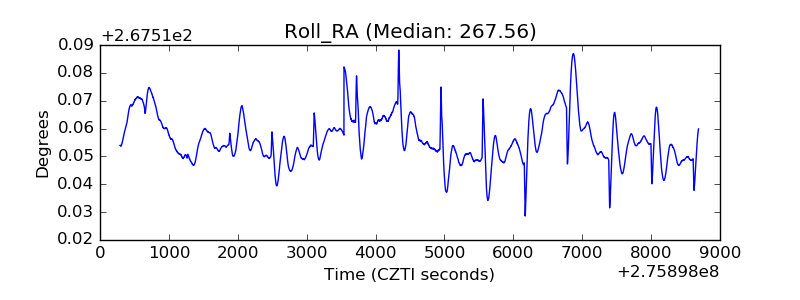 |
| Veto Counter | 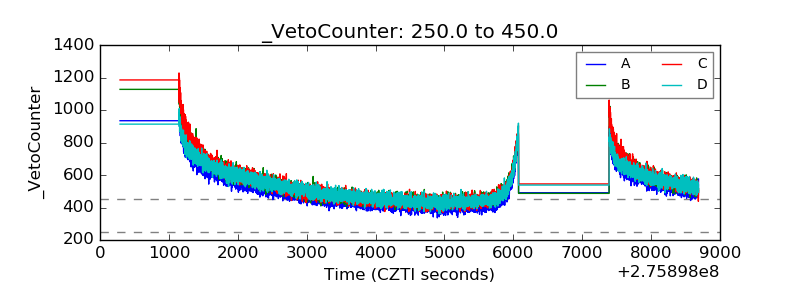 |