| Param | Original file | Final file |
|---|---|---|
| Filename | modeM0/AS1T02_112T01_9000002390_16241cztM0_level2.evt | modeM0/AS1T02_112T01_9000002390_16241cztM0_level2_quad_clean.evt |
| Size (bytes) | 455,967,360 | 106,868,160 |
| Size | 434.8 MB | 101.9 MB |
| Events in quadrant A | 3,395,349 | 711,484 |
| Events in quadrant B | 3,516,388 | 716,218 |
| Events in quadrant C | 3,274,158 | 702,557 |
| Events in quadrant D | 3,224,678 | 696,524 |
| Mode SS | |||
|---|---|---|---|
| Quadrant | BADHDUFLAG | Total packets | Discarded packets |
| A | 0 | 120 | 0 |
| B | 0 | 120 | 0 |
| C | 0 | 120 | 0 |
| D | 0 | 120 | 0 |
| Mode M9 | |||
|---|---|---|---|
| Quadrant | BADHDUFLAG | Total packets | Discarded packets |
| A | 0 | 12 | 0 |
| B | 0 | 12 | 0 |
| C | 0 | 12 | 0 |
| D | 0 | 12 | 0 |
| Mode M0 | |||
|---|---|---|---|
| Quadrant | BADHDUFLAG | Total packets | Discarded packets |
| A | 0 | 13518 | 2 |
| B | 0 | 14109 | 1 |
| C | 0 | 13535 | 1 |
| D | 0 | 13128 | 1 |
| Quadrant | Total seconds | Saturated seconds | Saturation percentage |
|---|---|---|---|
| A | 5863 | 194 | 3.308886% |
| B | 5863 | 185 | 3.155381% |
| C | 5863 | 161 | 2.746034% |
| D | 5863 | 107 | 1.825004% |
Noise dominated data is calculated using 1-second bins in cleaned event files. If a bin has >2000 counts, and if more than 50% of those come from <1% of pixels, then it is considered to be noise-dominated and hence unusable.
| Quadrant | # 1 sec bins | Bins with >0 counts | Bins with >2000 counts | High rate bins dominated by noise | Noise dominated (total time) | Noise dominated (detector-on time) | Marked lightcurve |
|---|---|---|---|---|---|---|---|
| A | 7094 | 5865 | 63 | 63 | 0.89% | 1.07% | 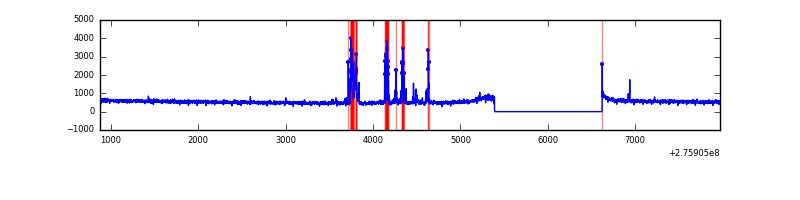 |
| B | 7094 | 5865 | 20 | 20 | 0.28% | 0.34% | 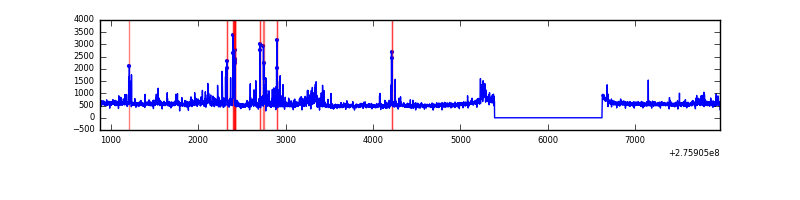 |
| C | 7094 | 5865 | 0 | 0 | 0.00% | 0.00% | 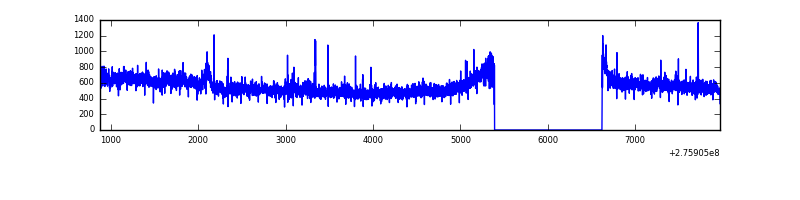 |
| D | 7094 | 5865 | 12 | 12 | 0.17% | 0.20% | 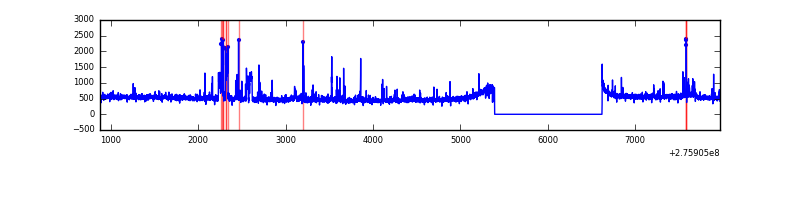 |
Top three noisy pixels from each quadrant. If the there are fewer than three noisy pixels in the level2.evt file, extra rows are filled as -1
| Pixel properties | Quadrant properties | ||||||
|---|---|---|---|---|---|---|---|
| Quadrant | DetID | PixID | Counts | Sigma | Mean | Median | Sigma |
| A | 15 | 174 | 307056 | 1905.77 | 791 | 777 | 160.7 |
| A | 8 | 247 | 38009 | 231.67 | 791 | 777 | 160.7 |
| A | 3 | 1 | 9005 | 51.2 | 791 | 777 | 160.7 |
| B | 7 | 220 | 134027 | 908.52 | 781 | 766 | 146.7 |
| B | 10 | 16 | 74598 | 503.36 | 781 | 766 | 146.7 |
| B | 0 | 198 | 57607 | 387.52 | 781 | 766 | 146.7 |
| C | 3 | 233 | 216619 | 1250.83 | 750 | 755 | 172.6 |
| C | 14 | 238 | 119890 | 690.33 | 750 | 755 | 172.6 |
| C | 7 | 247 | 9574 | 51.1 | 750 | 755 | 172.6 |
| D | 1 | 52 | 203831 | 1098.4 | 772 | 752 | 184.9 |
| D | 15 | 0 | 40647 | 215.78 | 772 | 752 | 184.9 |
| D | 10 | 70 | 37471 | 198.6 | 772 | 752 | 184.9 |
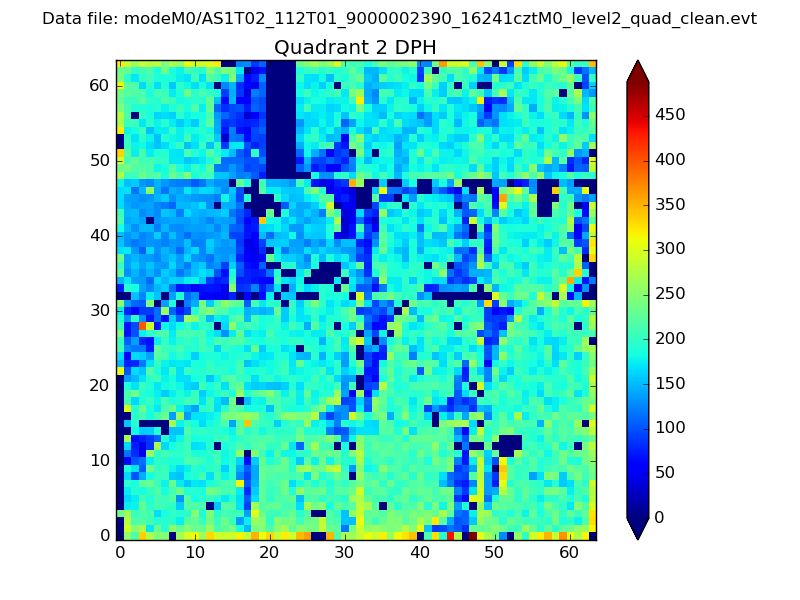
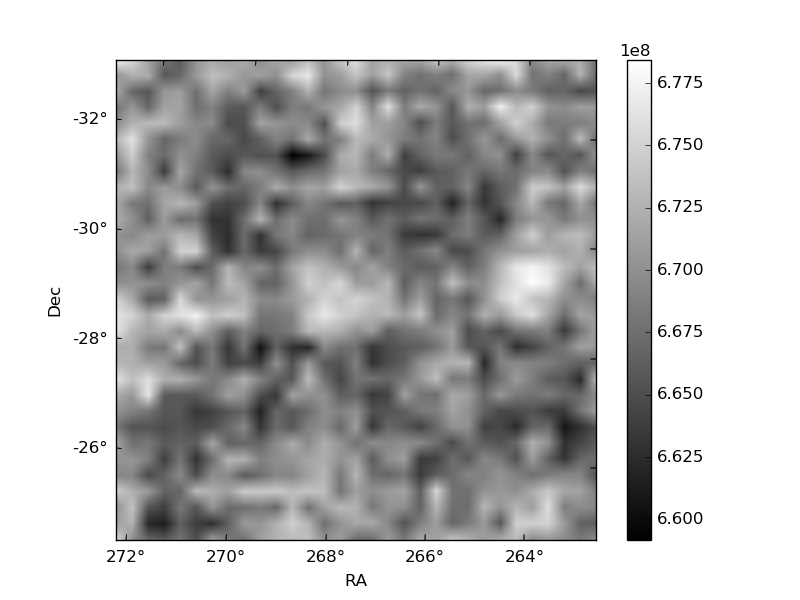
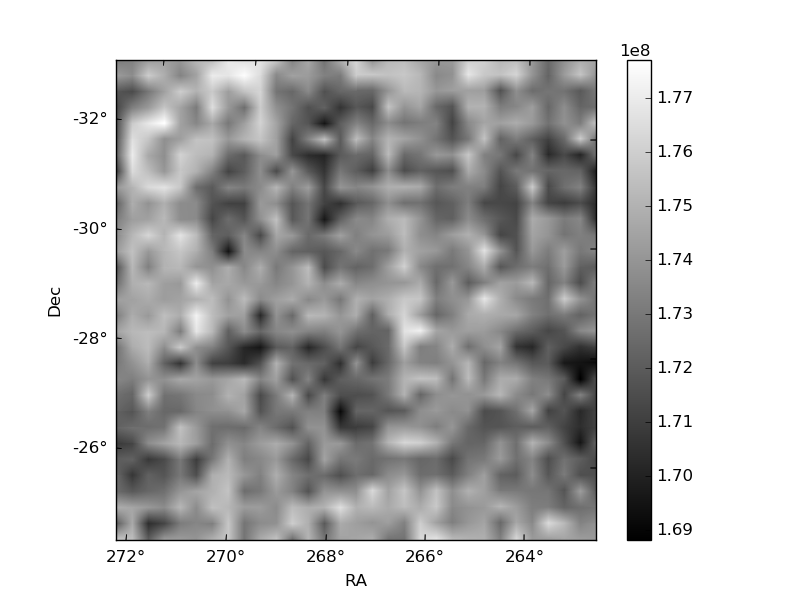
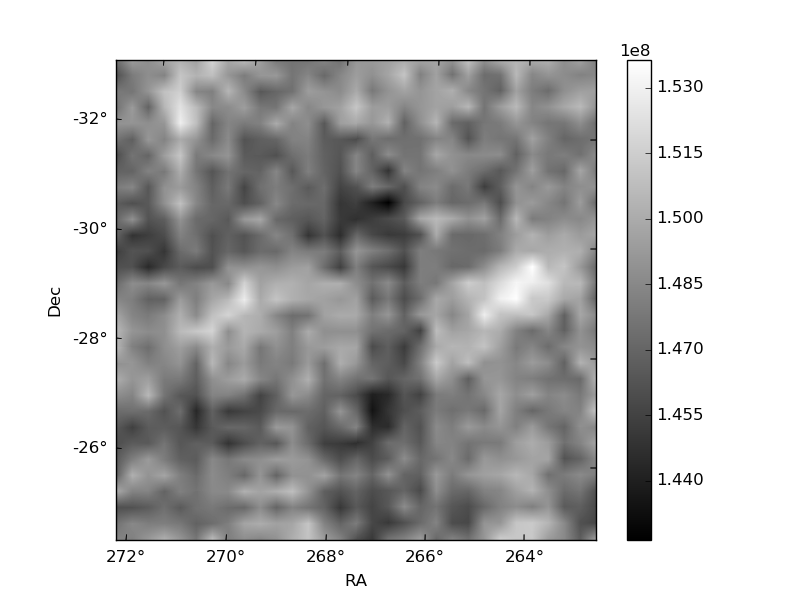
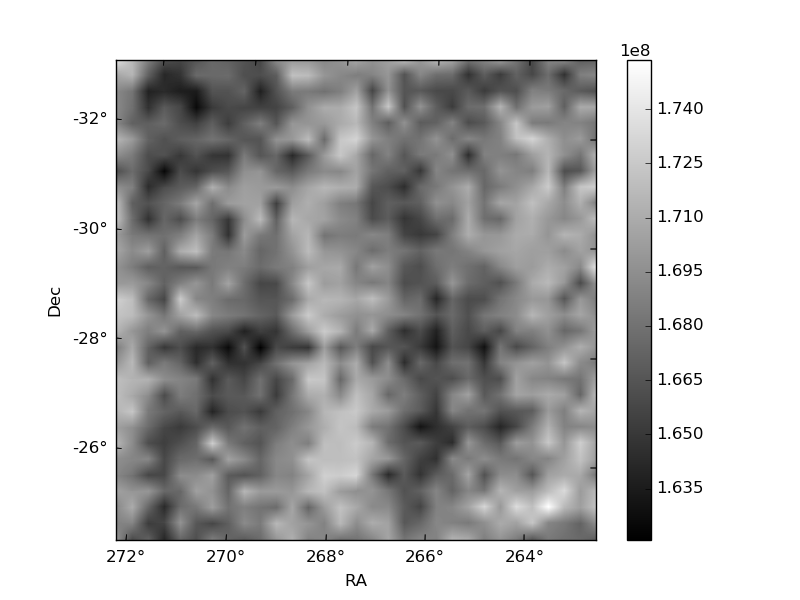
Histogram calculated using DETX and DETY for each event in the final _common_clean file
| Quadrant A | 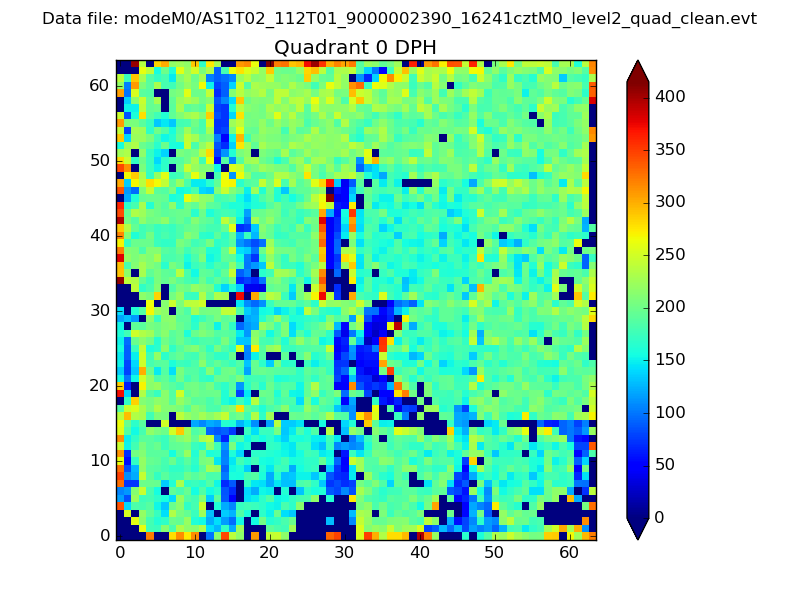 |
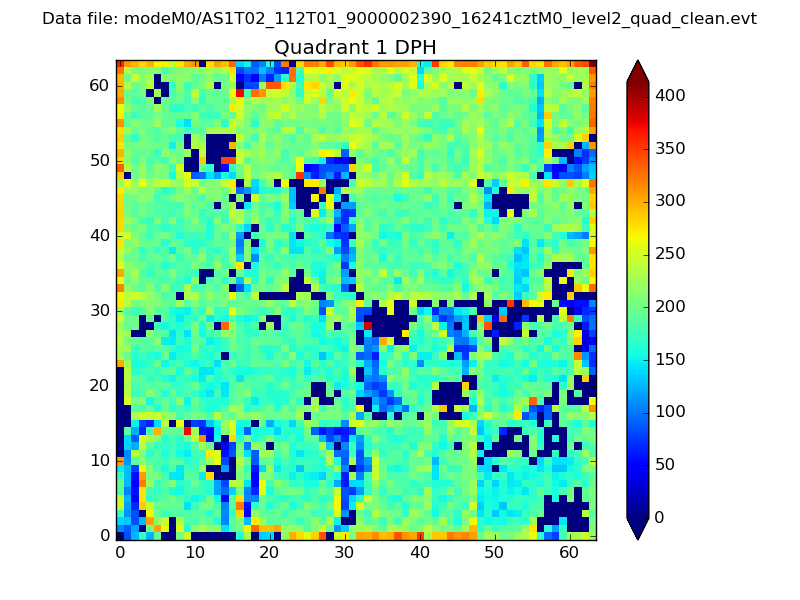 |
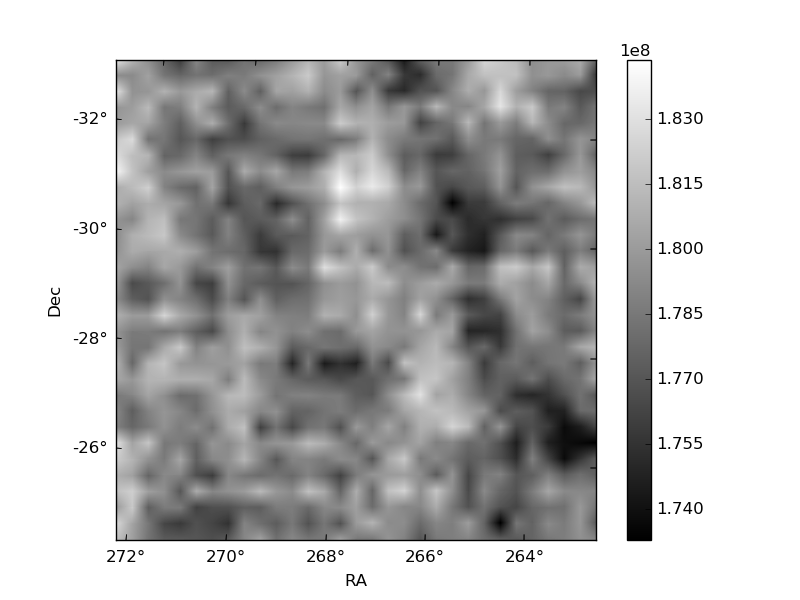
Quadrant B |
|---|---|---|---|
| Quadrant D | 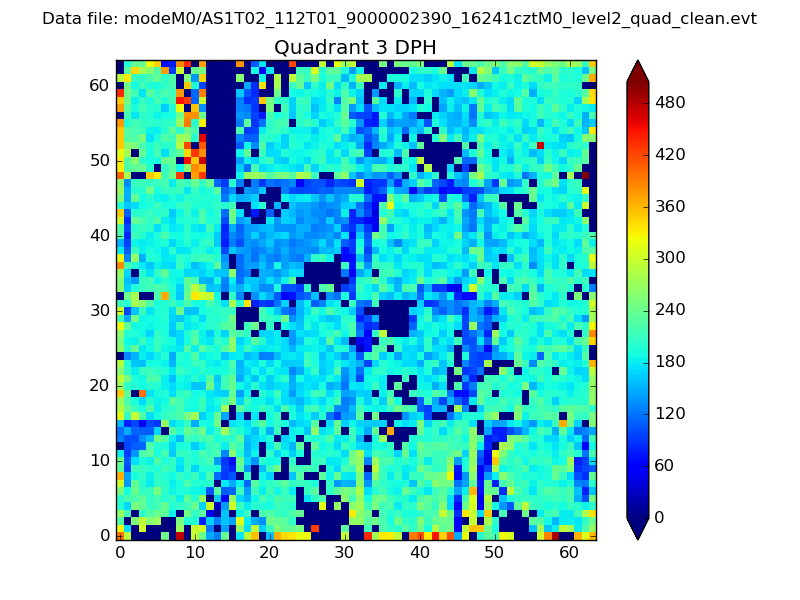 |
 |
Quadrant C |
| Plot type | Count rate plots | Images |
|---|---|---|
| Comparison with Poisson distribution Blue bars denote a histogram of data divided into 1 sec bins. Red curve is a Poisson curve with rate = median count rate of data. |
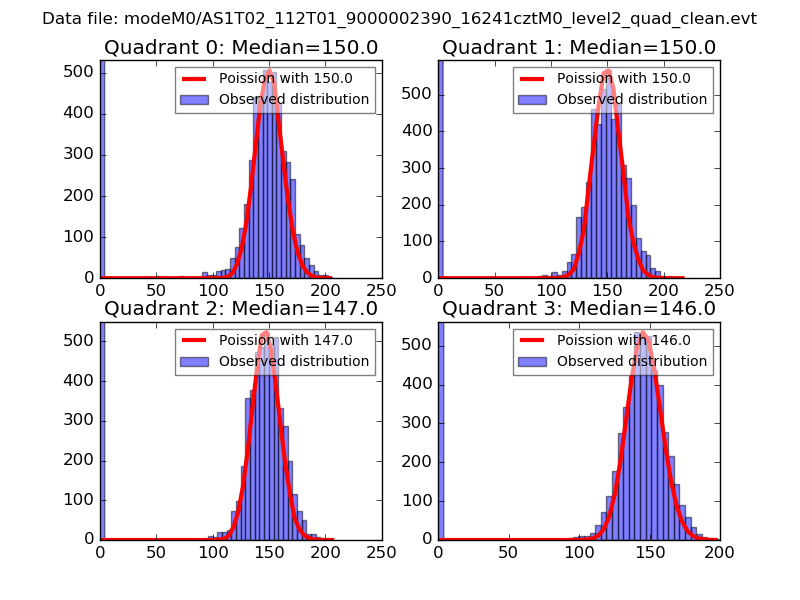 |
 |
| Quadrant-wise count rates Data is divided into 100 sec bins |
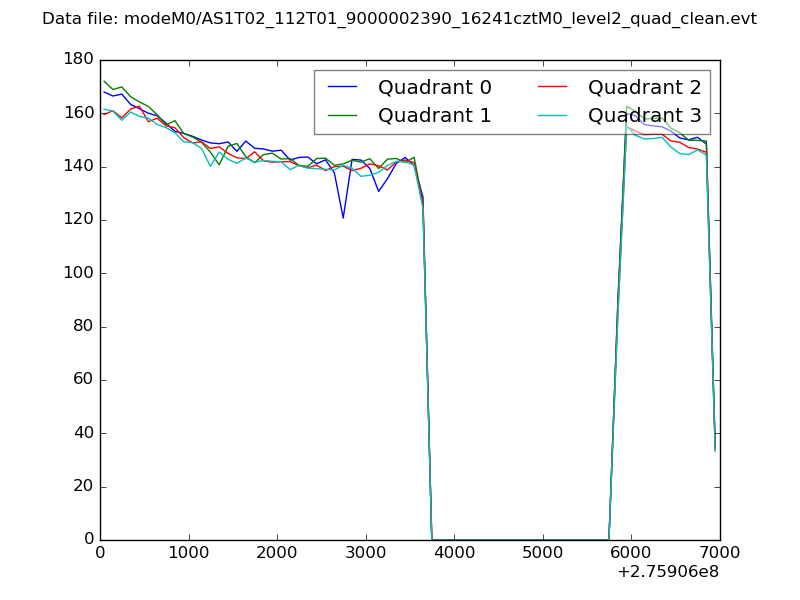 |
|
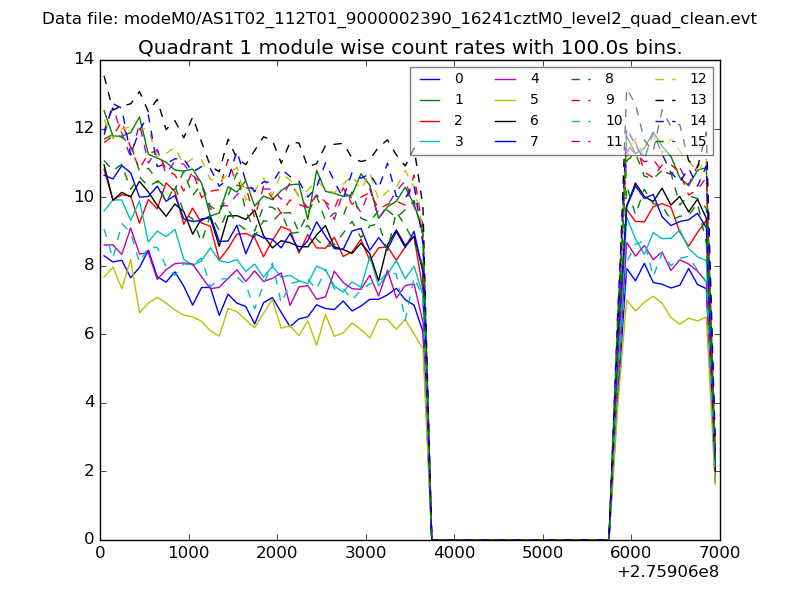
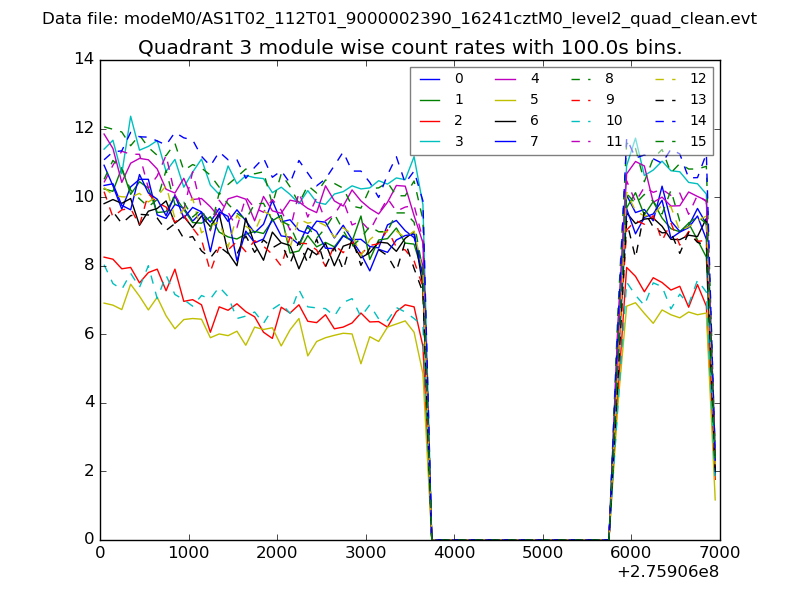
| Module-wise count rates for Quadrant A Data is divided into 100 sec bins |
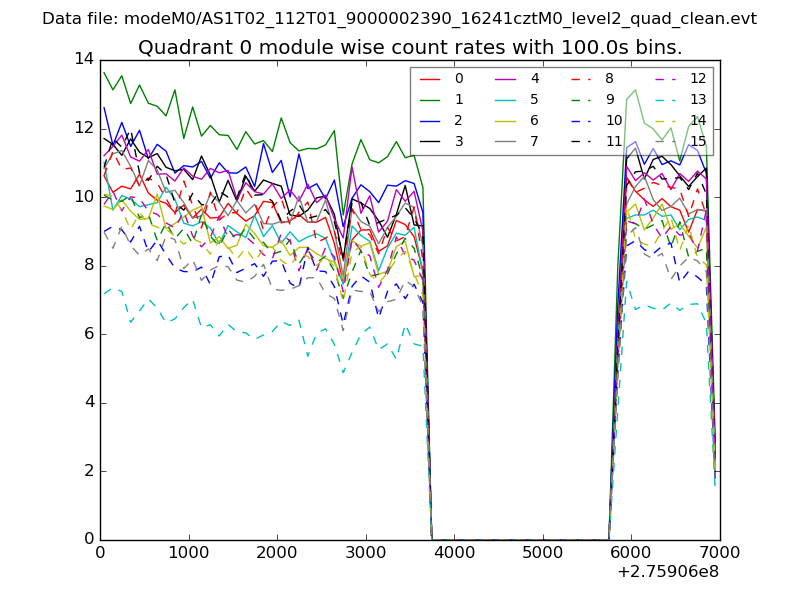 |
 |
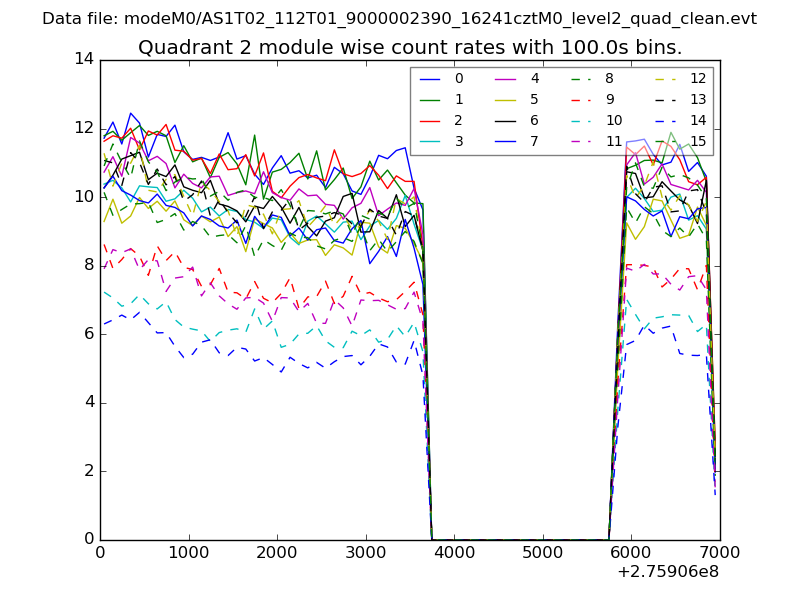
| Module-wise count rates for Quadrant B Data is divided into 100 sec bins |
 |
 |
| Module-wise count rates for Quadrant C Data is divided into 100 sec bins |
 |
 |
| Module-wise count rates for Quadrant D Data is divided into 100 sec bins |
 |
 |
| Parameter | Plot |
|---|---|
| CZT HV Monitor | 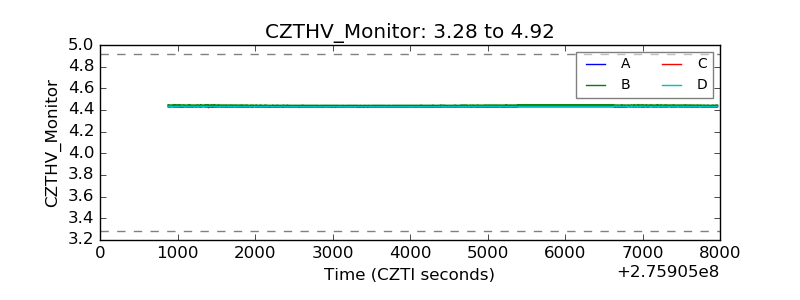 |
| D_VDD | 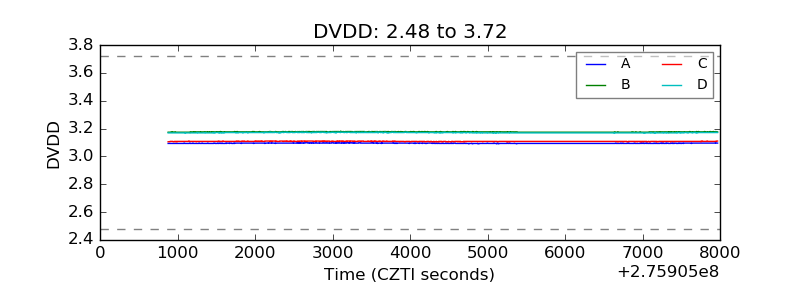 |
| Temperature 1 | 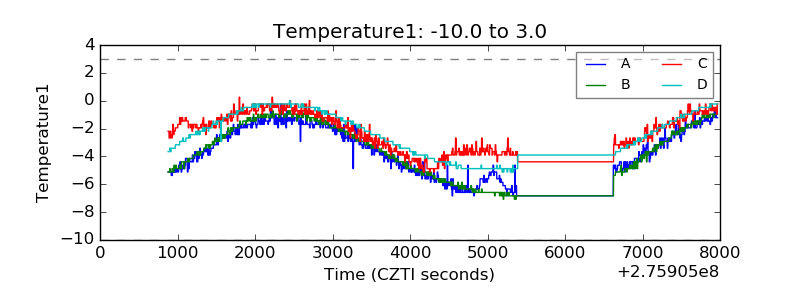 |
| Veto HV Monitor | 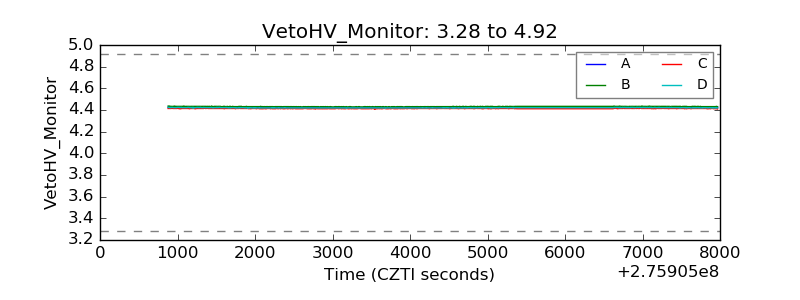 |
| Veto LLD | 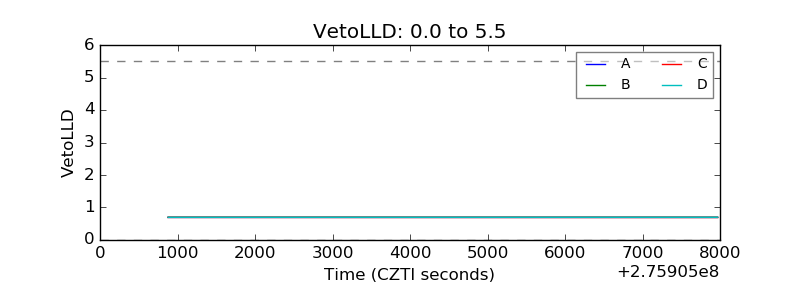 |
| Alpha Counter | 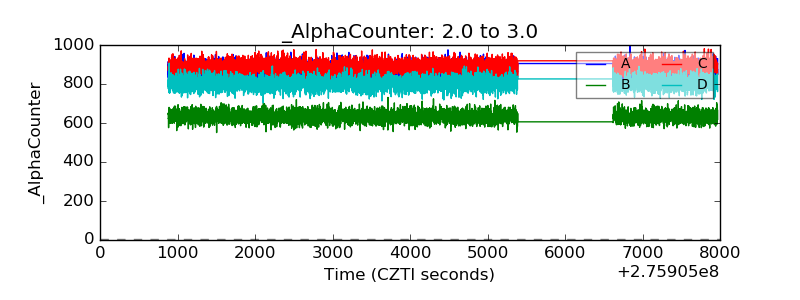 |
| _CPM_Rate | 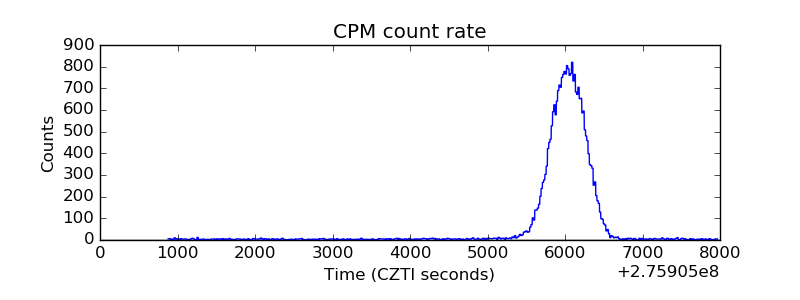 |
| CZT Counter | 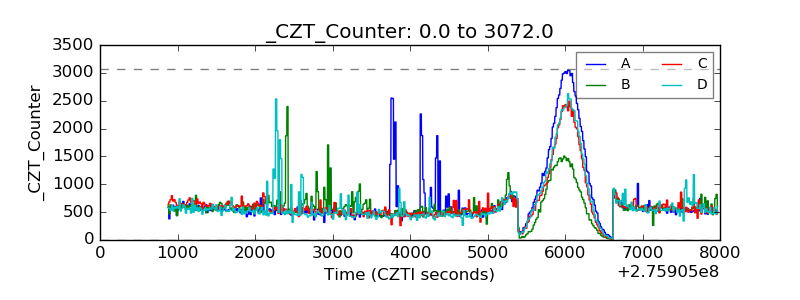 |
| +2.5 Volts monitor |  |
| +5 Volts monitor |  |
| _ROLL_ROT | 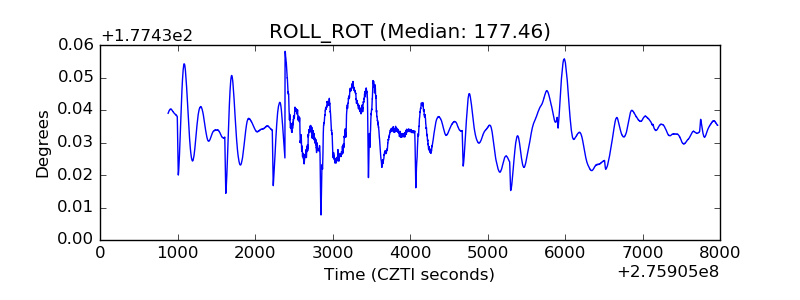 |
| _Roll_DEC | 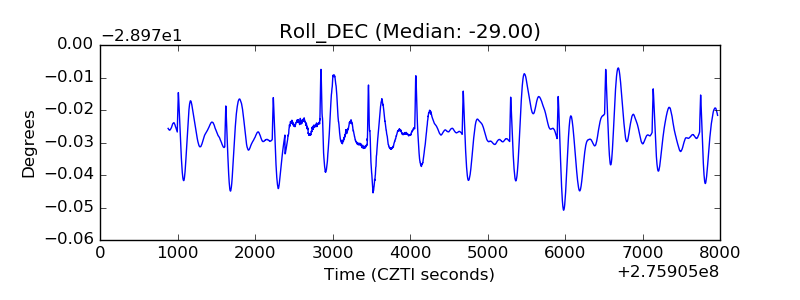 |
| _Roll_RA | 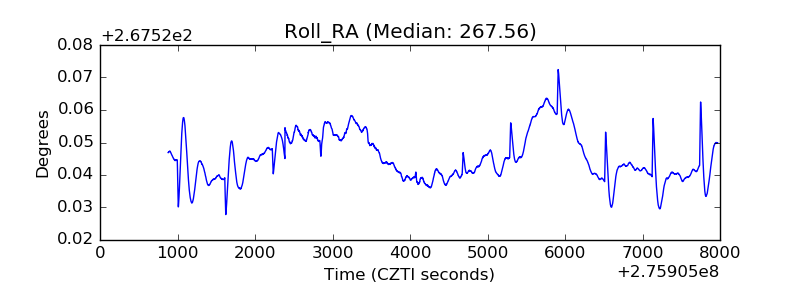 |
| Veto Counter | 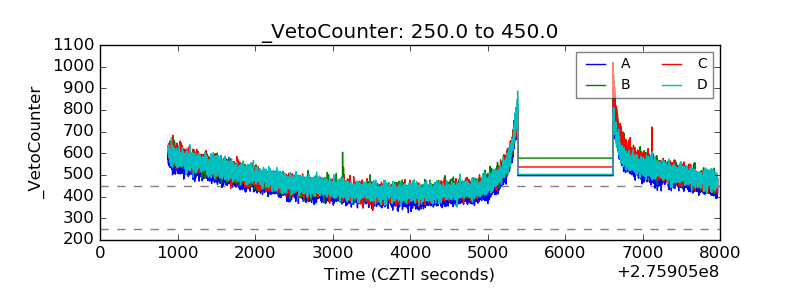 |