| Param | Original file | Final file |
|---|---|---|
| Filename | modeM0/AS1T02_112T01_9000002390_16243cztM0_level2.evt | modeM0/AS1T02_112T01_9000002390_16243cztM0_level2_quad_clean.evt |
| Size (bytes) | 559,589,760 | 106,367,040 |
| Size | 533.7 MB | 101.4 MB |
| Events in quadrant A | 3,946,641 | 682,018 |
| Events in quadrant B | 4,100,605 | 689,741 |
| Events in quadrant C | 3,656,009 | 686,135 |
| Events in quadrant D | 4,761,997 | 668,373 |
| Mode SS | |||
|---|---|---|---|
| Quadrant | BADHDUFLAG | Total packets | Discarded packets |
| A | 0 | 146 | 0 |
| B | 0 | 146 | 0 |
| C | 0 | 146 | 0 |
| D | 0 | 146 | 0 |
| Mode M9 | |||
|---|---|---|---|
| Quadrant | BADHDUFLAG | Total packets | Discarded packets |
| A | 0 | 6 | 0 |
| B | 0 | 6 | 0 |
| C | 0 | 6 | 0 |
| D | 0 | 6 | 0 |
| Mode M0 | |||
|---|---|---|---|
| Quadrant | BADHDUFLAG | Total packets | Discarded packets |
| A | 0 | 16200 | 2 |
| B | 0 | 16738 | 1 |
| C | 0 | 15346 | 1 |
| D | 0 | 18977 | 1 |
| Quadrant | Total seconds | Saturated seconds | Saturation percentage |
|---|---|---|---|
| A | 7103 | 233 | 3.280304% |
| B | 7103 | 134 | 1.886527% |
| C | 7103 | 88 | 1.238913% |
| D | 7103 | 288 | 4.054625% |
Noise dominated data is calculated using 1-second bins in cleaned event files. If a bin has >2000 counts, and if more than 50% of those come from <1% of pixels, then it is considered to be noise-dominated and hence unusable.
| Quadrant | # 1 sec bins | Bins with >0 counts | Bins with >2000 counts | High rate bins dominated by noise | Noise dominated (total time) | Noise dominated (detector-on time) | Marked lightcurve |
|---|---|---|---|---|---|---|---|
| A | 7774 | 7105 | 109 | 109 | 1.40% | 1.53% | 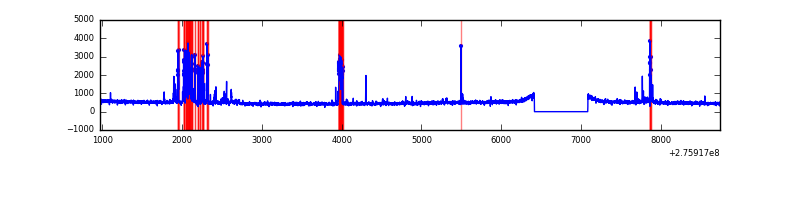 |
| B | 7774 | 7105 | 43 | 43 | 0.55% | 0.61% | 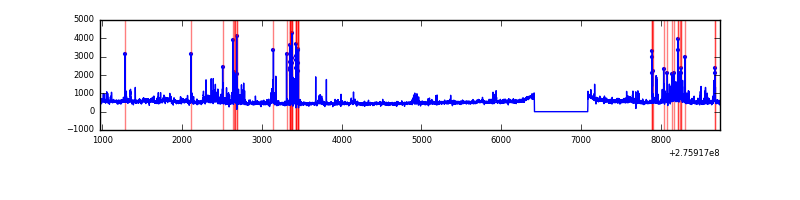 |
| C | 7774 | 7105 | 1 | 1 | 0.01% | 0.01% | 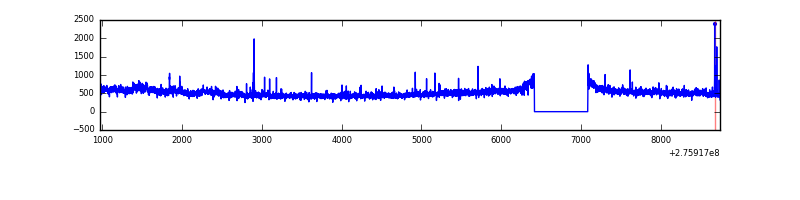 |
| D | 7774 | 7105 | 207 | 207 | 2.66% | 2.91% | 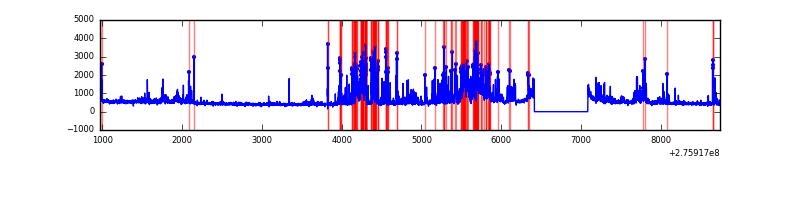 |
Top three noisy pixels from each quadrant. If the there are fewer than three noisy pixels in the level2.evt file, extra rows are filled as -1
| Pixel properties | Quadrant properties | ||||||
|---|---|---|---|---|---|---|---|
| Quadrant | DetID | PixID | Counts | Sigma | Mean | Median | Sigma |
| A | 15 | 174 | 527622 | 2954.15 | 881 | 864 | 178.3 |
| A | 8 | 247 | 16789 | 89.31 | 881 | 864 | 178.3 |
| A | 13 | 248 | 9273 | 47.16 | 881 | 864 | 178.3 |
| B | 7 | 220 | 319866 | 1895.46 | 879 | 859 | 168.3 |
| B | 0 | 198 | 86955 | 511.56 | 879 | 859 | 168.3 |
| B | 0 | 219 | 55701 | 325.86 | 879 | 859 | 168.3 |
| C | 3 | 233 | 214956 | 1084.61 | 844 | 849 | 197.4 |
| C | 14 | 238 | 128942 | 648.89 | 844 | 849 | 197.4 |
| C | 0 | 207 | 17136 | 82.51 | 844 | 849 | 197.4 |
| D | 1 | 52 | 1234655 | 5913.48 | 856 | 833 | 208.6 |
| D | 13 | 112 | 230958 | 1102.95 | 856 | 833 | 208.6 |
| D | 10 | 70 | 30123 | 140.38 | 856 | 833 | 208.6 |
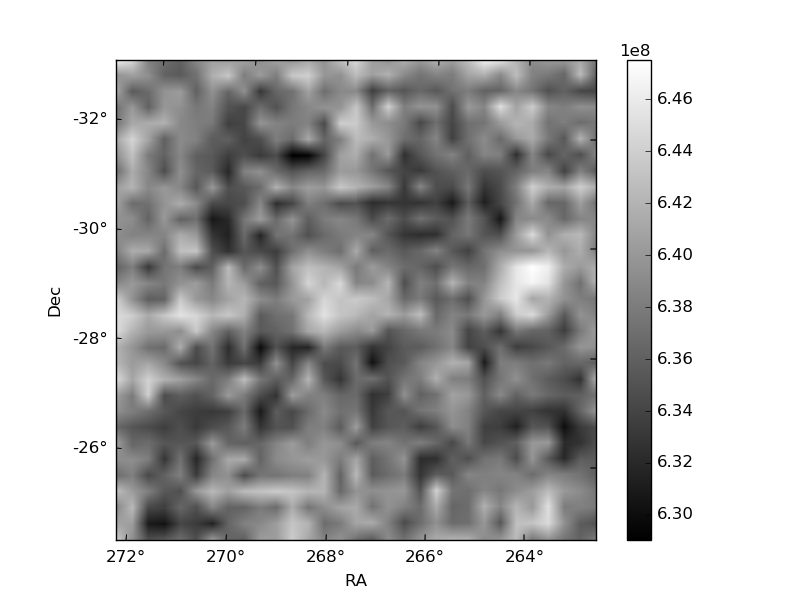
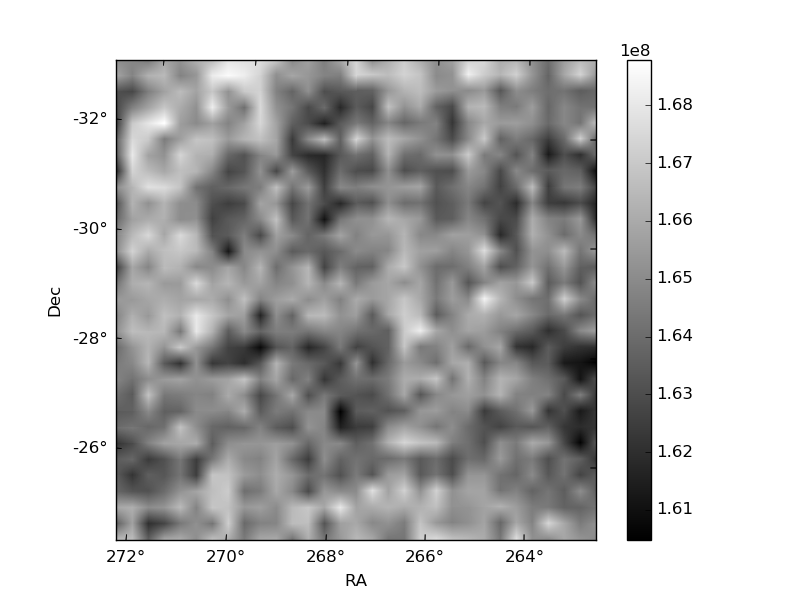
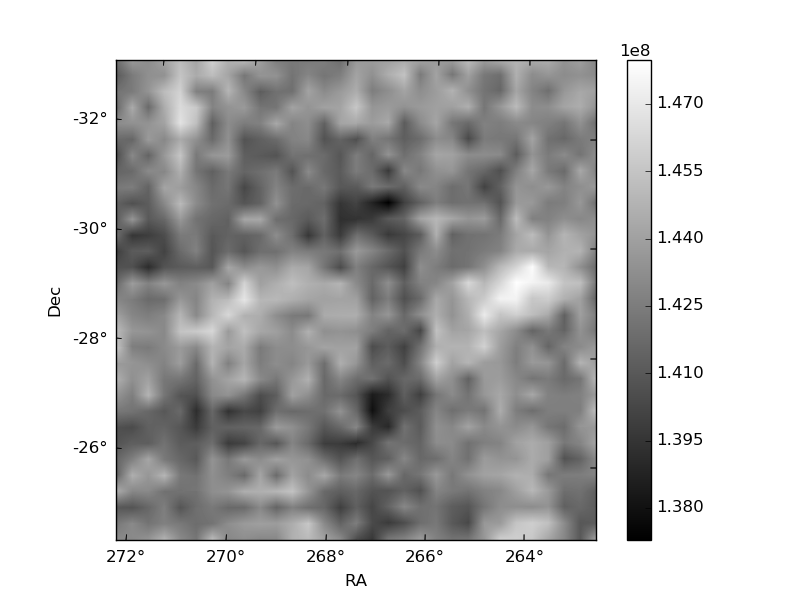
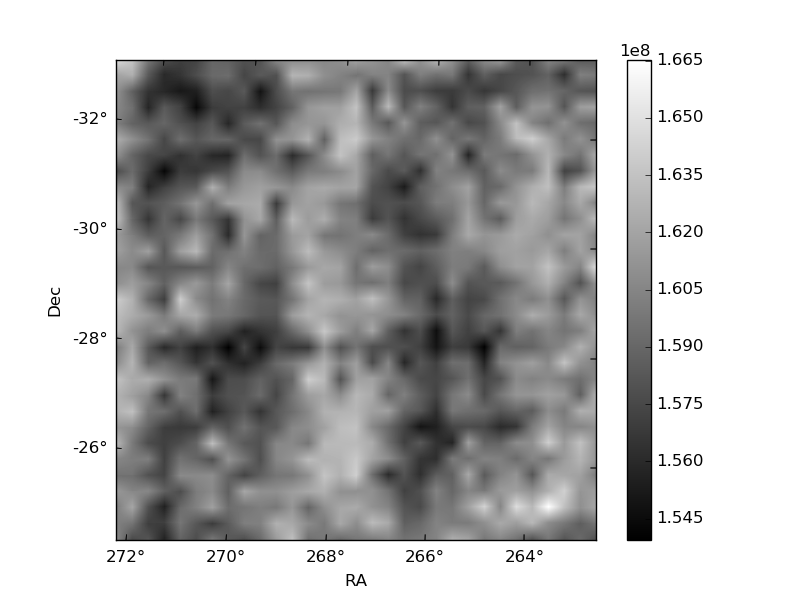
Histogram calculated using DETX and DETY for each event in the final _common_clean file
| Quadrant A | 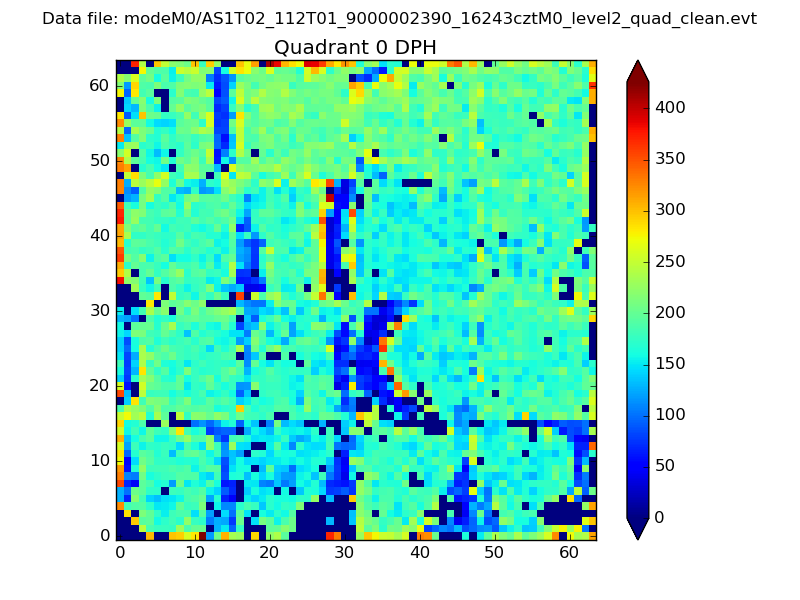 |
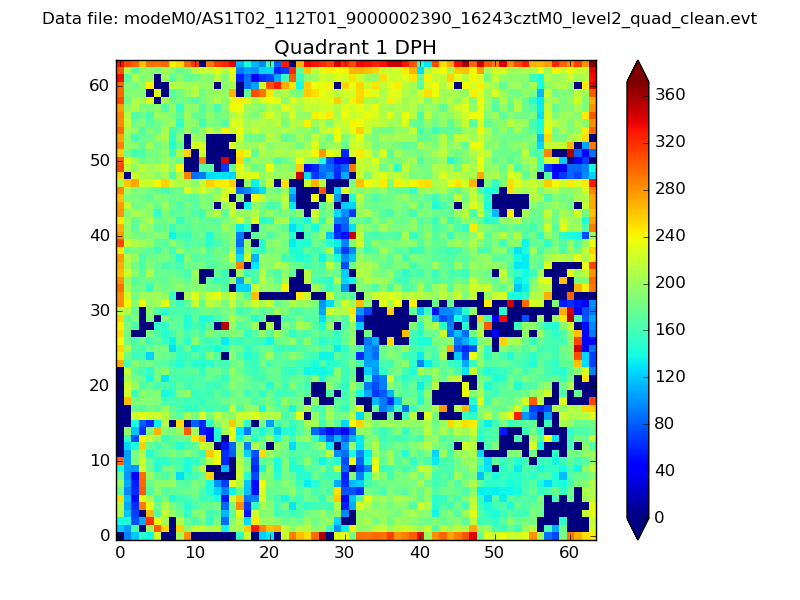 |
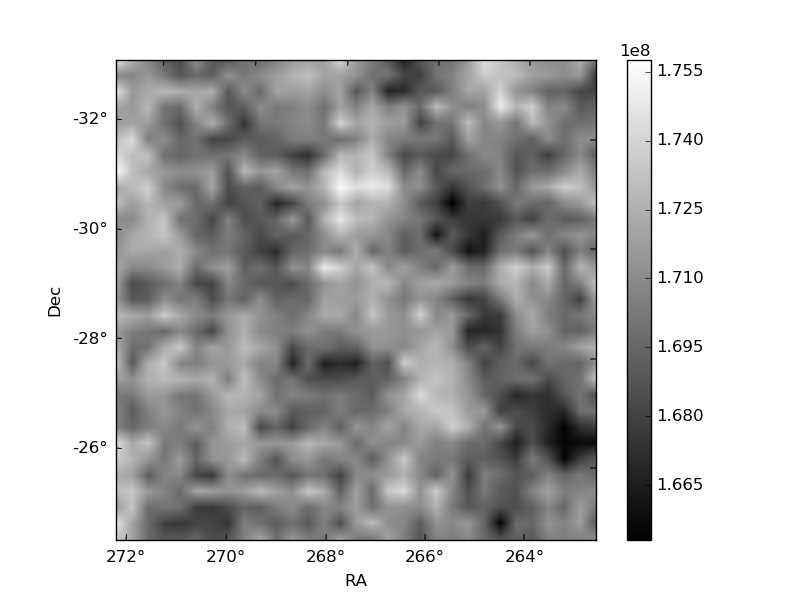
Quadrant B |
|---|---|---|---|
| Quadrant D | 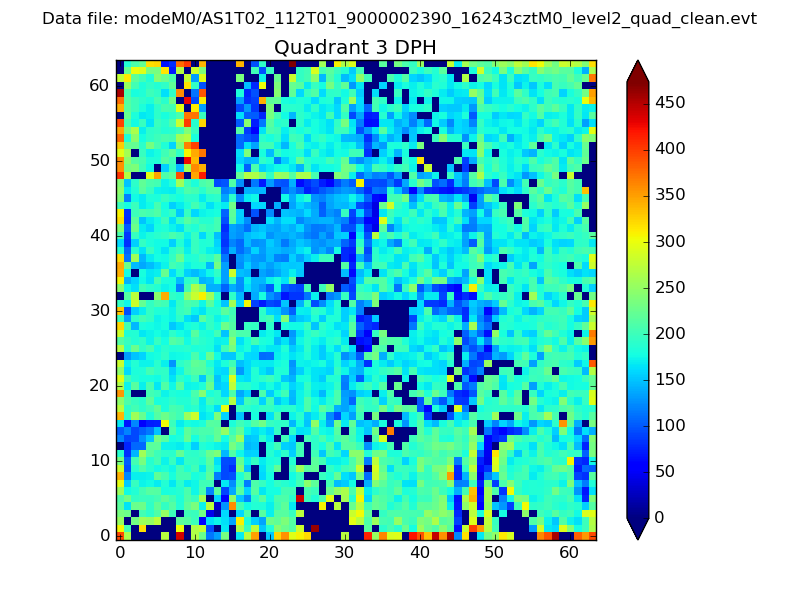 |
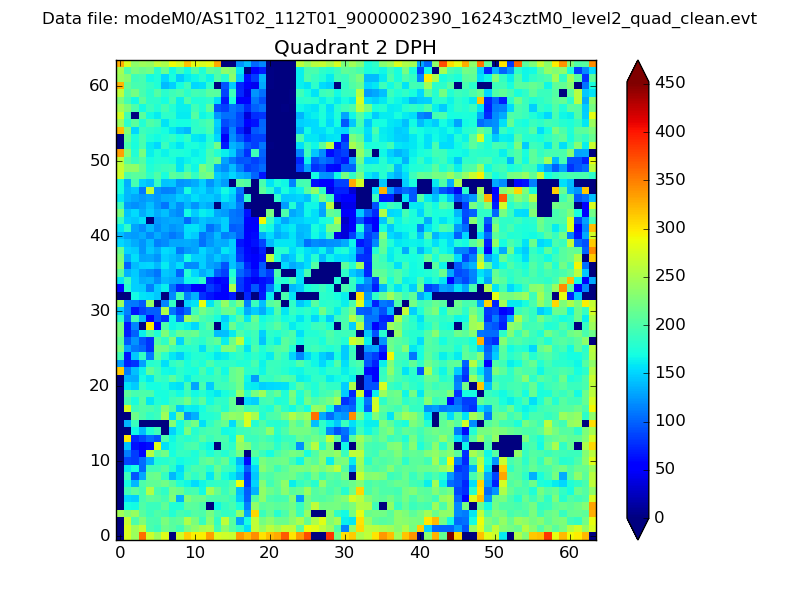 |
Quadrant C |
| Plot type | Count rate plots | Images |
|---|---|---|
| Comparison with Poisson distribution Blue bars denote a histogram of data divided into 1 sec bins. Red curve is a Poisson curve with rate = median count rate of data. |
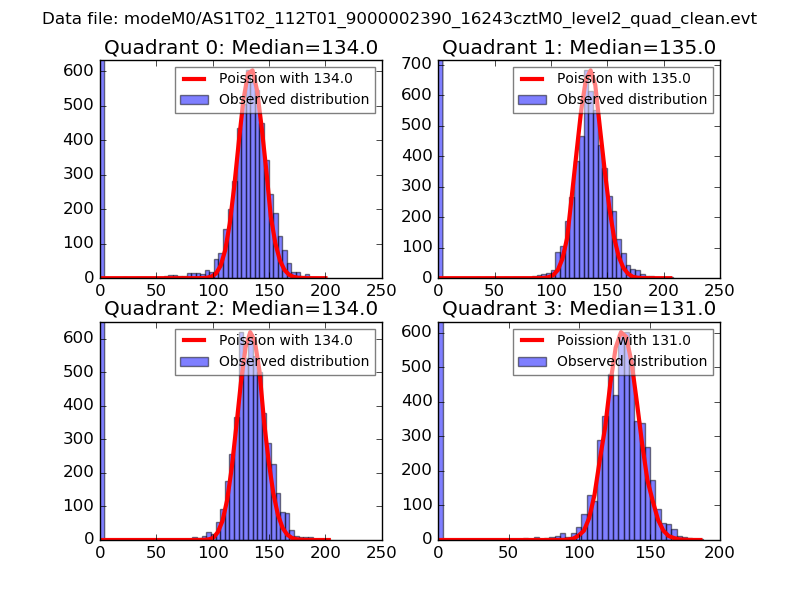 |
 |
| Quadrant-wise count rates Data is divided into 100 sec bins |
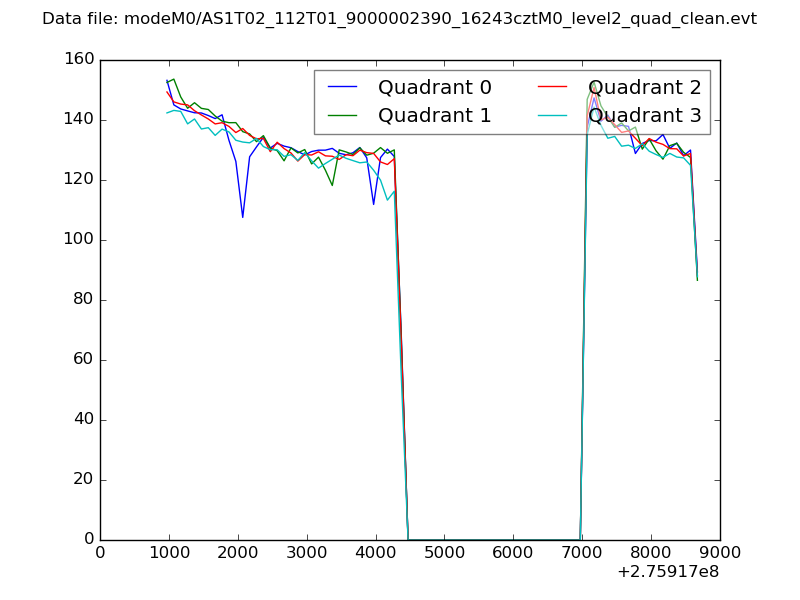 |
|
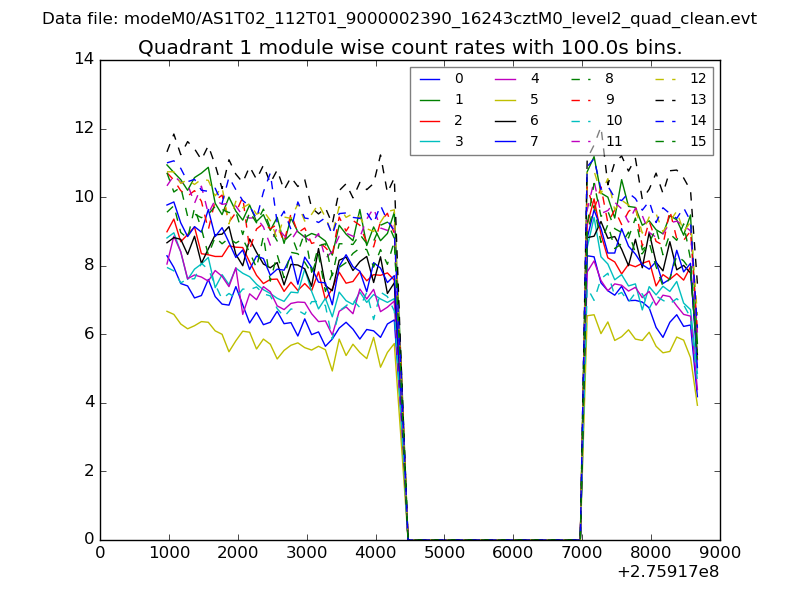
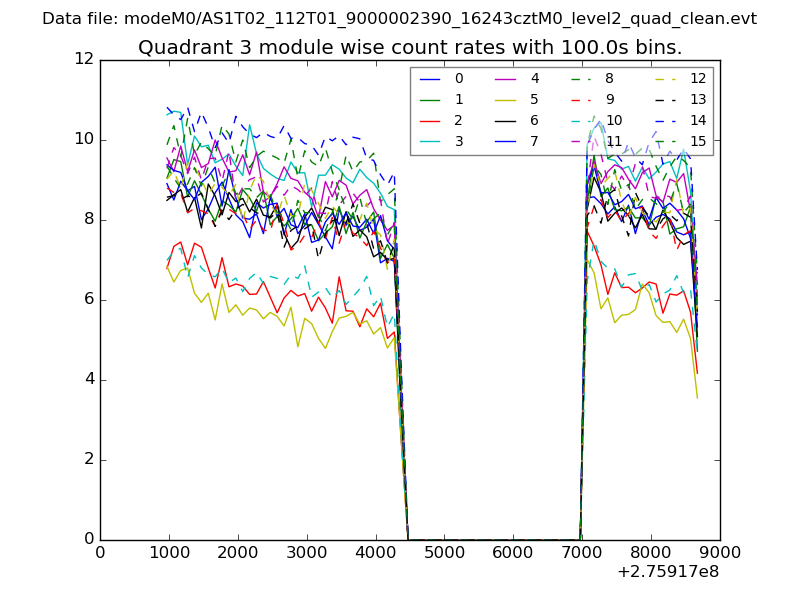
| Module-wise count rates for Quadrant A Data is divided into 100 sec bins |
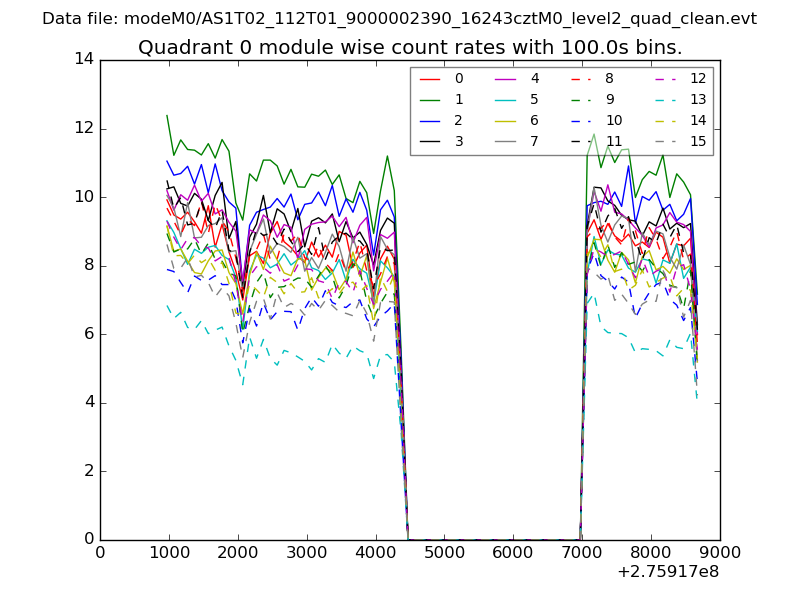 |
 |
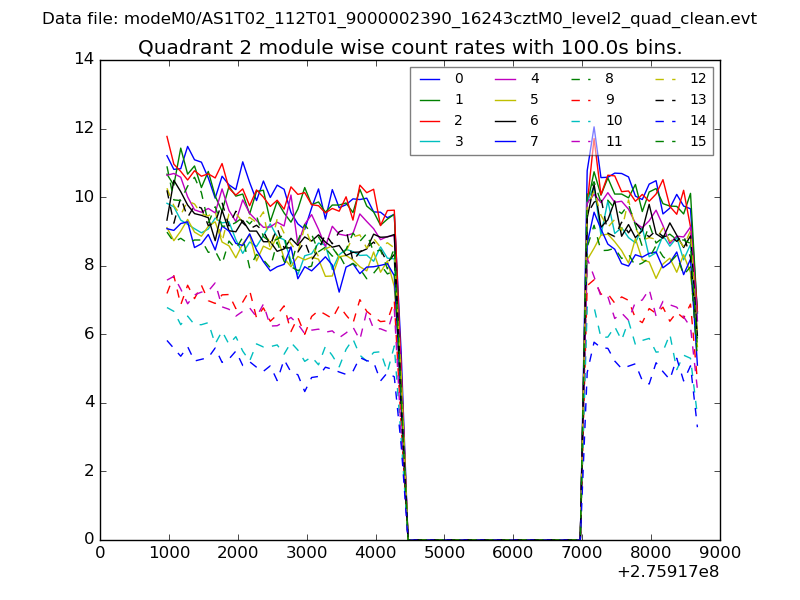
| Module-wise count rates for Quadrant B Data is divided into 100 sec bins |
 |
 |
| Module-wise count rates for Quadrant C Data is divided into 100 sec bins |
 |
 |
| Module-wise count rates for Quadrant D Data is divided into 100 sec bins |
 |
 |
| Parameter | Plot |
|---|---|
| CZT HV Monitor | 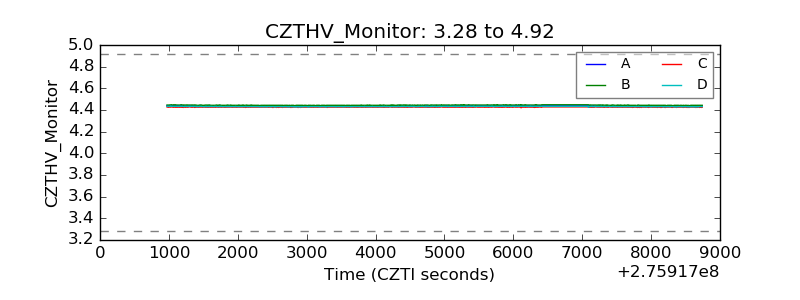 |
| D_VDD | 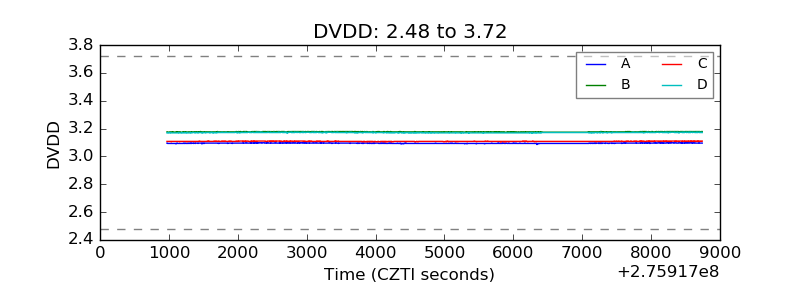 |
| Temperature 1 | 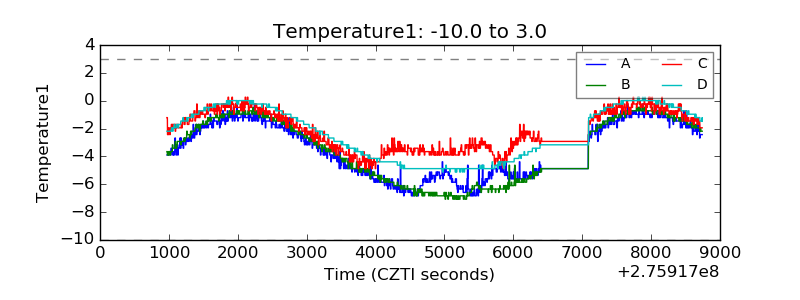 |
| Veto HV Monitor | 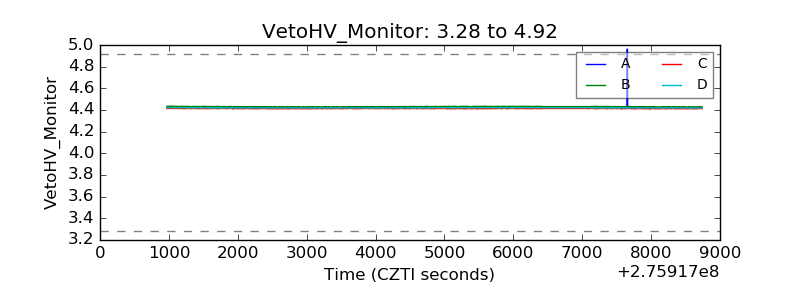 |
| Veto LLD | 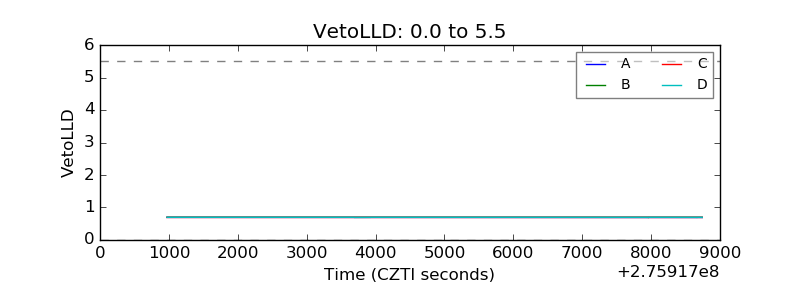 |
| Alpha Counter | 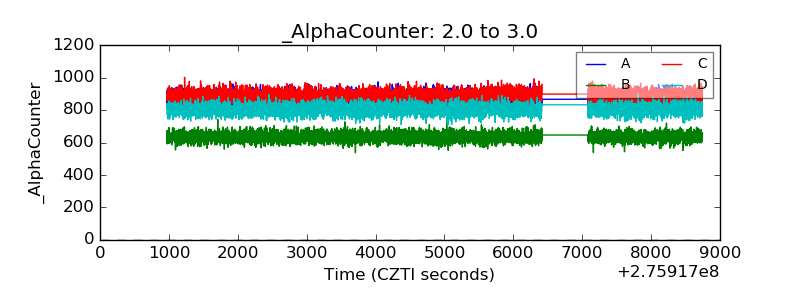 |
| _CPM_Rate | 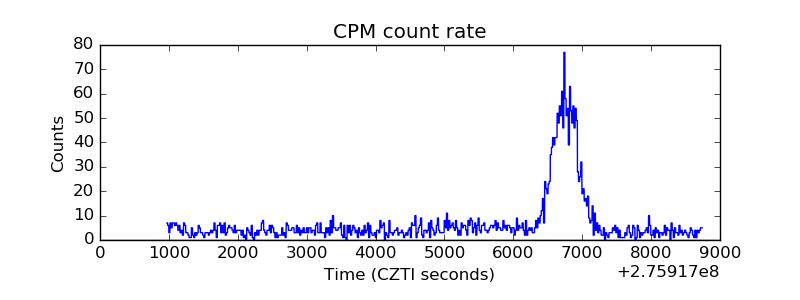 |
| CZT Counter | 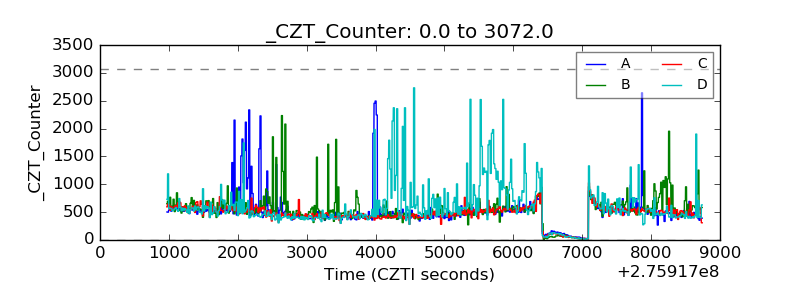 |
| +2.5 Volts monitor |  |
| +5 Volts monitor |  |
| _ROLL_ROT | 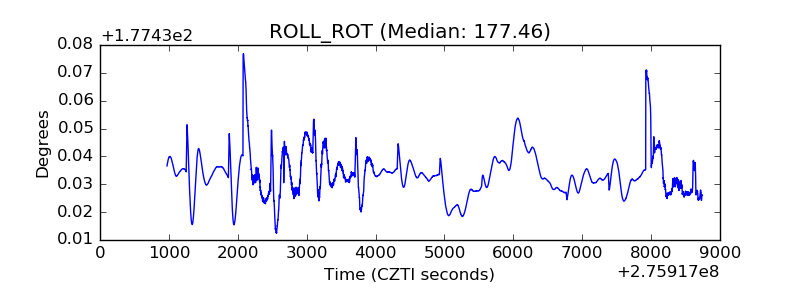 |
| _Roll_DEC | 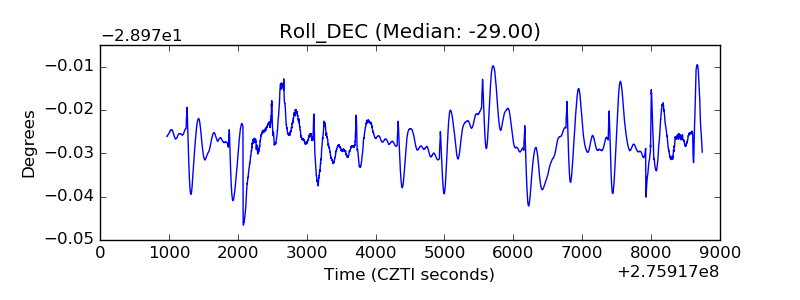 |
| _Roll_RA | 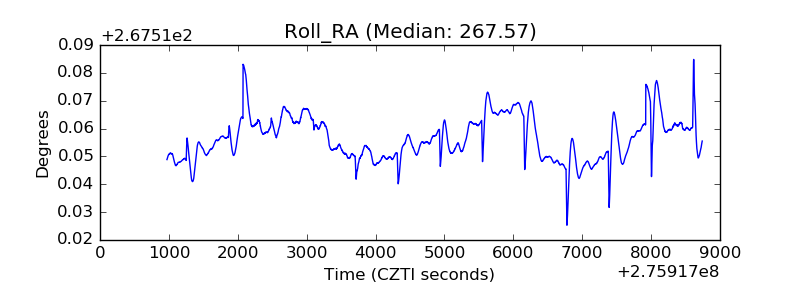 |
| Veto Counter | 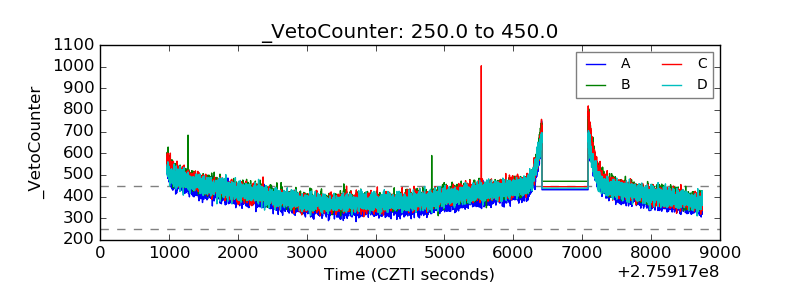 |