| Param | Original file | Final file |
|---|---|---|
| Filename | modeM0/AS1T02_112T01_9000002390_16244cztM0_level2.evt | modeM0/AS1T02_112T01_9000002390_16244cztM0_level2_quad_clean.evt |
| Size (bytes) | 544,973,760 | 107,400,960 |
| Size | 519.7 MB | 102.4 MB |
| Events in quadrant A | 4,190,165 | 688,976 |
| Events in quadrant B | 4,308,486 | 689,639 |
| Events in quadrant C | 3,728,747 | 688,571 |
| Events in quadrant D | 3,774,997 | 670,384 |
| Mode SS | |||
|---|---|---|---|
| Quadrant | BADHDUFLAG | Total packets | Discarded packets |
| A | 0 | 150 | 0 |
| B | 0 | 150 | 0 |
| C | 0 | 150 | 0 |
| D | 0 | 150 | 0 |
| Mode M9 | |||
|---|---|---|---|
| Quadrant | BADHDUFLAG | Total packets | Discarded packets |
| A | 0 | 2 | 0 |
| B | 0 | 2 | 0 |
| C | 0 | 2 | 0 |
| D | 0 | 2 | 0 |
| Mode M0 | |||
|---|---|---|---|
| Quadrant | BADHDUFLAG | Total packets | Discarded packets |
| A | 0 | 17232 | 2 |
| B | 0 | 17569 | 1 |
| C | 0 | 15651 | 1 |
| D | 0 | 16272 | 1 |
| Quadrant | Total seconds | Saturated seconds | Saturation percentage |
|---|---|---|---|
| A | 7400 | 248 | 3.351351% |
| B | 7400 | 160 | 2.162162% |
| C | 7400 | 89 | 1.202703% |
| D | 7400 | 52 | 0.702703% |
Noise dominated data is calculated using 1-second bins in cleaned event files. If a bin has >2000 counts, and if more than 50% of those come from <1% of pixels, then it is considered to be noise-dominated and hence unusable.
| Quadrant | # 1 sec bins | Bins with >0 counts | Bins with >2000 counts | High rate bins dominated by noise | Noise dominated (total time) | Noise dominated (detector-on time) | Marked lightcurve |
|---|---|---|---|---|---|---|---|
| A | 7666 | 7402 | 112 | 112 | 1.46% | 1.51% | 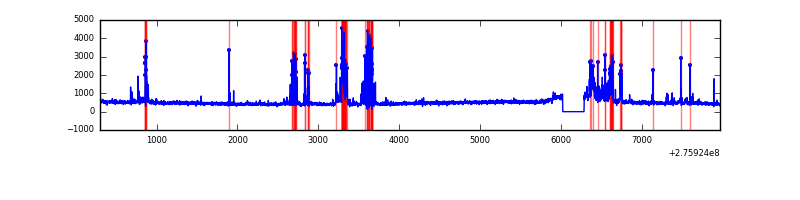 |
| B | 7666 | 7402 | 51 | 51 | 0.67% | 0.69% | 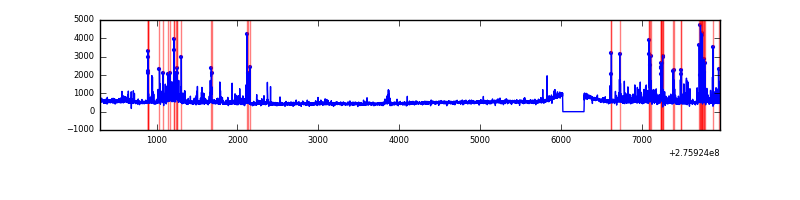 |
| C | 7666 | 7402 | 2 | 2 | 0.03% | 0.03% | 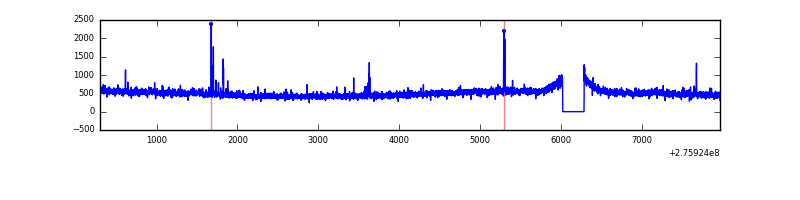 |
| D | 7666 | 7402 | 25 | 25 | 0.33% | 0.34% | 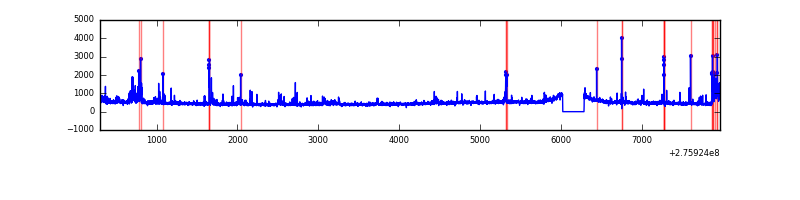 |
Top three noisy pixels from each quadrant. If the there are fewer than three noisy pixels in the level2.evt file, extra rows are filled as -1
| Pixel properties | Quadrant properties | ||||||
|---|---|---|---|---|---|---|---|
| Quadrant | DetID | PixID | Counts | Sigma | Mean | Median | Sigma |
| A | 15 | 174 | 667889 | 3611.04 | 905 | 886 | 184.7 |
| A | 9 | 143 | 17334 | 89.05 | 905 | 886 | 184.7 |
| A | 13 | 248 | 16522 | 84.65 | 905 | 886 | 184.7 |
| B | 7 | 220 | 338307 | 1924.38 | 907 | 884 | 175.3 |
| B | 3 | 64 | 124068 | 702.54 | 907 | 884 | 175.3 |
| B | 0 | 198 | 59306 | 333.19 | 907 | 884 | 175.3 |
| C | 3 | 233 | 163839 | 800.34 | 870 | 876 | 203.6 |
| C | 14 | 238 | 133285 | 650.28 | 870 | 876 | 203.6 |
| C | 0 | 207 | 40667 | 195.42 | 870 | 876 | 203.6 |
| D | 1 | 52 | 204461 | 943.4 | 887 | 864 | 215.8 |
| D | 7 | 38 | 97997 | 450.08 | 887 | 864 | 215.8 |
| D | 10 | 70 | 47233 | 214.86 | 887 | 864 | 215.8 |
Histogram calculated using DETX and DETY for each event in the final _common_clean file
| Quadrant A | 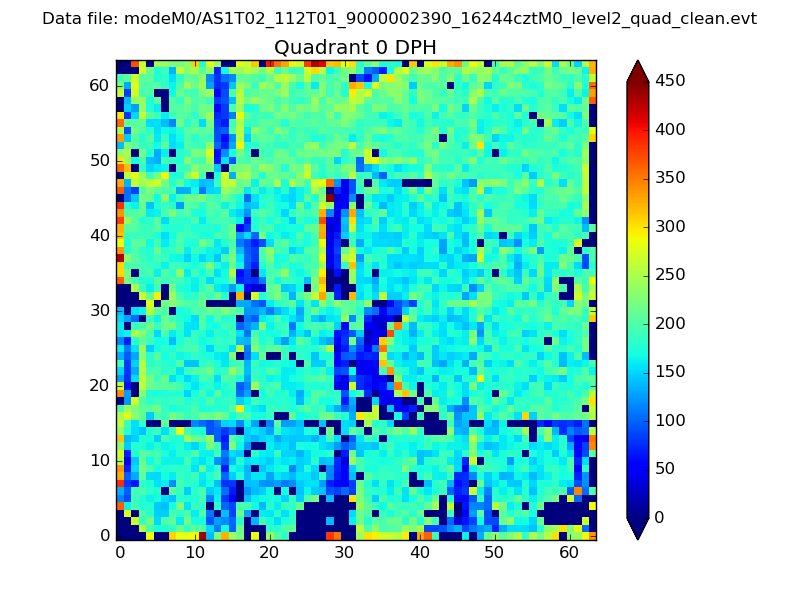 |
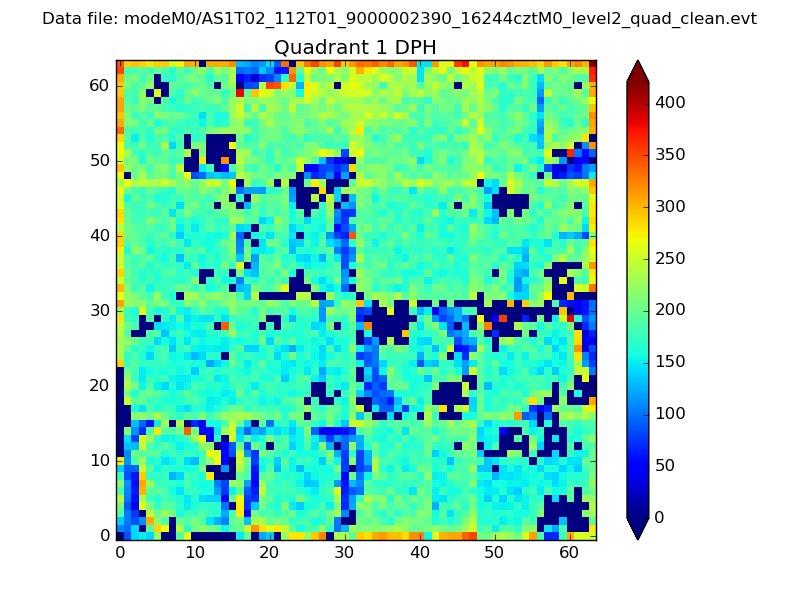 |
Quadrant B |
|---|---|---|---|
| Quadrant D |  |
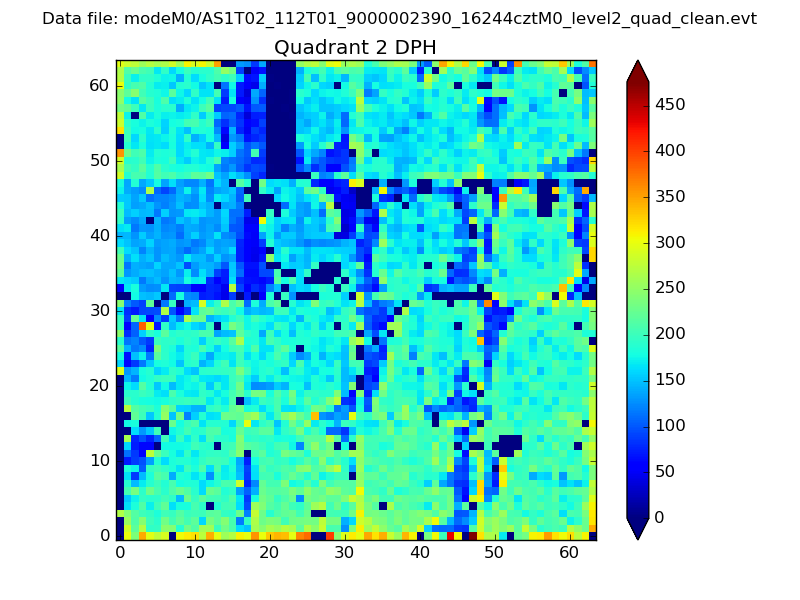 |
Quadrant C |
| Plot type | Count rate plots | Images |
|---|---|---|
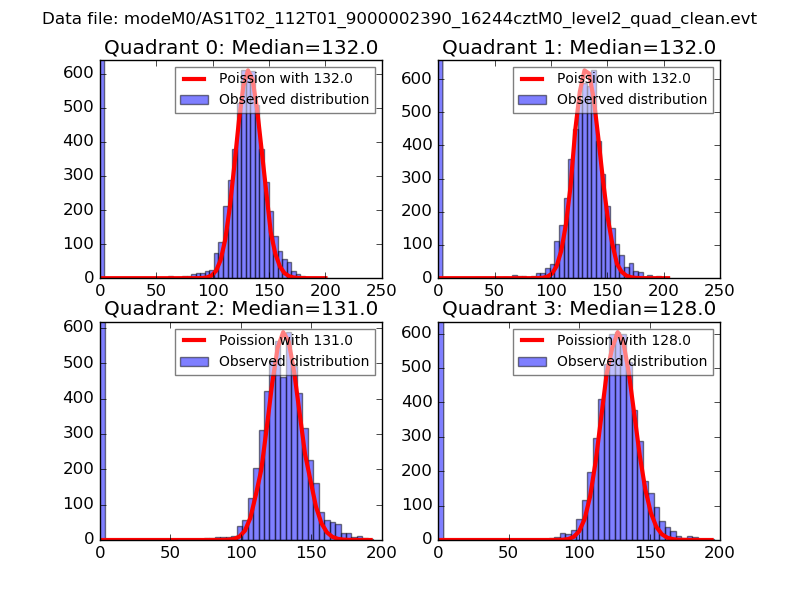
| Comparison with Poisson distribution Blue bars denote a histogram of data divided into 1 sec bins. Red curve is a Poisson curve with rate = median count rate of data. |
 |
 |
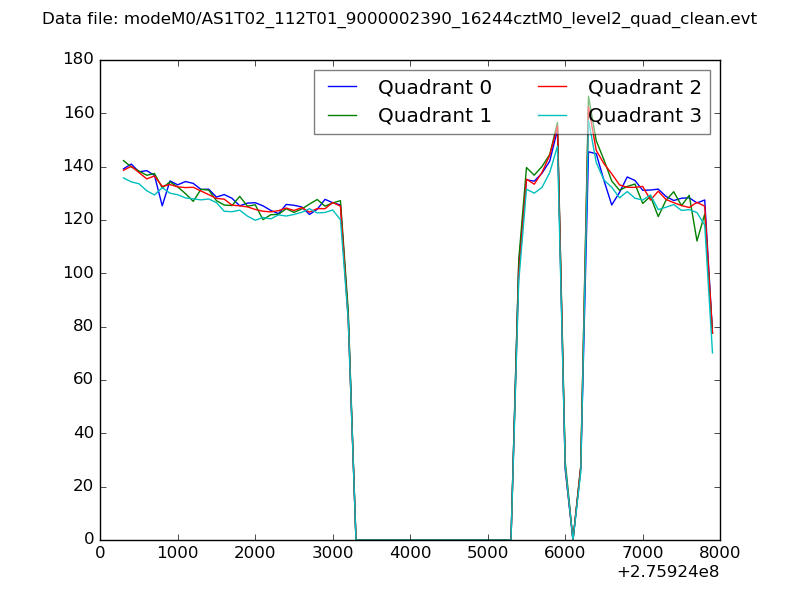
| Quadrant-wise count rates Data is divided into 100 sec bins |
 |
|
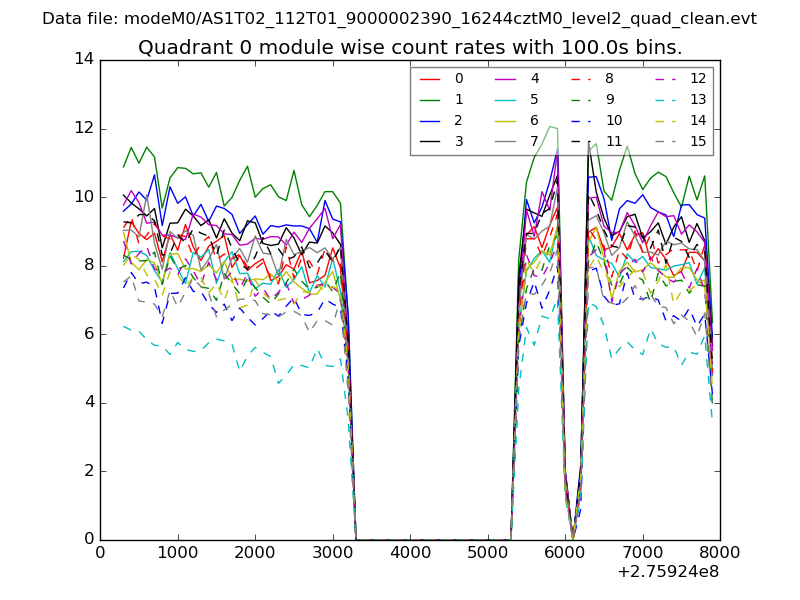
| Module-wise count rates for Quadrant A Data is divided into 100 sec bins |
 |
 |
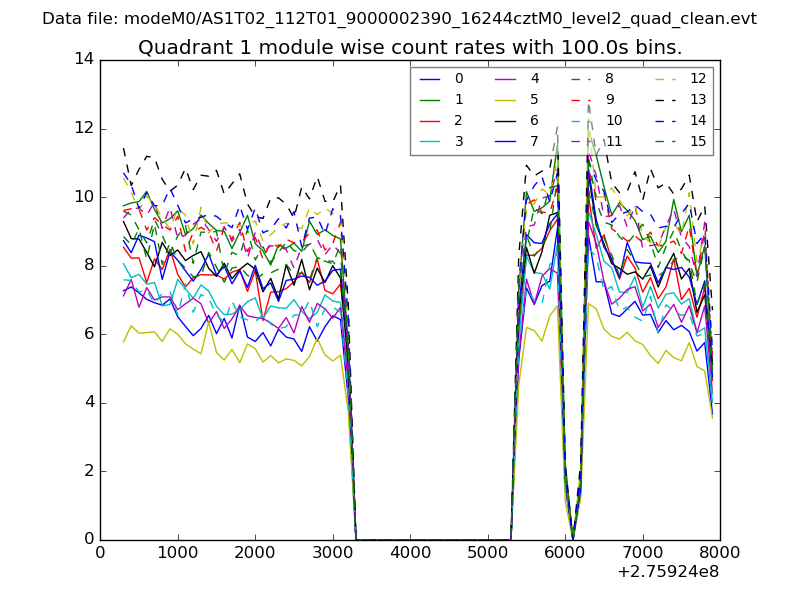
| Module-wise count rates for Quadrant B Data is divided into 100 sec bins |
 |
 |
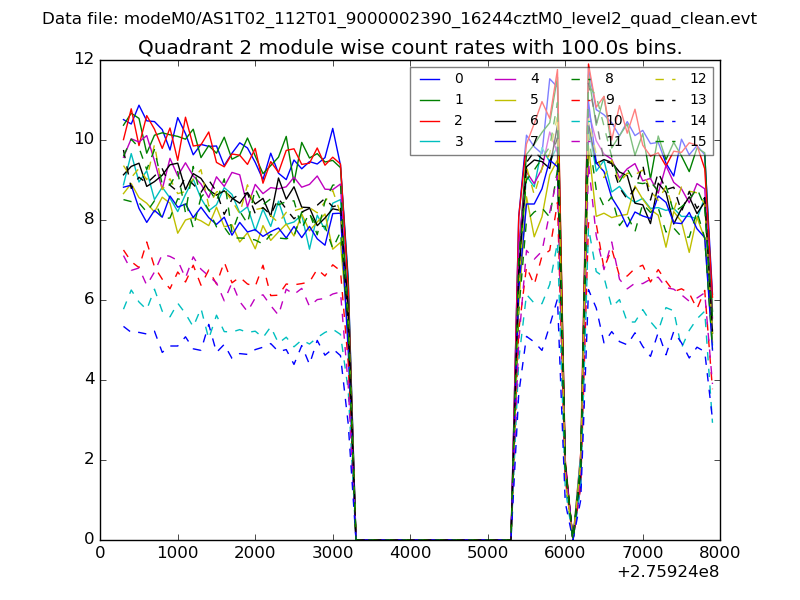
| Module-wise count rates for Quadrant C Data is divided into 100 sec bins |
 |
 |
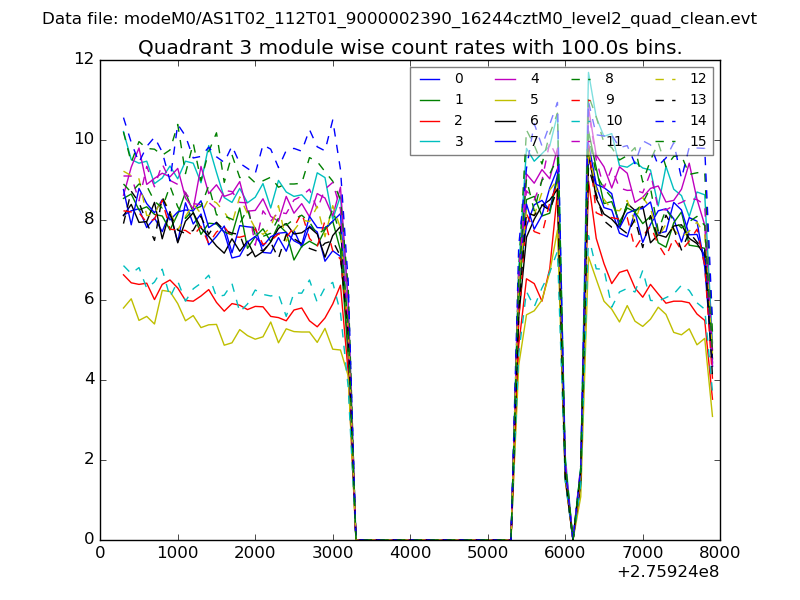
| Module-wise count rates for Quadrant D Data is divided into 100 sec bins |
 |
 |
| Parameter | Plot |
|---|---|
| CZT HV Monitor | 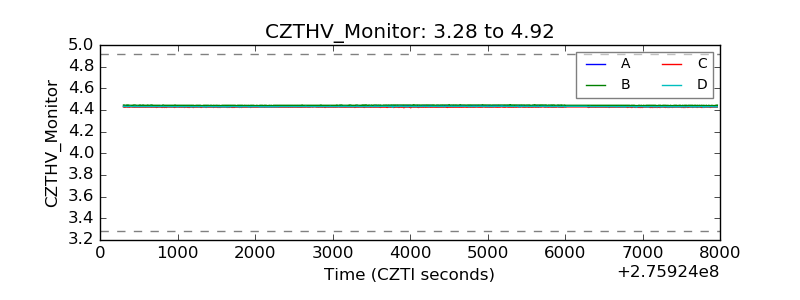 |
| D_VDD | 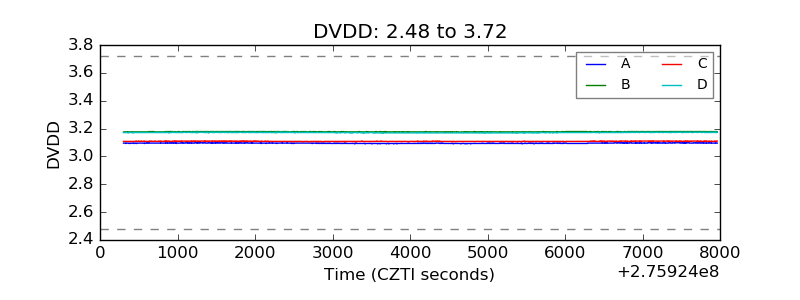 |
| Temperature 1 | 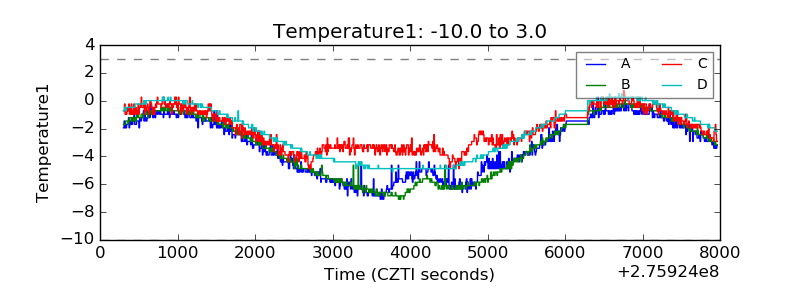 |
| Veto HV Monitor |  |
| Veto LLD | 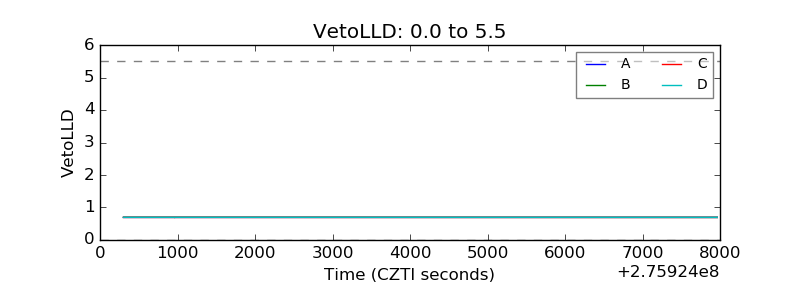 |
| Alpha Counter | 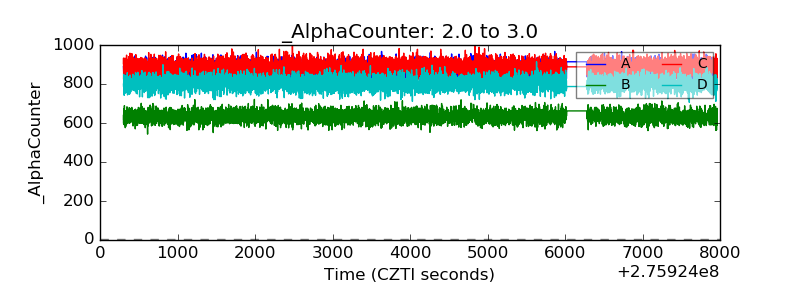 |
| _CPM_Rate | 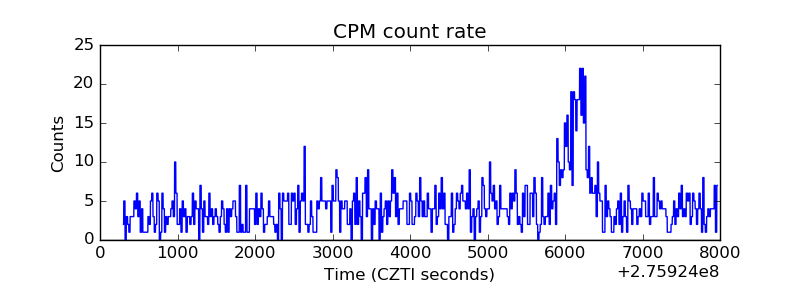 |
| CZT Counter |  |
| +2.5 Volts monitor |  |
| +5 Volts monitor |  |
| _ROLL_ROT | 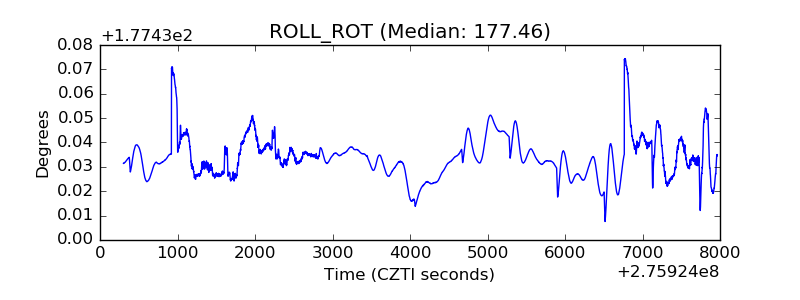 |
| _Roll_DEC | 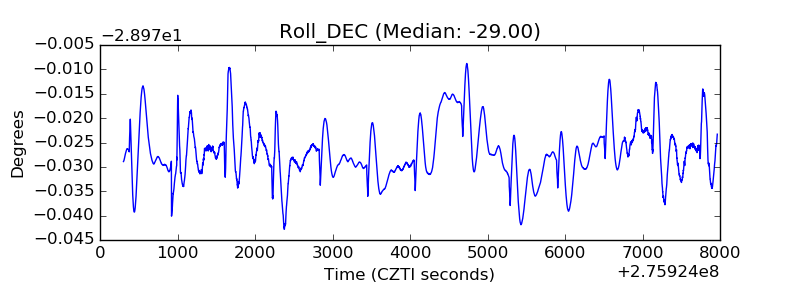 |
| _Roll_RA | 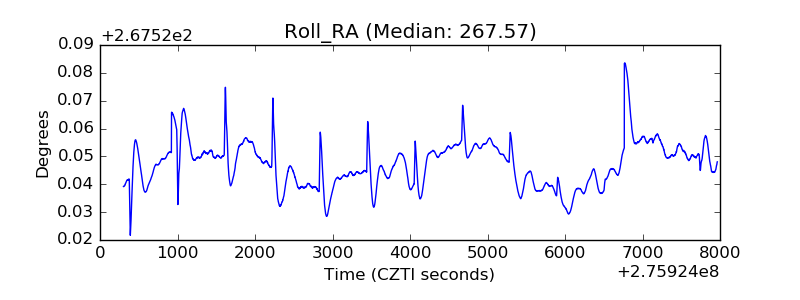 |
| Veto Counter | 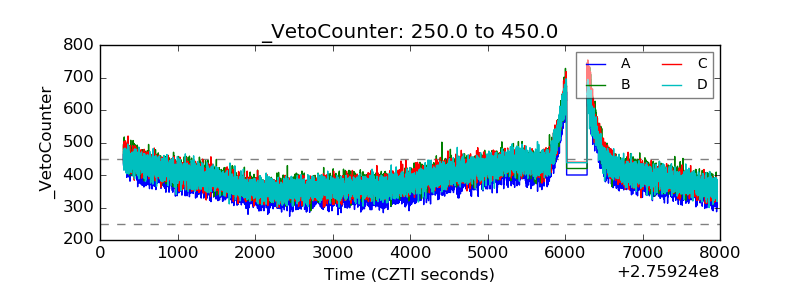 |