| Param | Original file | Final file |
|---|---|---|
| Filename | modeM0/AS1T02_112T01_9000002390_16245cztM0_level2.evt | modeM0/AS1T02_112T01_9000002390_16245cztM0_level2_quad_clean.evt |
| Size (bytes) | 538,171,200 | 105,122,880 |
| Size | 513.2 MB | 100.3 MB |
| Events in quadrant A | 3,962,904 | 672,027 |
| Events in quadrant B | 4,510,768 | 668,927 |
| Events in quadrant C | 3,626,199 | 672,675 |
| Events in quadrant D | 3,699,384 | 657,793 |
| Mode SS | |||
|---|---|---|---|
| Quadrant | BADHDUFLAG | Total packets | Discarded packets |
| A | 0 | 150 | 0 |
| B | 0 | 150 | 0 |
| C | 0 | 150 | 0 |
| D | 0 | 150 | 0 |
| Mode M9 | |||
|---|---|---|---|
| Quadrant | BADHDUFLAG | Total packets | Discarded packets |
| A | 0 | 2 | 0 |
| B | 0 | 2 | 0 |
| C | 0 | 2 | 0 |
| D | 0 | 2 | 0 |
| Mode M0 | |||
|---|---|---|---|
| Quadrant | BADHDUFLAG | Total packets | Discarded packets |
| A | 0 | 16594 | 2 |
| B | 0 | 18173 | 1 |
| C | 0 | 15358 | 1 |
| D | 0 | 15999 | 1 |
| Quadrant | Total seconds | Saturated seconds | Saturation percentage |
|---|---|---|---|
| A | 7355 | 193 | 2.624065% |
| B | 7355 | 245 | 3.331067% |
| C | 7355 | 59 | 0.802175% |
| D | 7355 | 60 | 0.815772% |
Noise dominated data is calculated using 1-second bins in cleaned event files. If a bin has >2000 counts, and if more than 50% of those come from <1% of pixels, then it is considered to be noise-dominated and hence unusable.
| Quadrant | # 1 sec bins | Bins with >0 counts | Bins with >2000 counts | High rate bins dominated by noise | Noise dominated (total time) | Noise dominated (detector-on time) | Marked lightcurve |
|---|---|---|---|---|---|---|---|
| A | 7581 | 7357 | 94 | 94 | 1.24% | 1.28% | 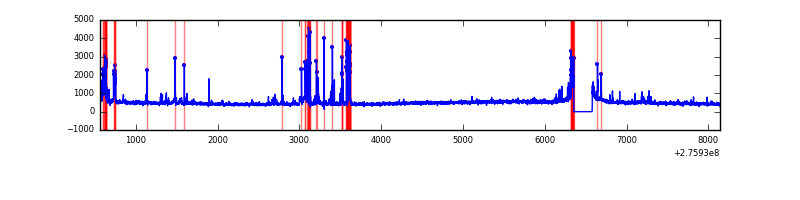 |
| B | 7581 | 7357 | 109 | 109 | 1.44% | 1.48% | 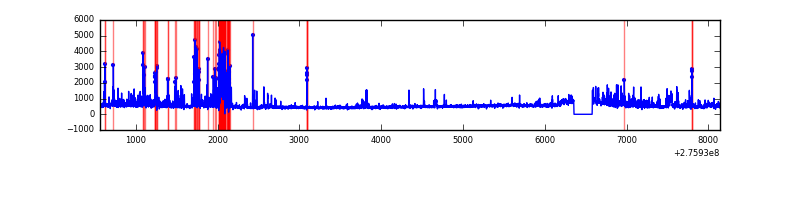 |
| C | 7581 | 7357 | 0 | 0 | 0.00% | 0.00% | 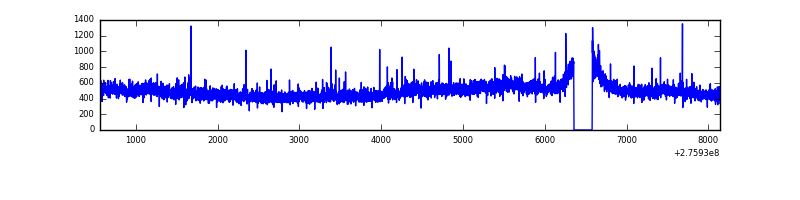 |
| D | 7581 | 7357 | 31 | 31 | 0.41% | 0.42% | 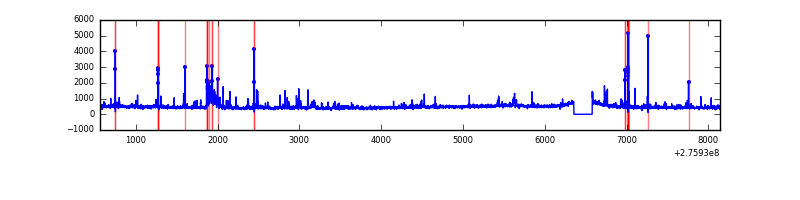 |
Top three noisy pixels from each quadrant. If the there are fewer than three noisy pixels in the level2.evt file, extra rows are filled as -1
| Pixel properties | Quadrant properties | ||||||
|---|---|---|---|---|---|---|---|
| Quadrant | DetID | PixID | Counts | Sigma | Mean | Median | Sigma |
| A | 15 | 174 | 535228 | 2949.45 | 885 | 867 | 181.2 |
| A | 9 | 143 | 18539 | 97.54 | 885 | 867 | 181.2 |
| A | 0 | 226 | 7783 | 38.17 | 885 | 867 | 181.2 |
| B | 3 | 64 | 412796 | 2407.88 | 884 | 862 | 171.1 |
| B | 7 | 220 | 327651 | 1910.18 | 884 | 862 | 171.1 |
| B | 0 | 198 | 47184 | 270.77 | 884 | 862 | 171.1 |
| C | 3 | 233 | 162353 | 805.58 | 852 | 856 | 200.5 |
| C | 14 | 238 | 129566 | 642.03 | 852 | 856 | 200.5 |
| C | 0 | 207 | 7006 | 30.68 | 852 | 856 | 200.5 |
| D | 7 | 38 | 117057 | 538.44 | 864 | 841 | 215.8 |
| D | 1 | 52 | 116688 | 536.73 | 864 | 841 | 215.8 |
| D | 15 | 0 | 75482 | 345.82 | 864 | 841 | 215.8 |
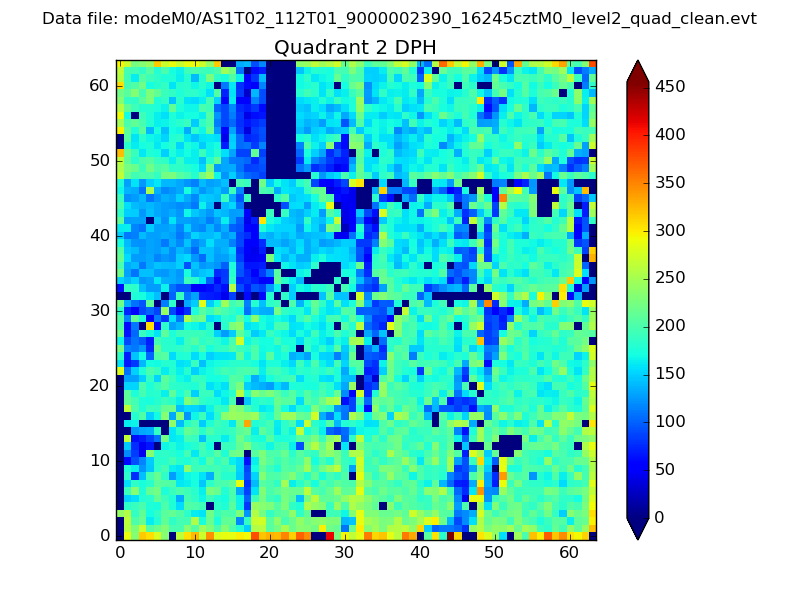
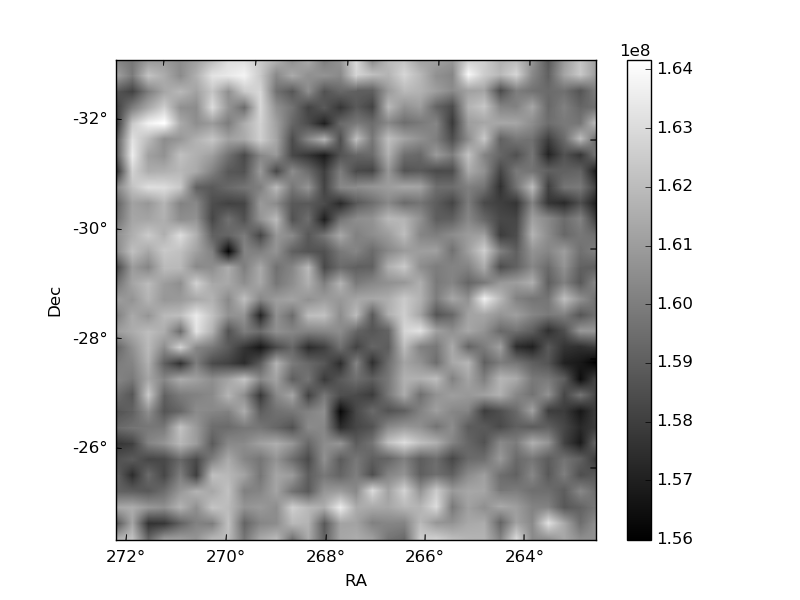
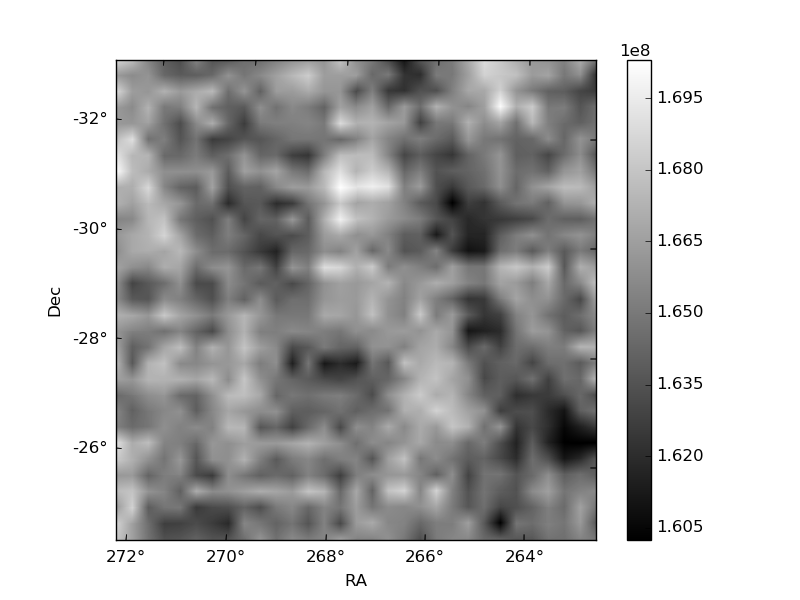
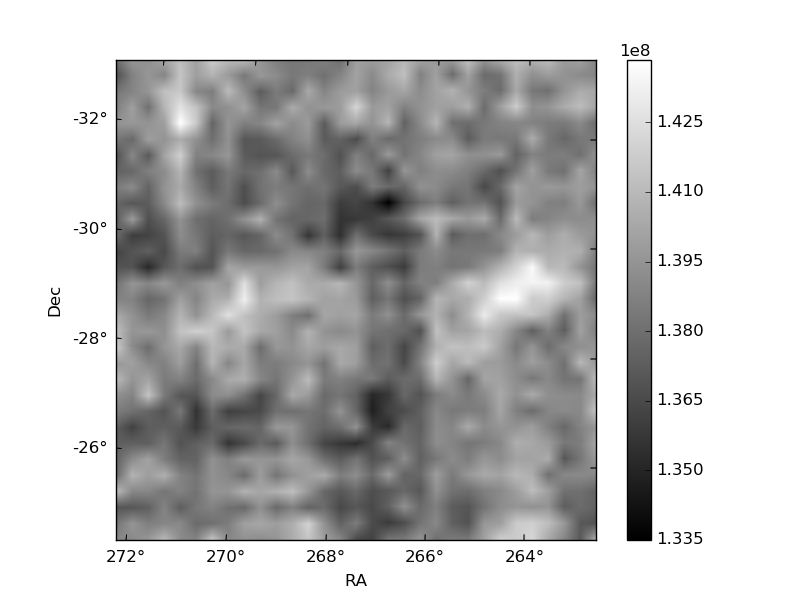
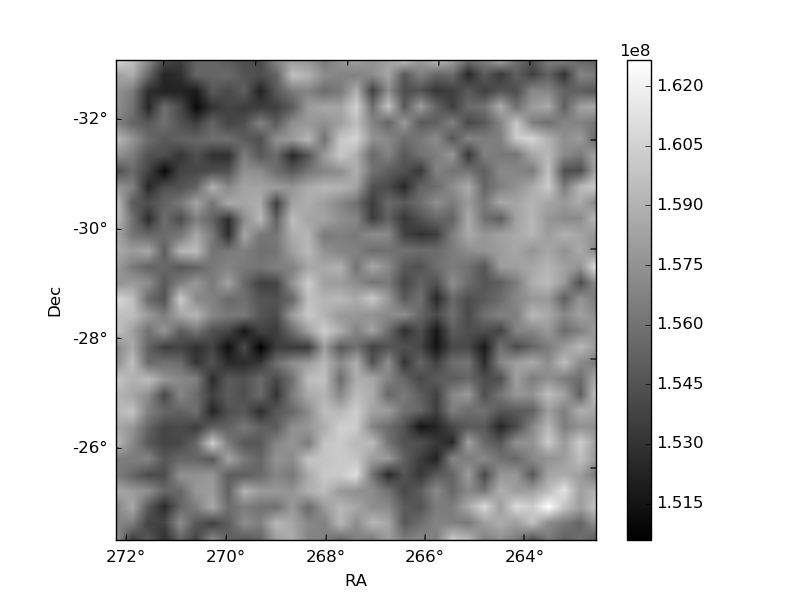
Histogram calculated using DETX and DETY for each event in the final _common_clean file
| Quadrant A | 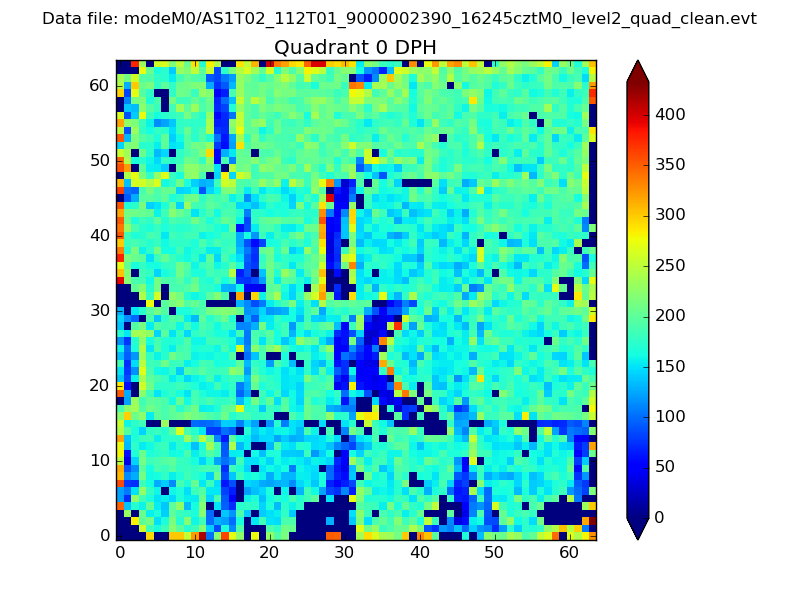 |
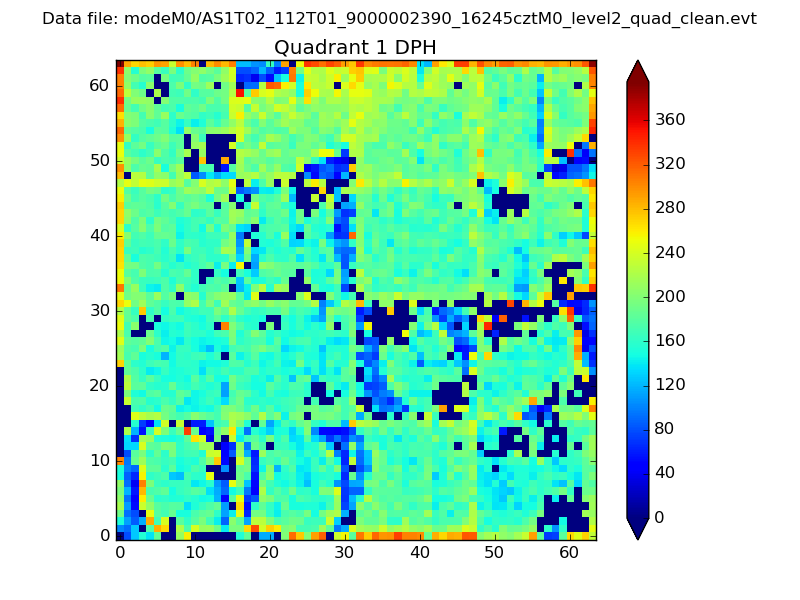 |
Quadrant B |
|---|---|---|---|
| Quadrant D | 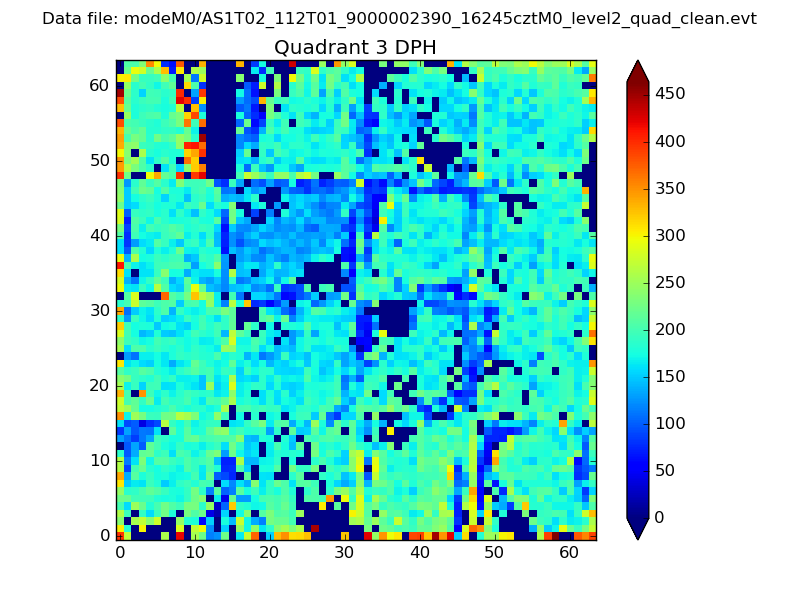 |
 |
Quadrant C |
| Plot type | Count rate plots | Images |
|---|---|---|
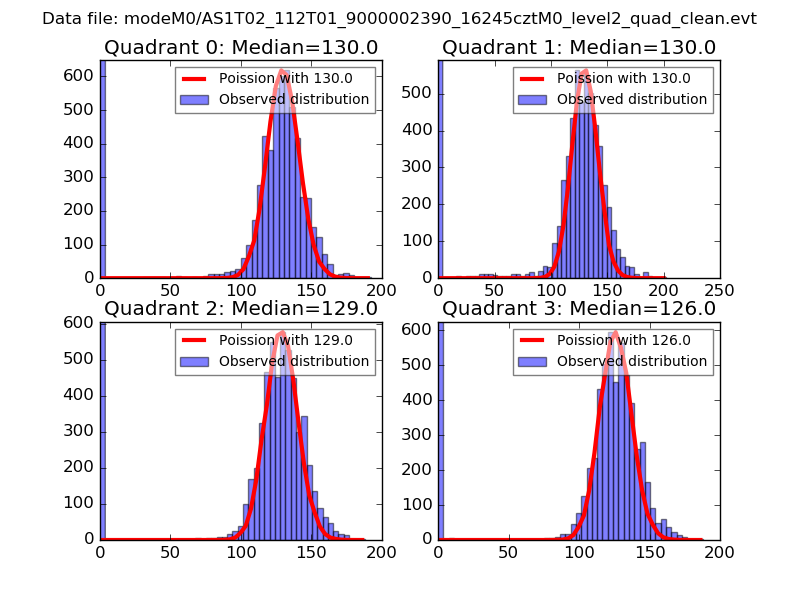
| Comparison with Poisson distribution Blue bars denote a histogram of data divided into 1 sec bins. Red curve is a Poisson curve with rate = median count rate of data. |
 |
 |
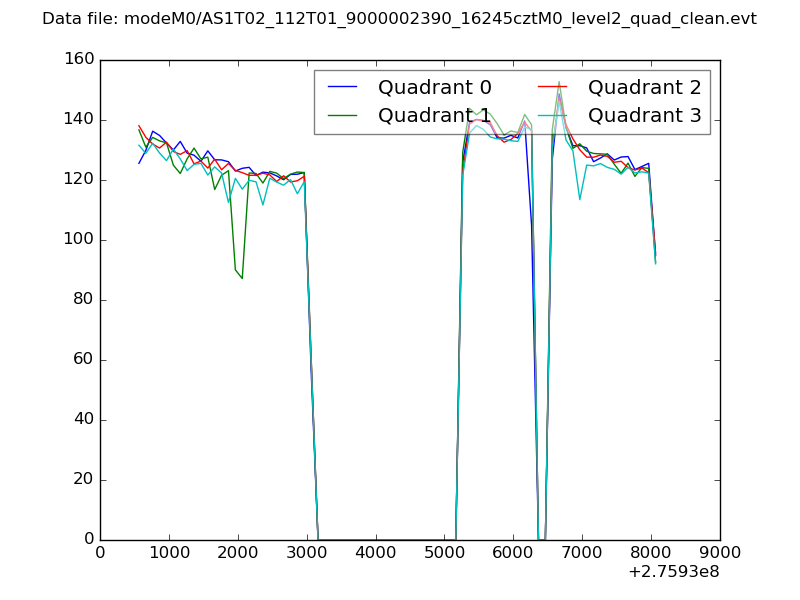
| Quadrant-wise count rates Data is divided into 100 sec bins |
 |
|
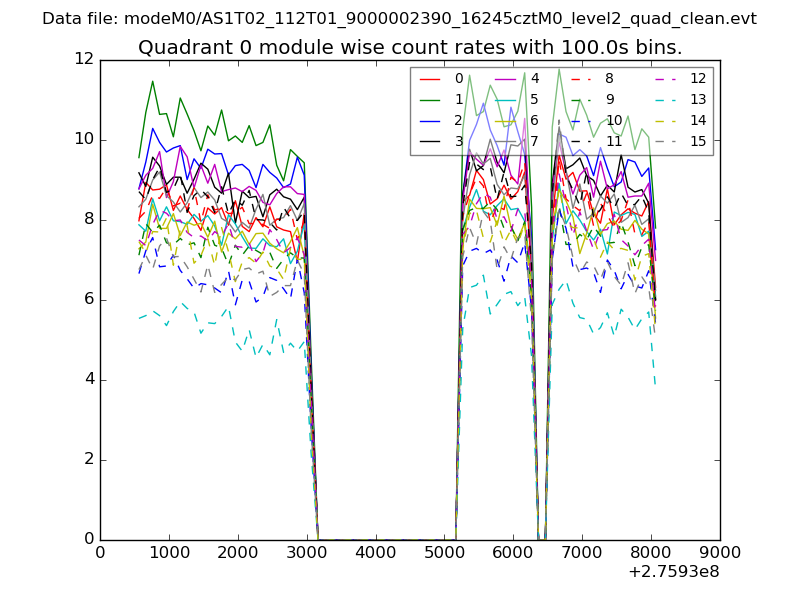
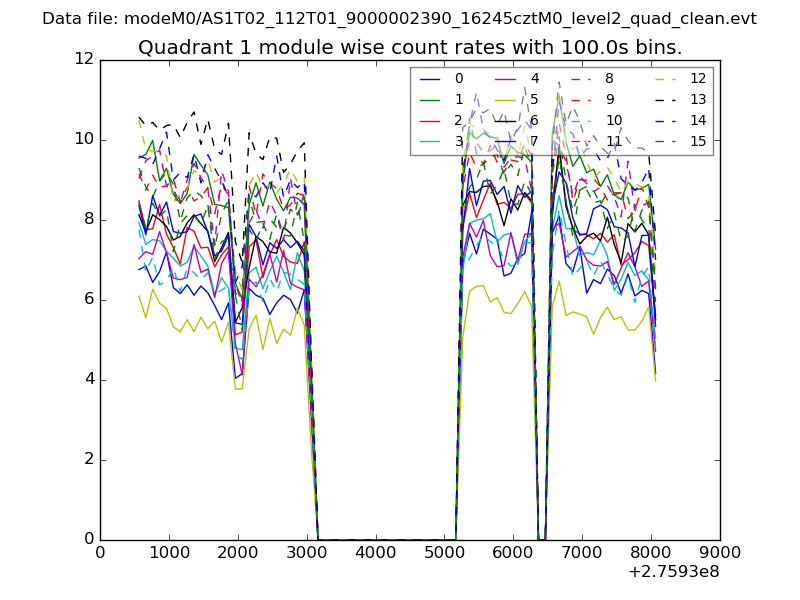
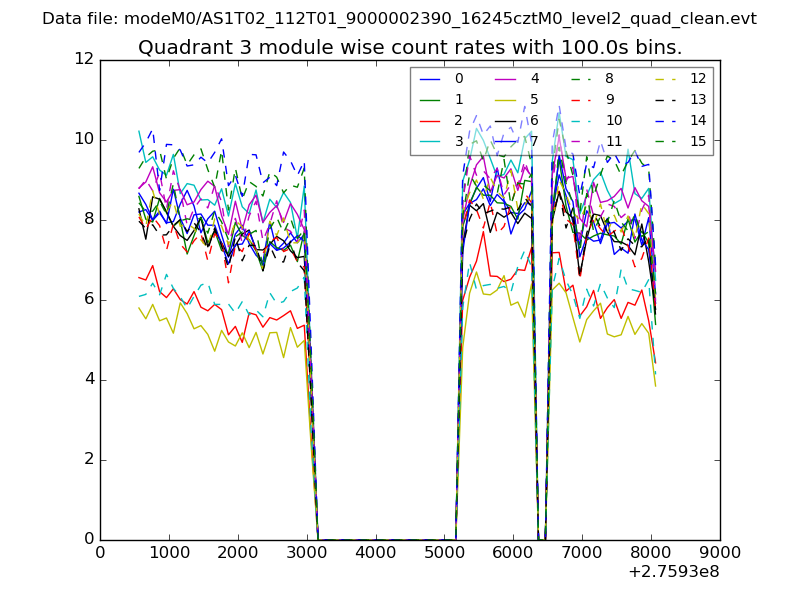
| Module-wise count rates for Quadrant A Data is divided into 100 sec bins |
 |
 |
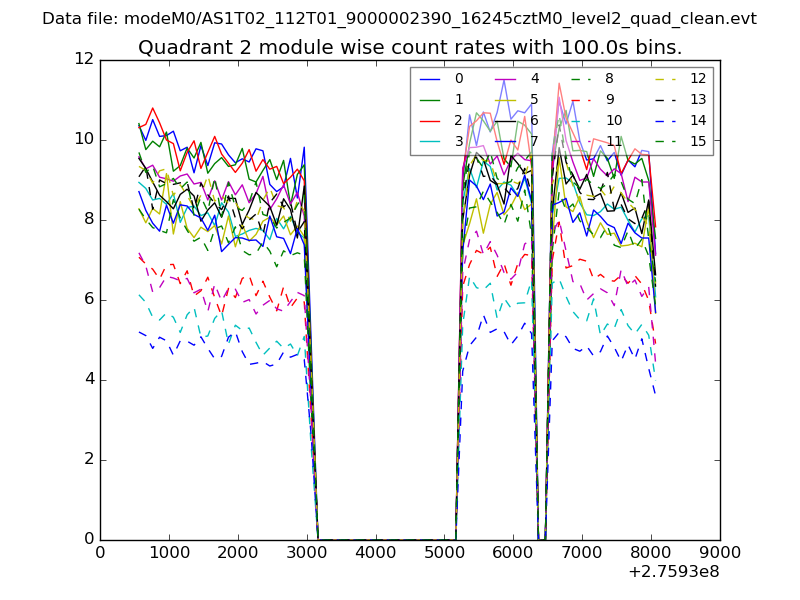
| Module-wise count rates for Quadrant B Data is divided into 100 sec bins |
 |
 |
| Module-wise count rates for Quadrant C Data is divided into 100 sec bins |
 |
 |
| Module-wise count rates for Quadrant D Data is divided into 100 sec bins |
 |
 |
| Parameter | Plot |
|---|---|
| CZT HV Monitor | 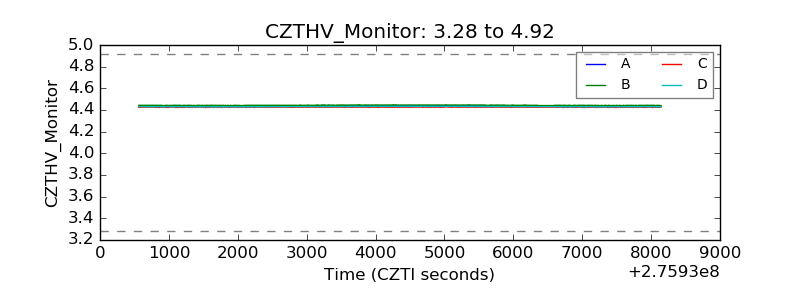 |
| D_VDD | 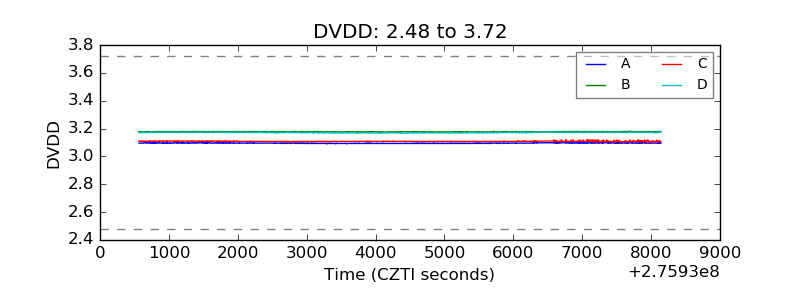 |
| Temperature 1 | 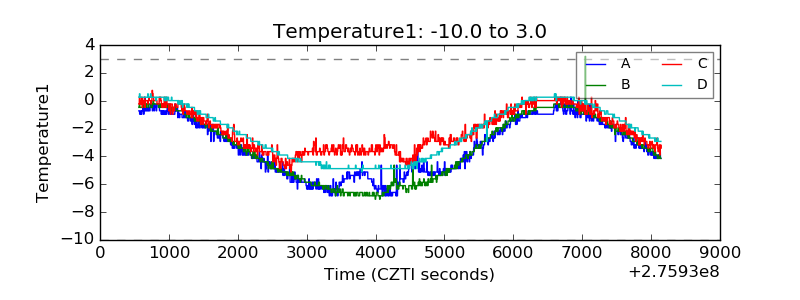 |
| Veto HV Monitor | 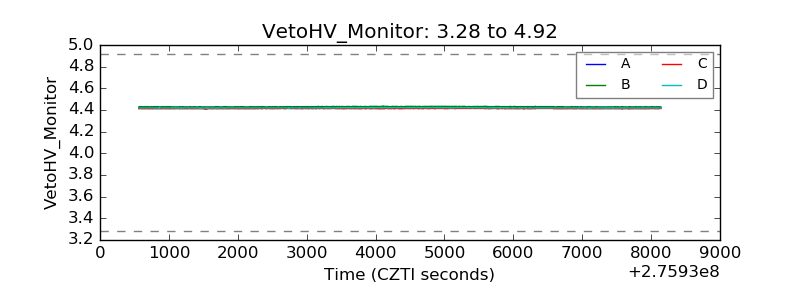 |
| Veto LLD | 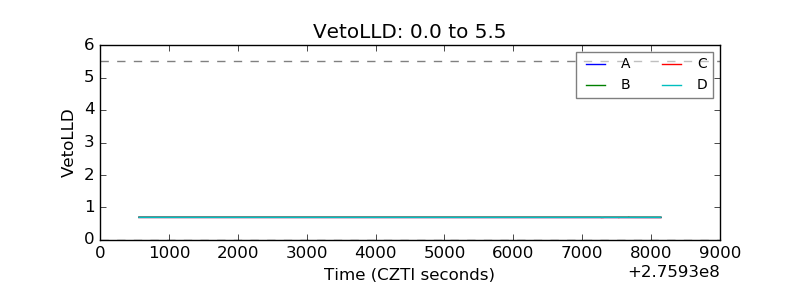 |
| Alpha Counter | 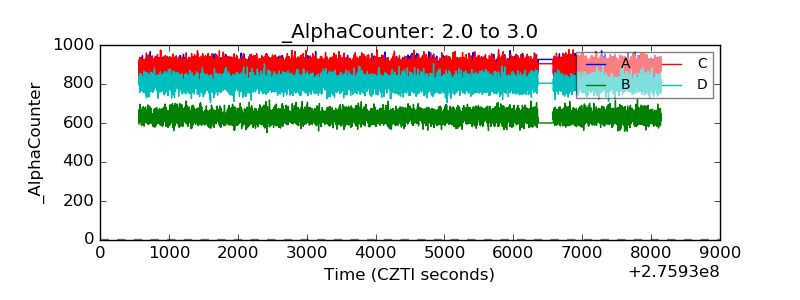 |
| _CPM_Rate | 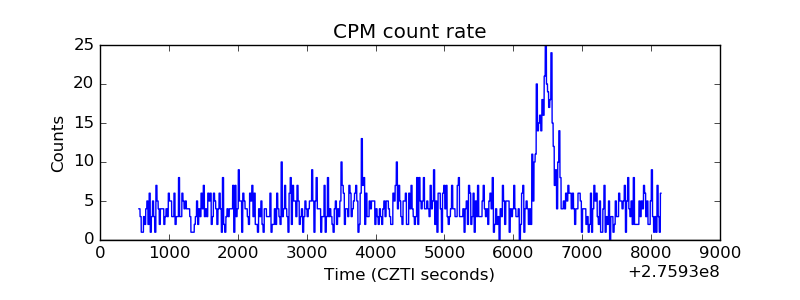 |
| CZT Counter | 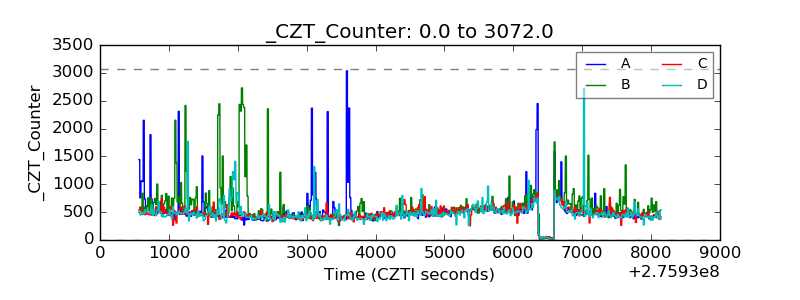 |
| +2.5 Volts monitor |  |
| +5 Volts monitor |  |
| _ROLL_ROT | 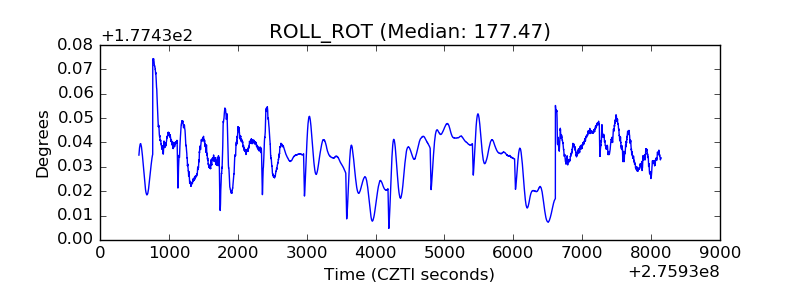 |
| _Roll_DEC | 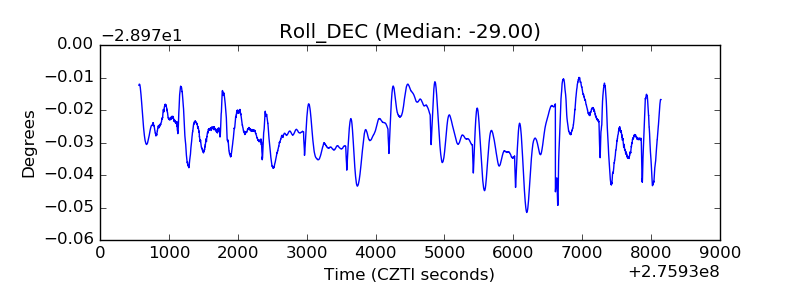 |
| _Roll_RA | 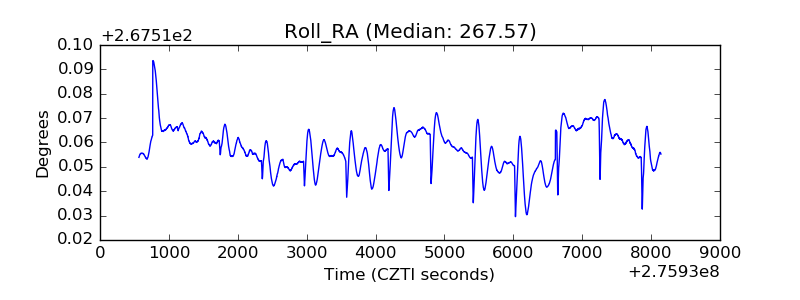 |
| Veto Counter | 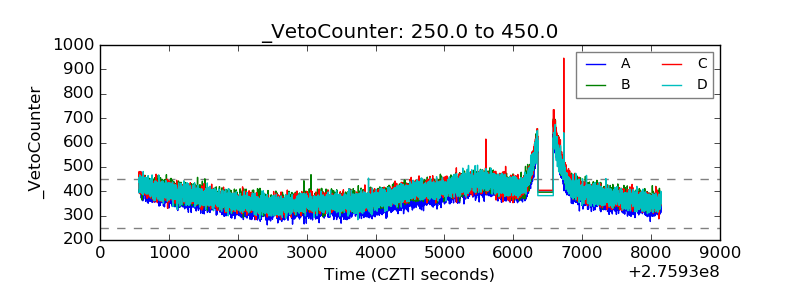 |