| Param | Original file | Final file |
|---|---|---|
| Filename | modeM0/AS1T02_112T01_9000002390_16246cztM0_level2.evt | modeM0/AS1T02_112T01_9000002390_16246cztM0_level2_quad_clean.evt |
| Size (bytes) | 514,860,480 | 103,887,360 |
| Size | 491.0 MB | 99.1 MB |
| Events in quadrant A | 3,449,812 | 667,699 |
| Events in quadrant B | 4,128,345 | 662,636 |
| Events in quadrant C | 3,562,798 | 661,337 |
| Events in quadrant D | 3,954,551 | 644,883 |
| Mode SS | |||
|---|---|---|---|
| Quadrant | BADHDUFLAG | Total packets | Discarded packets |
| A | 0 | 148 | 0 |
| B | 0 | 148 | 0 |
| C | 0 | 148 | 0 |
| D | 0 | 148 | 0 |
| Mode M9 | |||
|---|---|---|---|
| Quadrant | BADHDUFLAG | Total packets | Discarded packets |
| A | 0 | 4 | 0 |
| B | 0 | 4 | 0 |
| C | 0 | 4 | 0 |
| D | 0 | 4 | 0 |
| Mode M0 | |||
|---|---|---|---|
| Quadrant | BADHDUFLAG | Total packets | Discarded packets |
| A | 0 | 15152 | 2 |
| B | 0 | 17123 | 1 |
| C | 0 | 15133 | 1 |
| D | 0 | 16745 | 1 |
| Quadrant | Total seconds | Saturated seconds | Saturation percentage |
|---|---|---|---|
| A | 7323 | 26 | 0.355046% |
| B | 7323 | 147 | 2.007374% |
| C | 7323 | 41 | 0.559880% |
| D | 7323 | 98 | 1.338249% |
Noise dominated data is calculated using 1-second bins in cleaned event files. If a bin has >2000 counts, and if more than 50% of those come from <1% of pixels, then it is considered to be noise-dominated and hence unusable.
| Quadrant | # 1 sec bins | Bins with >0 counts | Bins with >2000 counts | High rate bins dominated by noise | Noise dominated (total time) | Noise dominated (detector-on time) | Marked lightcurve |
|---|---|---|---|---|---|---|---|
| A | 7749 | 7325 | 9 | 9 | 0.12% | 0.12% | 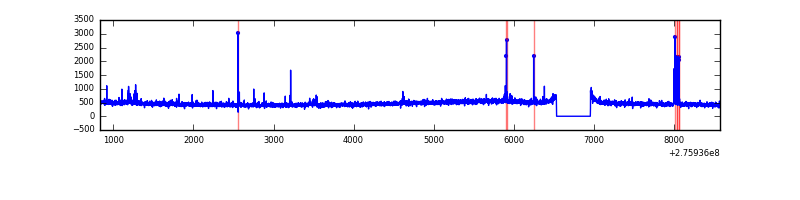 |
| B | 7749 | 7325 | 64 | 64 | 0.83% | 0.87% | 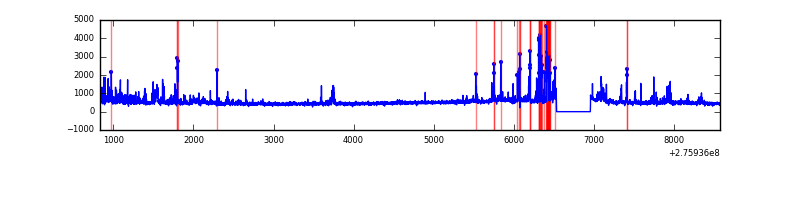 |
| C | 7749 | 7325 | 0 | 0 | 0.00% | 0.00% | 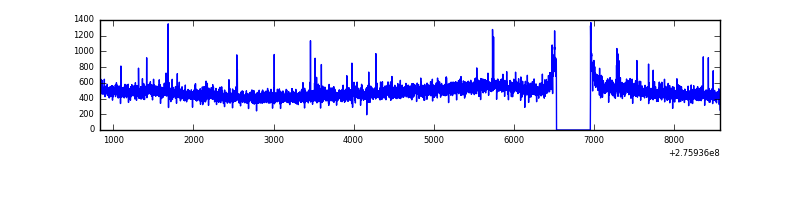 |
| D | 7749 | 7325 | 91 | 91 | 1.17% | 1.24% | 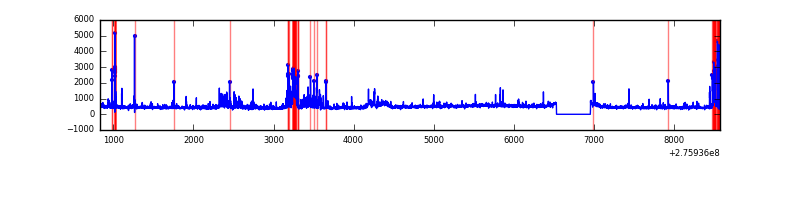 |
Top three noisy pixels from each quadrant. If the there are fewer than three noisy pixels in the level2.evt file, extra rows are filled as -1
| Pixel properties | Quadrant properties | ||||||
|---|---|---|---|---|---|---|---|
| Quadrant | DetID | PixID | Counts | Sigma | Mean | Median | Sigma |
| A | 13 | 248 | 46281 | 255.31 | 870 | 853 | 177.9 |
| A | 15 | 174 | 45334 | 249.98 | 870 | 853 | 177.9 |
| A | 3 | 1 | 8072 | 40.57 | 870 | 853 | 177.9 |
| B | 10 | 16 | 243061 | 1473.11 | 864 | 844 | 164.4 |
| B | 7 | 220 | 232518 | 1408.99 | 864 | 844 | 164.4 |
| B | 4 | 216 | 41084 | 244.73 | 864 | 844 | 164.4 |
| C | 3 | 233 | 176821 | 898.43 | 830 | 835 | 195.9 |
| C | 14 | 238 | 126409 | 641.07 | 830 | 835 | 195.9 |
| C | 0 | 207 | 13905 | 66.72 | 830 | 835 | 195.9 |
| D | 1 | 52 | 536173 | 2616.05 | 838 | 814 | 204.6 |
| D | 15 | 0 | 139420 | 677.3 | 838 | 814 | 204.6 |
| D | 2 | 234 | 32826 | 156.43 | 838 | 814 | 204.6 |
Histogram calculated using DETX and DETY for each event in the final _common_clean file
| Quadrant A | 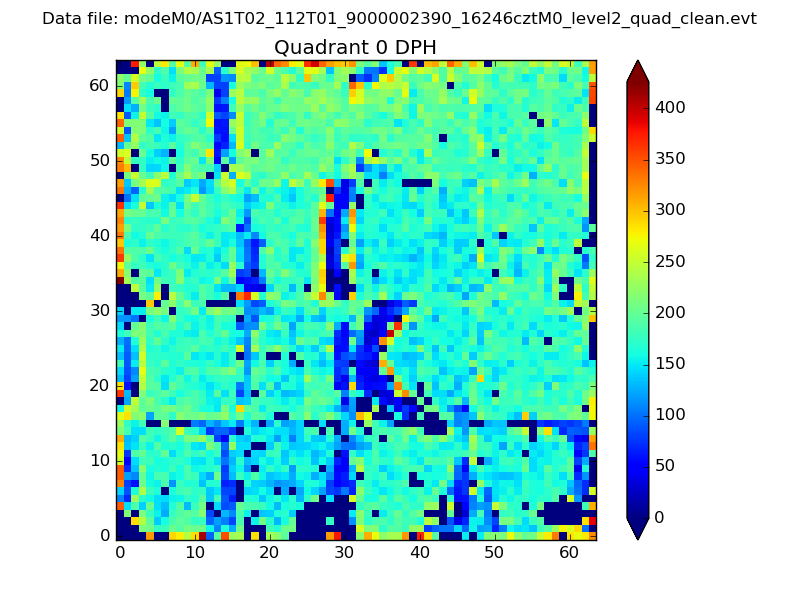 |
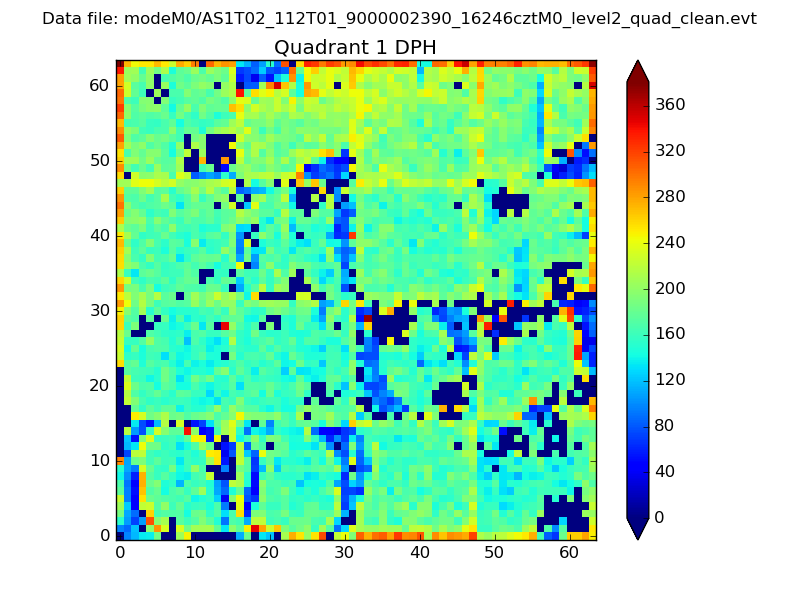 |
Quadrant B |
|---|---|---|---|
| Quadrant D | 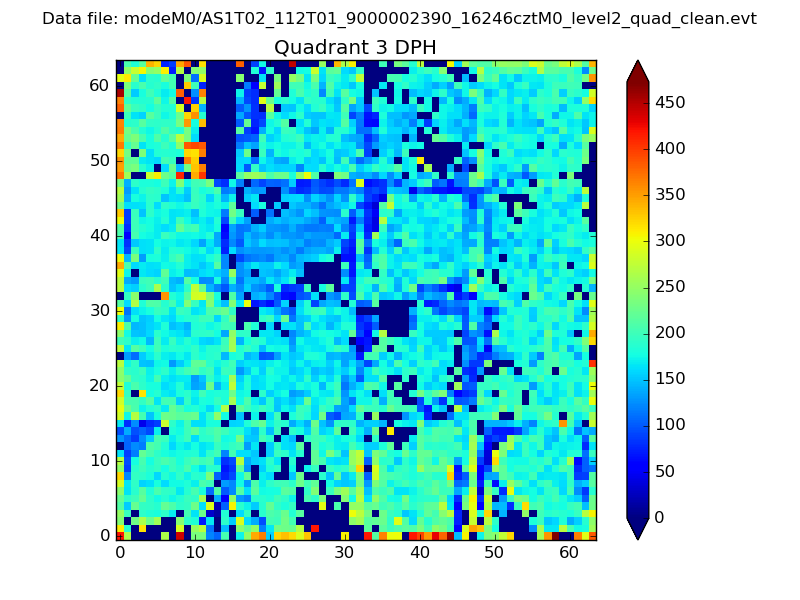 |
 |
Quadrant C |
| Plot type | Count rate plots | Images |
|---|---|---|
| Comparison with Poisson distribution Blue bars denote a histogram of data divided into 1 sec bins. Red curve is a Poisson curve with rate = median count rate of data. |
 |
 |
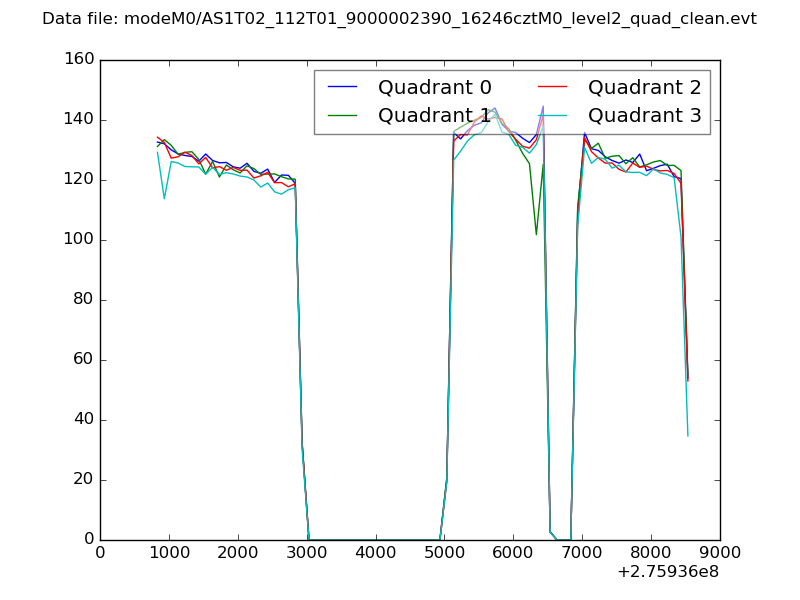
| Quadrant-wise count rates Data is divided into 100 sec bins |
 |
|
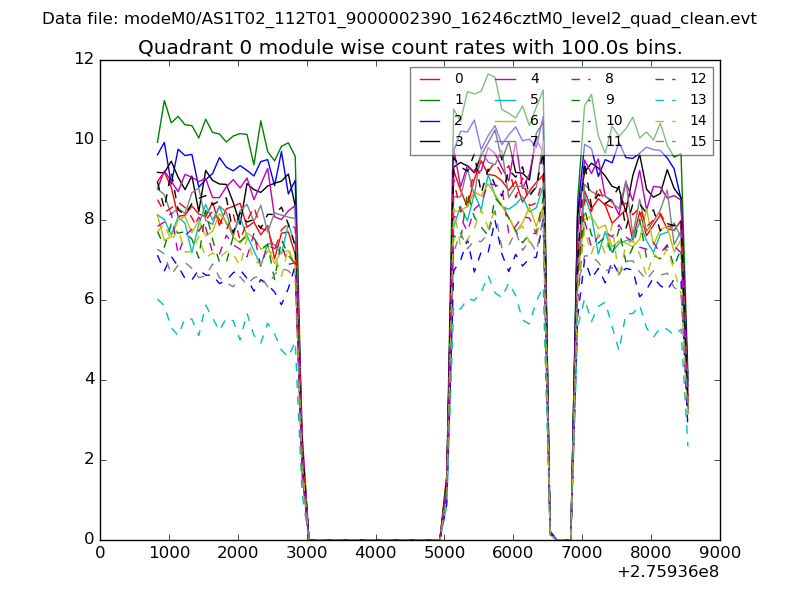
| Module-wise count rates for Quadrant A Data is divided into 100 sec bins |
 |
 |
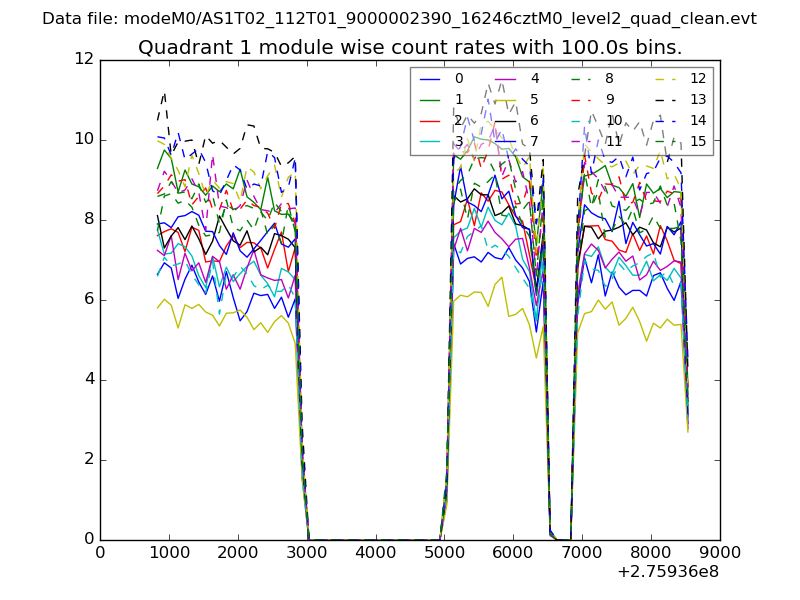
| Module-wise count rates for Quadrant B Data is divided into 100 sec bins |
 |
 |
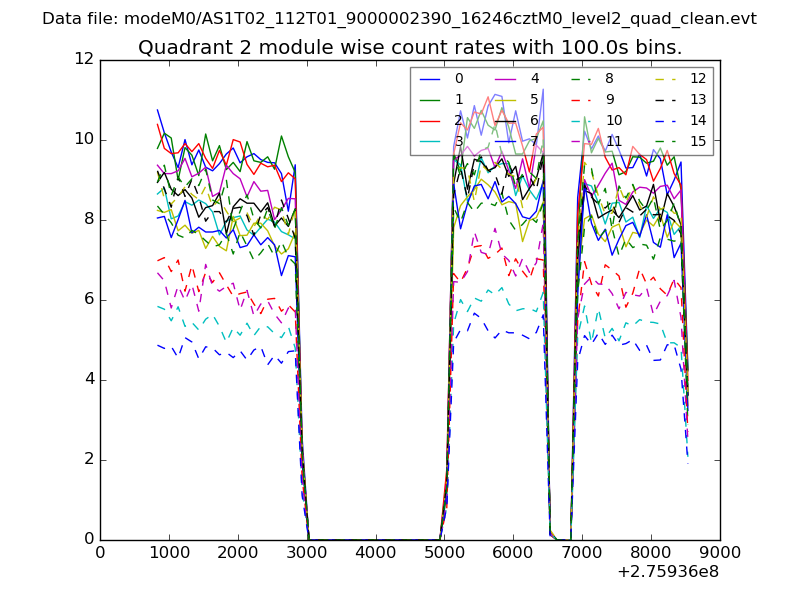
| Module-wise count rates for Quadrant C Data is divided into 100 sec bins |
 |
 |
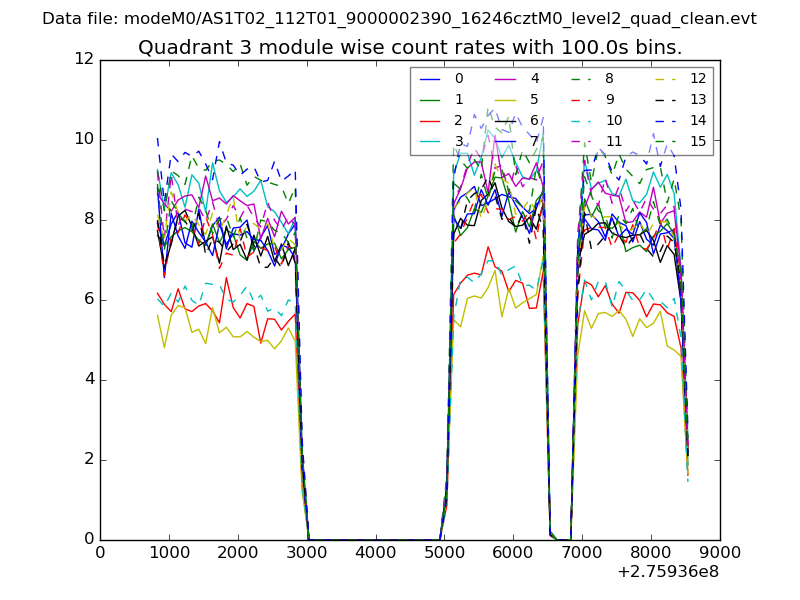
| Module-wise count rates for Quadrant D Data is divided into 100 sec bins |
 |
 |
| Parameter | Plot |
|---|---|
| CZT HV Monitor | 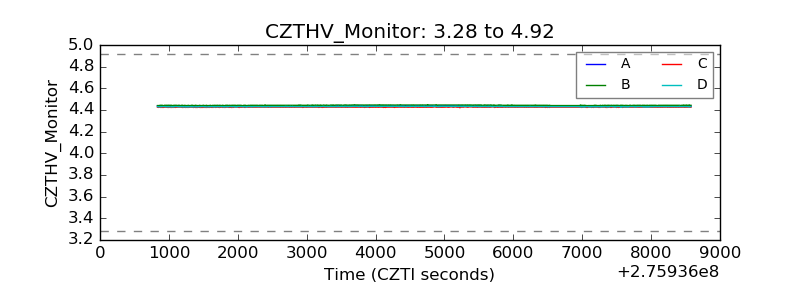 |
| D_VDD | 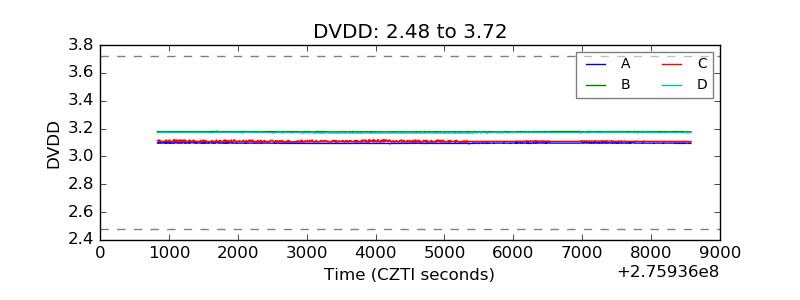 |
| Temperature 1 | 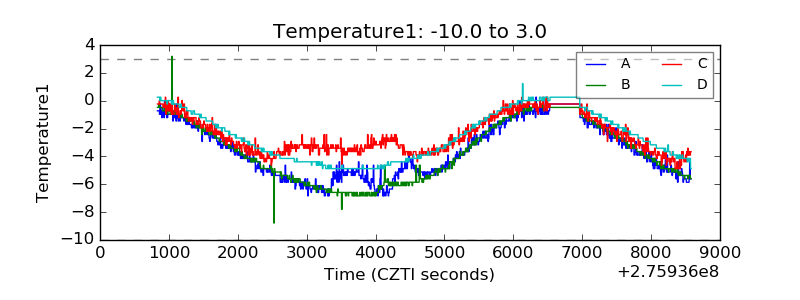 |
| Veto HV Monitor | 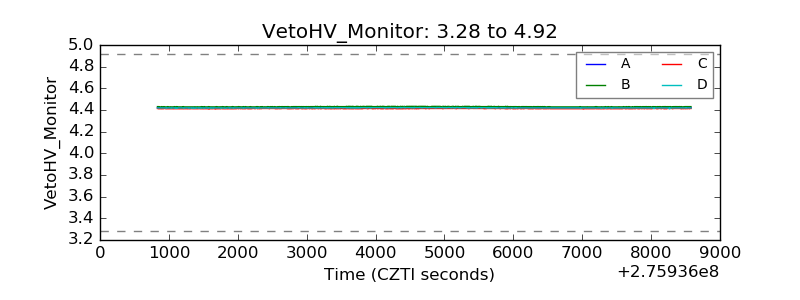 |
| Veto LLD | 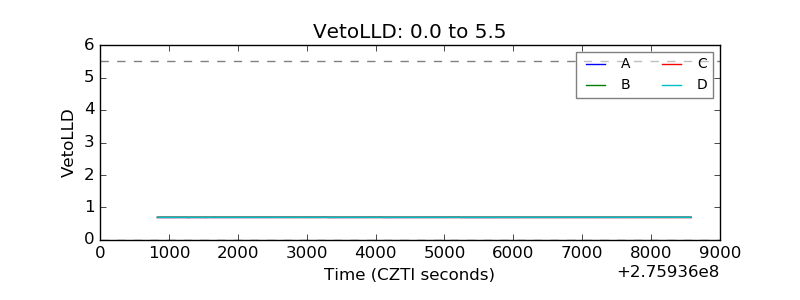 |
| Alpha Counter | 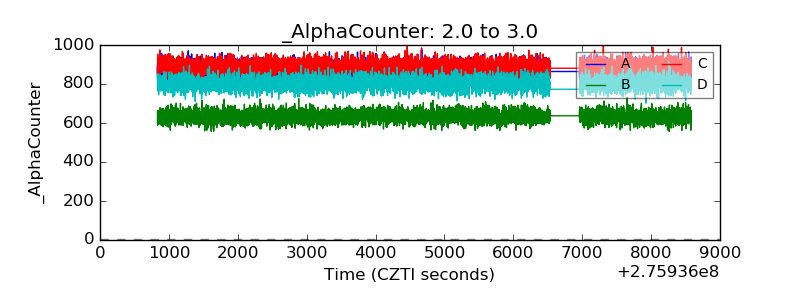 |
| _CPM_Rate | 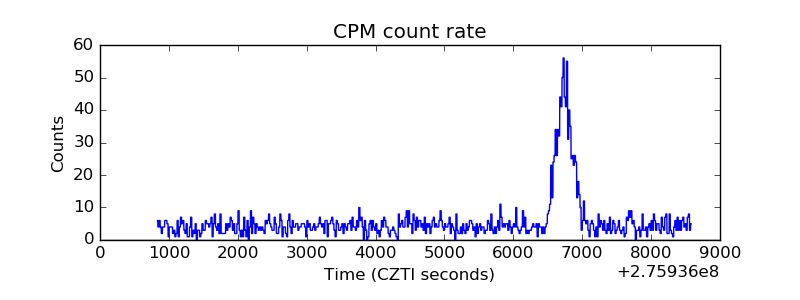 |
| CZT Counter | 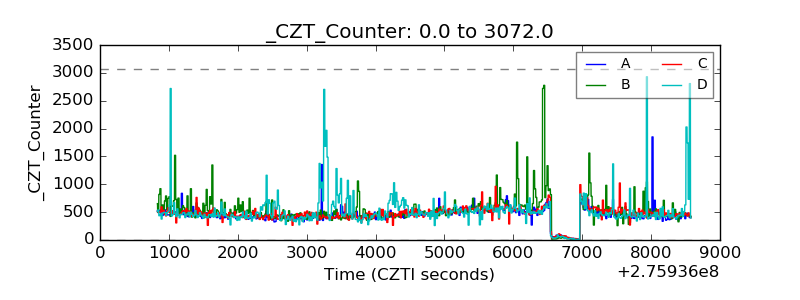 |
| +2.5 Volts monitor |  |
| +5 Volts monitor | 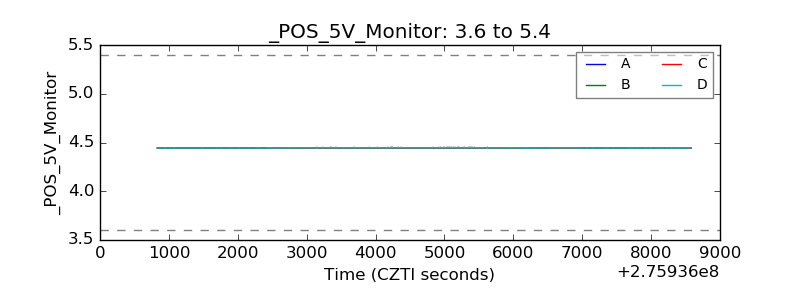 |
| _ROLL_ROT | 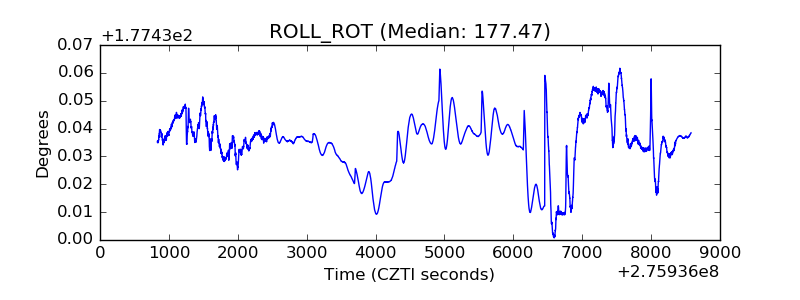 |
| _Roll_DEC |  |
| _Roll_RA | 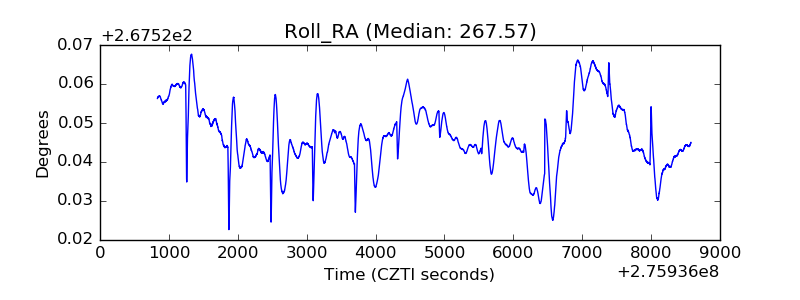 |
| Veto Counter | 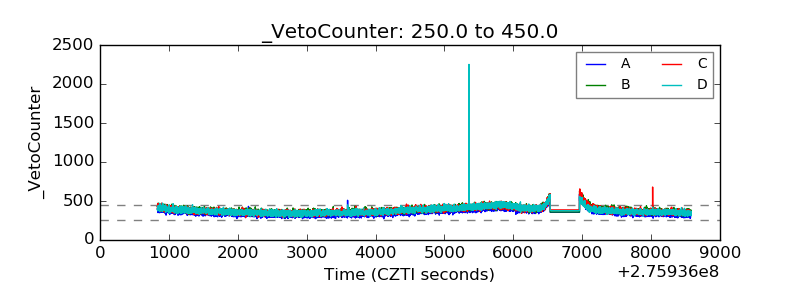 |