| Param | Original file | Final file |
|---|---|---|
| Filename | modeM0/AS1T02_112T01_9000002390_16248cztM0_level2.evt | modeM0/AS1T02_112T01_9000002390_16248cztM0_level2_quad_clean.evt |
| Size (bytes) | 965,727,360 | 165,833,280 |
| Size | 921.0 MB | 158.2 MB |
| Events in quadrant A | 7,504,682 | 1,039,623 |
| Events in quadrant B | 7,321,921 | 1,044,917 |
| Events in quadrant C | 6,304,440 | 1,039,379 |
| Events in quadrant D | 7,244,750 | 1,008,196 |
| Mode SS | |||
|---|---|---|---|
| Quadrant | BADHDUFLAG | Total packets | Discarded packets |
| A | 0 | 262 | 0 |
| B | 0 | 262 | 0 |
| C | 0 | 262 | 0 |
| D | 0 | 262 | 0 |
| Mode M9 | |||
|---|---|---|---|
| Quadrant | BADHDUFLAG | Total packets | Discarded packets |
| A | 0 | 19 | 0 |
| B | 0 | 19 | 0 |
| C | 0 | 19 | 0 |
| D | 0 | 19 | 0 |
| Mode M0 | |||
|---|---|---|---|
| Quadrant | BADHDUFLAG | Total packets | Discarded packets |
| A | 0 | 30991 | 4 |
| B | 0 | 30271 | 3 |
| C | 0 | 26959 | 3 |
| D | 0 | 30213 | 3 |
| Quadrant | Total seconds | Saturated seconds | Saturation percentage |
|---|---|---|---|
| A | 12887 | 512 | 3.972996% |
| B | 12887 | 284 | 2.203771% |
| C | 12887 | 83 | 0.644060% |
| D | 12887 | 288 | 2.234810% |
Noise dominated data is calculated using 1-second bins in cleaned event files. If a bin has >2000 counts, and if more than 50% of those come from <1% of pixels, then it is considered to be noise-dominated and hence unusable.
| Quadrant | # 1 sec bins | Bins with >0 counts | Bins with >2000 counts | High rate bins dominated by noise | Noise dominated (total time) | Noise dominated (detector-on time) | Marked lightcurve |
|---|---|---|---|---|---|---|---|
| A | 14703 | 12891 | 350 | 350 | 2.38% | 2.72% | 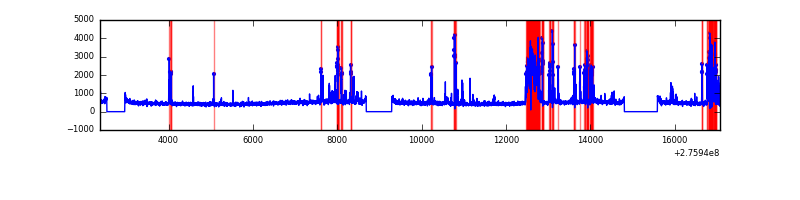 |
| B | 14703 | 12891 | 134 | 134 | 0.91% | 1.04% | 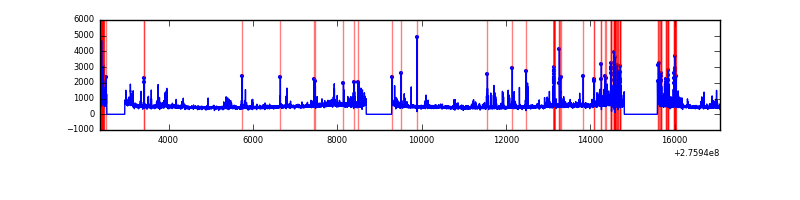 |
| C | 14703 | 12891 | 3 | 3 | 0.02% | 0.02% | 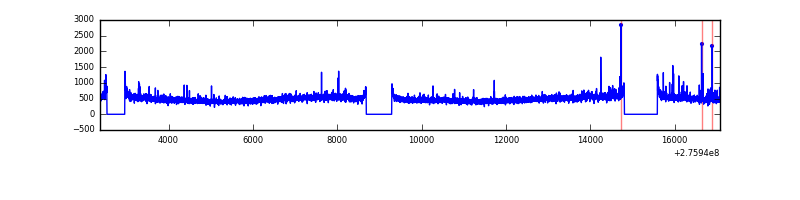 |
| D | 14703 | 12891 | 243 | 243 | 1.65% | 1.89% | 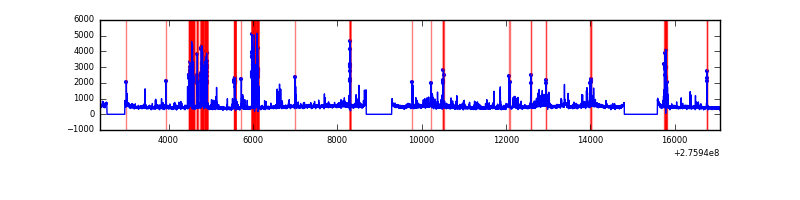 |
Top three noisy pixels from each quadrant. If the there are fewer than three noisy pixels in the level2.evt file, extra rows are filled as -1
| Pixel properties | Quadrant properties | ||||||
|---|---|---|---|---|---|---|---|
| Quadrant | DetID | PixID | Counts | Sigma | Mean | Median | Sigma |
| A | 15 | 174 | 1576653 | 5169.45 | 1512 | 1483 | 304.7 |
| A | 9 | 143 | 53839 | 171.82 | 1512 | 1483 | 304.7 |
| A | 13 | 248 | 51362 | 163.69 | 1512 | 1483 | 304.7 |
| B | 7 | 220 | 325366 | 1112.94 | 1529 | 1489 | 291.0 |
| B | 3 | 64 | 304837 | 1042.4 | 1529 | 1489 | 291.0 |
| B | 10 | 16 | 262375 | 896.48 | 1529 | 1489 | 291.0 |
| C | 3 | 233 | 256389 | 740.25 | 1470 | 1481 | 344.4 |
| C | 14 | 238 | 226098 | 652.29 | 1470 | 1481 | 344.4 |
| C | 0 | 207 | 84748 | 241.81 | 1470 | 1481 | 344.4 |
| D | 1 | 52 | 1344391 | 3730.17 | 1476 | 1434 | 360.0 |
| D | 13 | 112 | 133620 | 367.16 | 1476 | 1434 | 360.0 |
| D | 10 | 70 | 115488 | 316.79 | 1476 | 1434 | 360.0 |
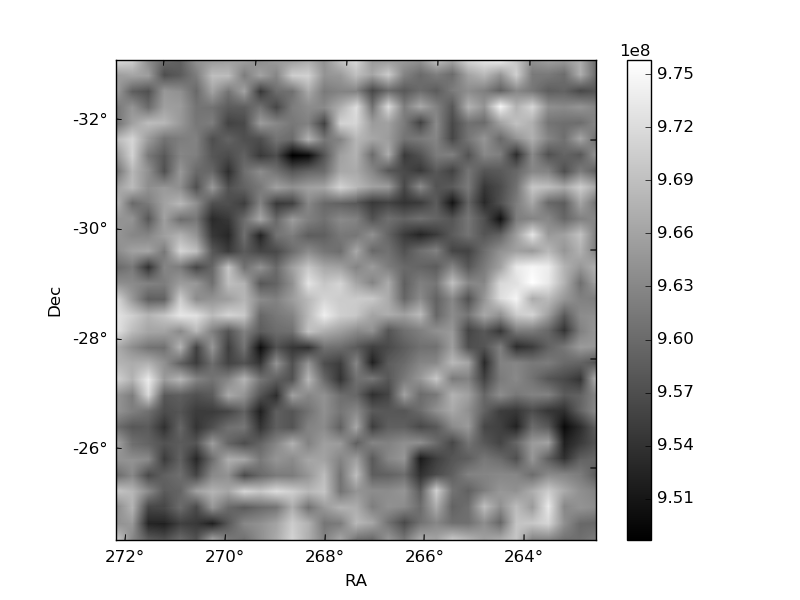
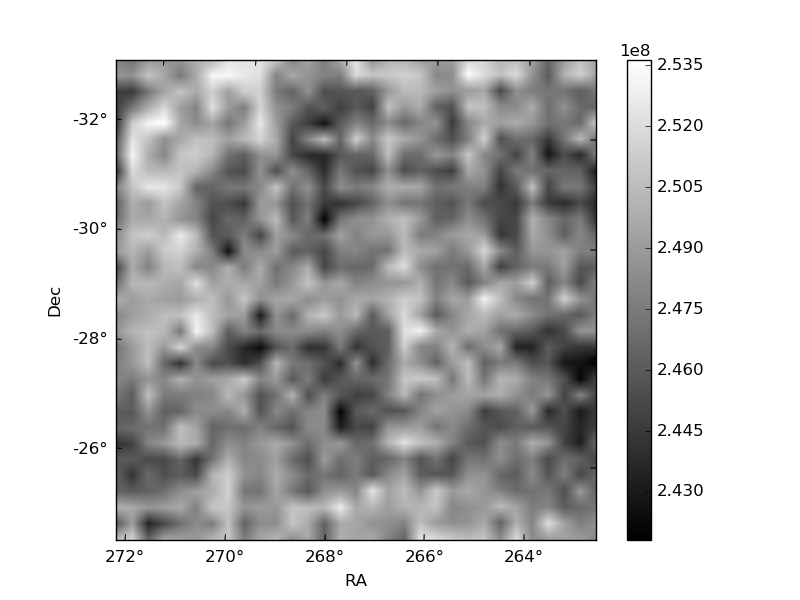
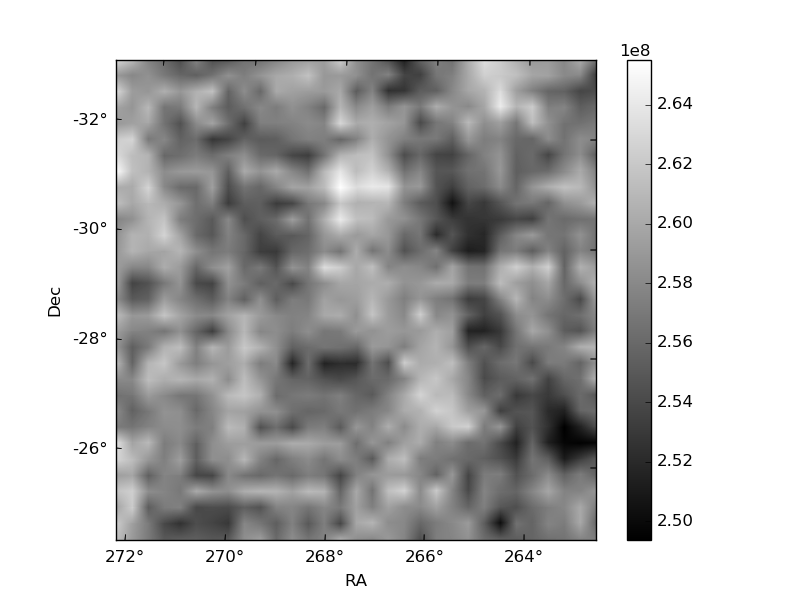
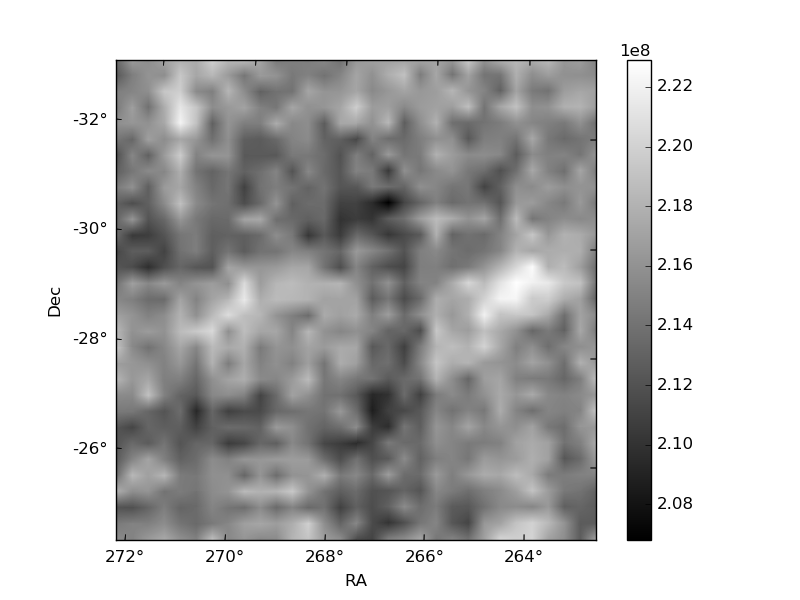
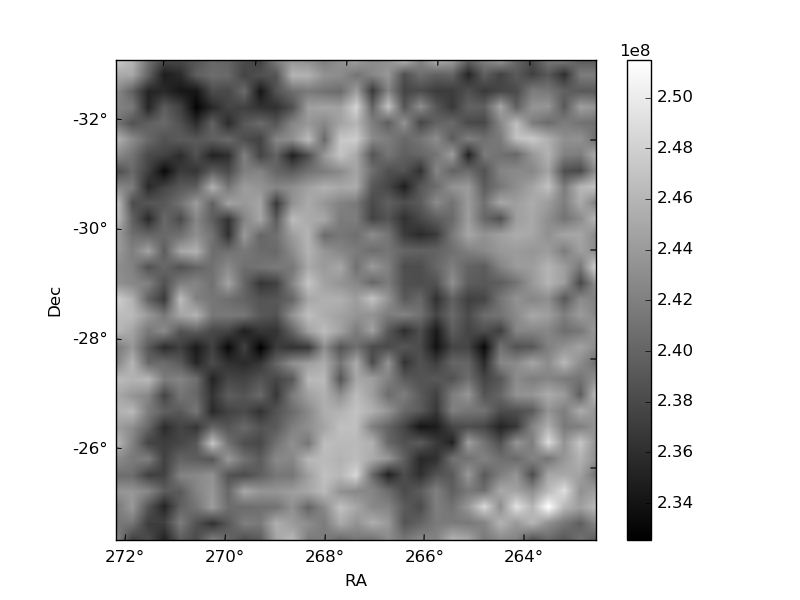
Histogram calculated using DETX and DETY for each event in the final _common_clean file
| Quadrant A | 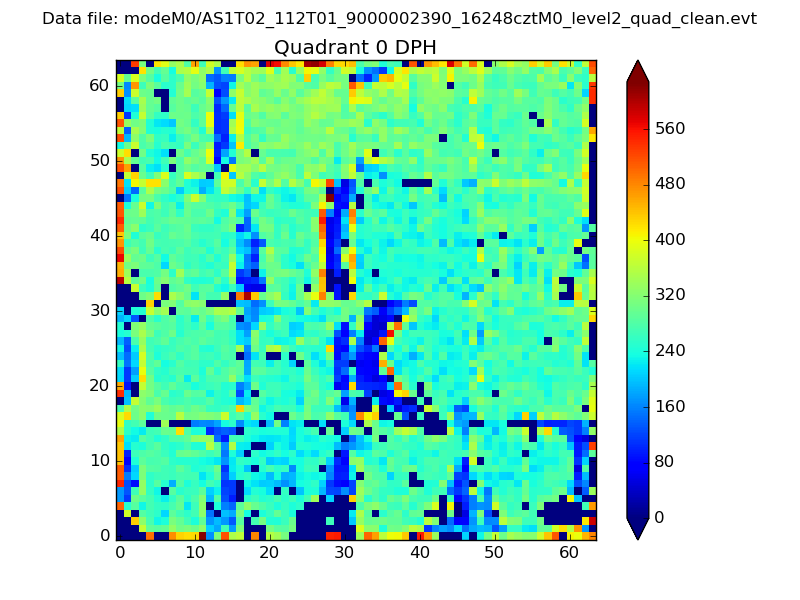 |
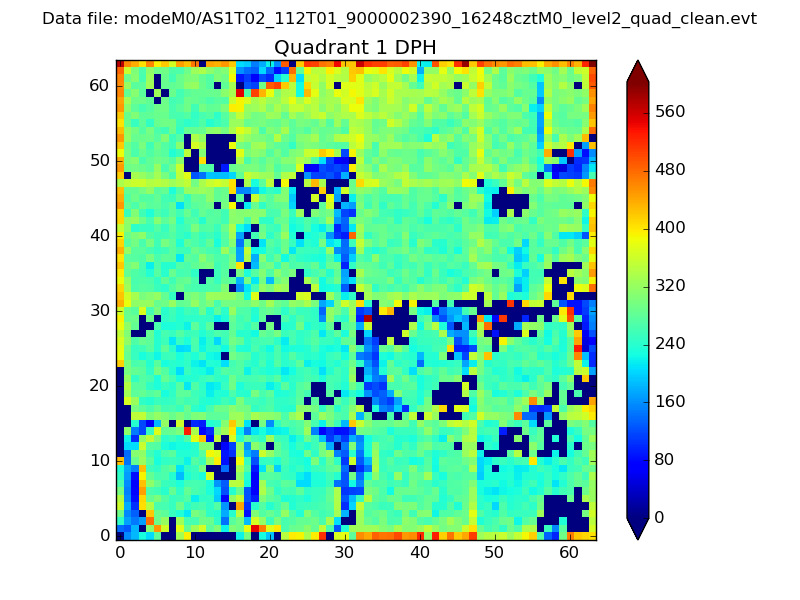 |
Quadrant B |
|---|---|---|---|
| Quadrant D |  |
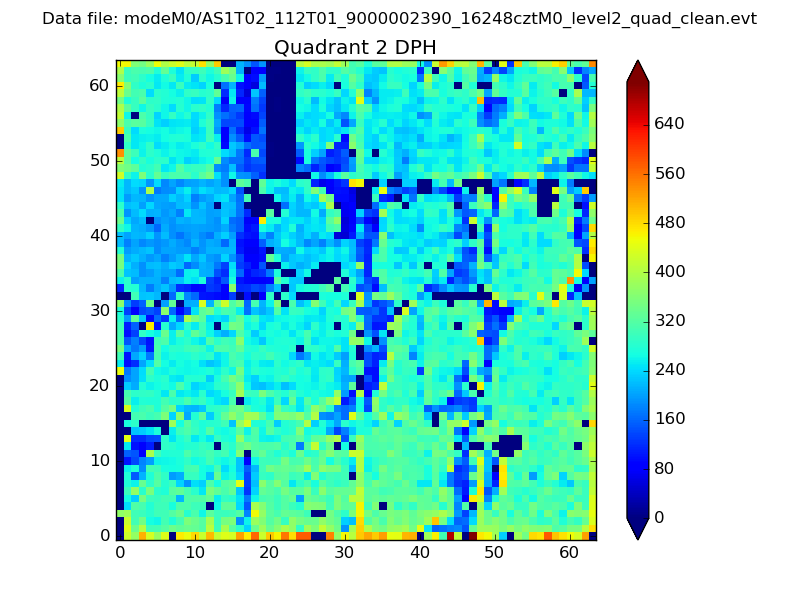 |
Quadrant C |
| Plot type | Count rate plots | Images |
|---|---|---|
| Comparison with Poisson distribution Blue bars denote a histogram of data divided into 1 sec bins. Red curve is a Poisson curve with rate = median count rate of data. |
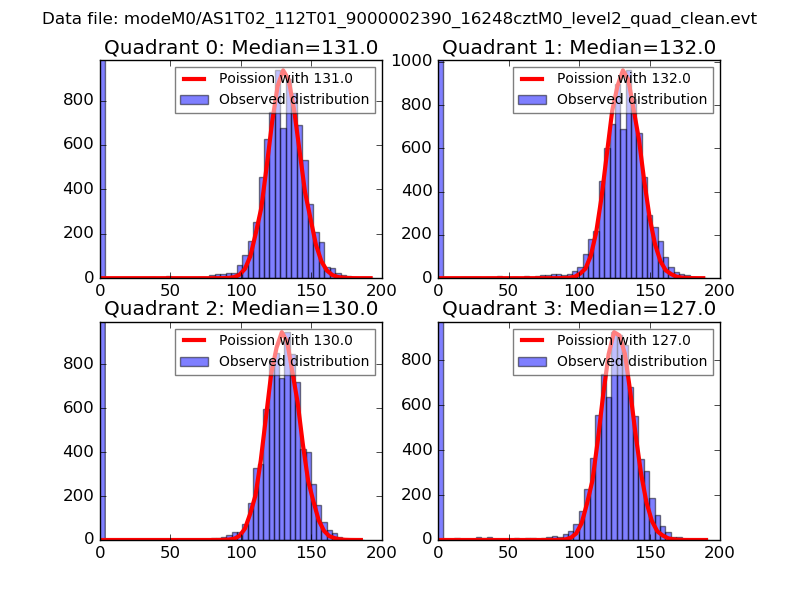 |
 |
| Quadrant-wise count rates Data is divided into 100 sec bins |
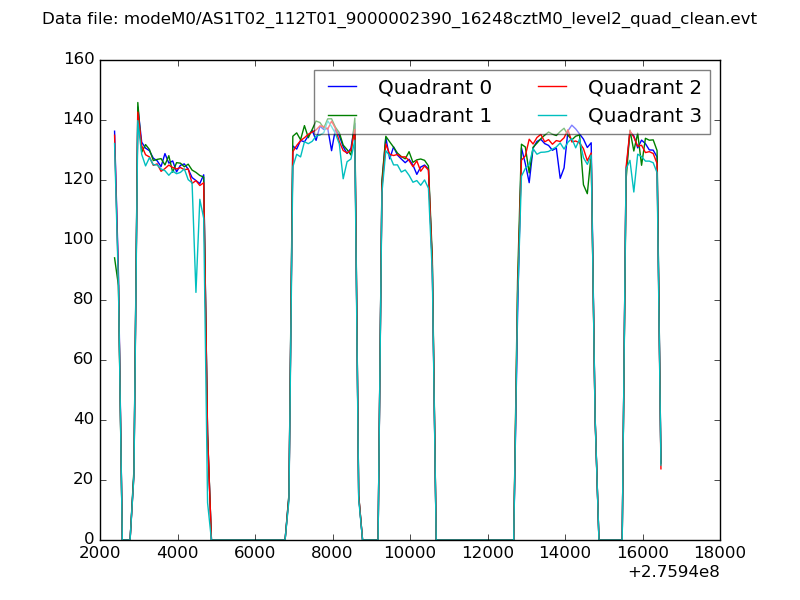 |
|
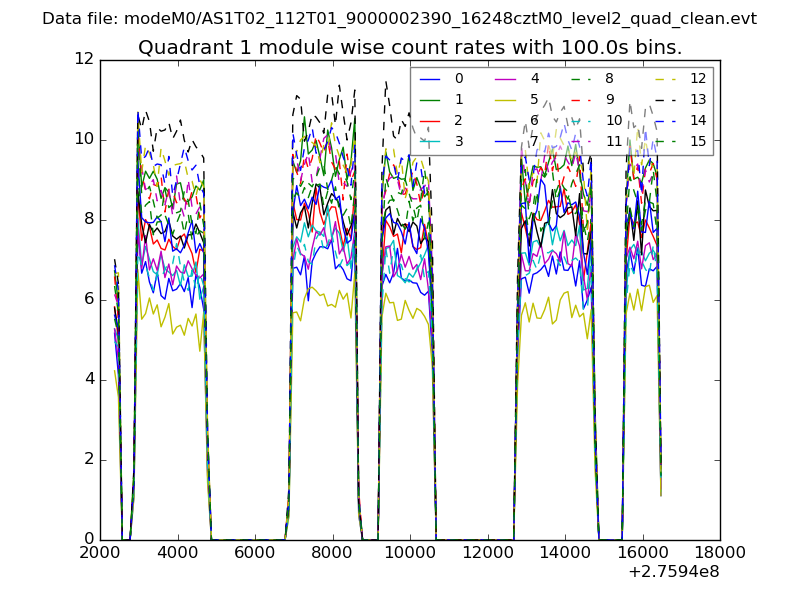
| Module-wise count rates for Quadrant A Data is divided into 100 sec bins |
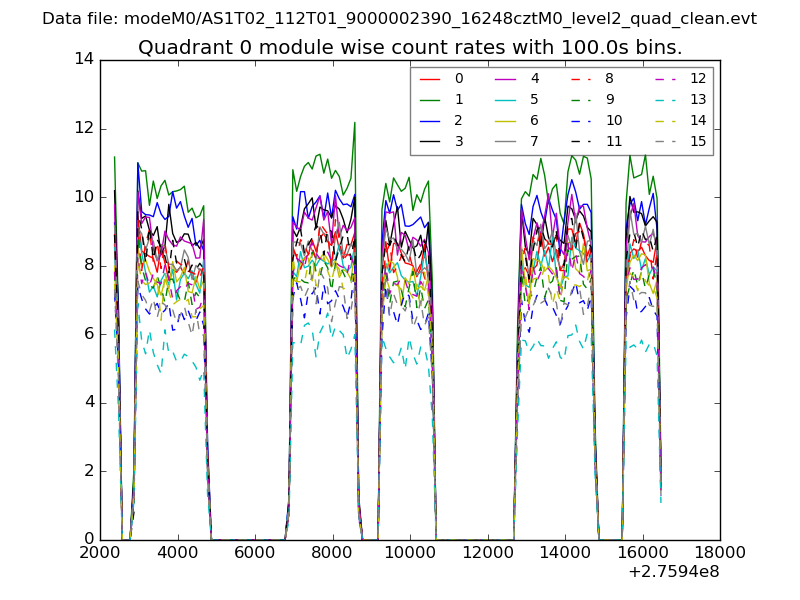 |
 |
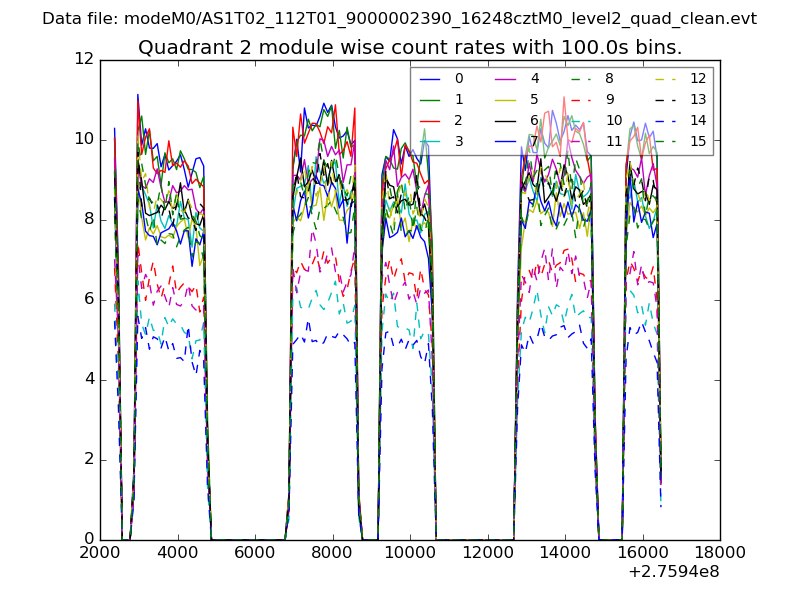
| Module-wise count rates for Quadrant B Data is divided into 100 sec bins |
 |
 |
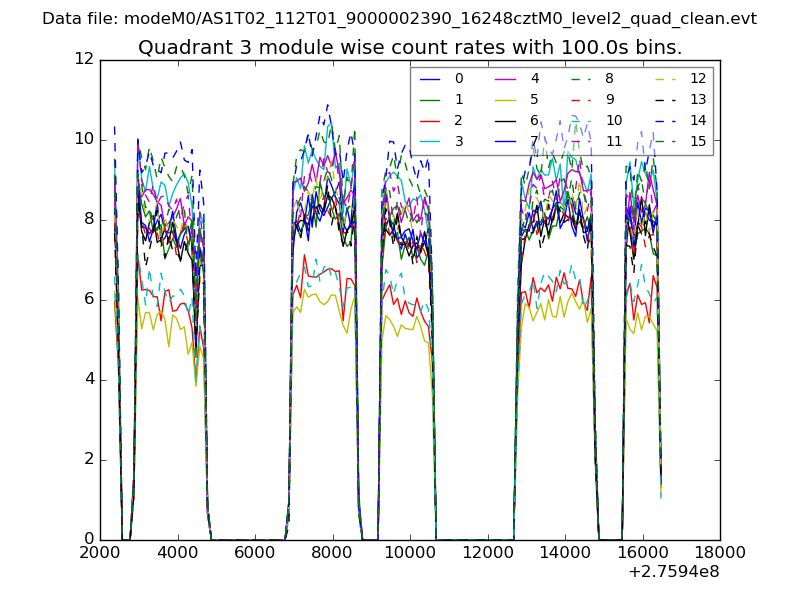
| Module-wise count rates for Quadrant C Data is divided into 100 sec bins |
 |
 |
| Module-wise count rates for Quadrant D Data is divided into 100 sec bins |
 |
 |
| Parameter | Plot |
|---|---|
| CZT HV Monitor | 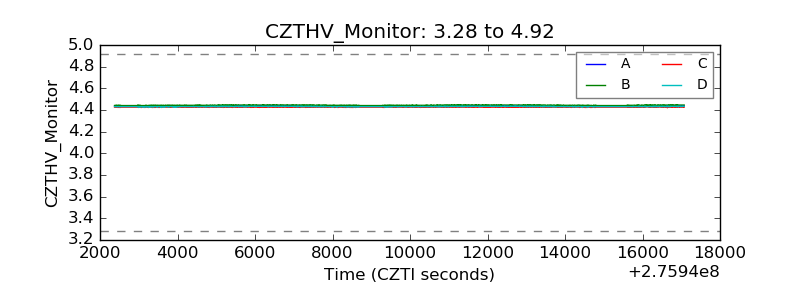 |
| D_VDD | 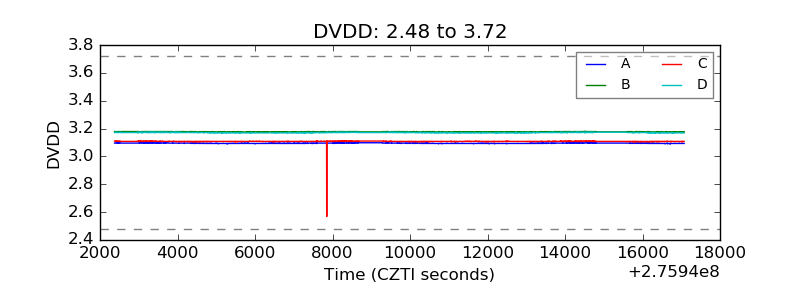 |
| Temperature 1 | 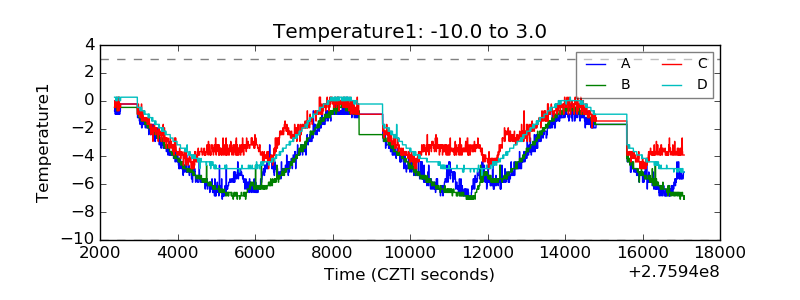 |
| Veto HV Monitor | 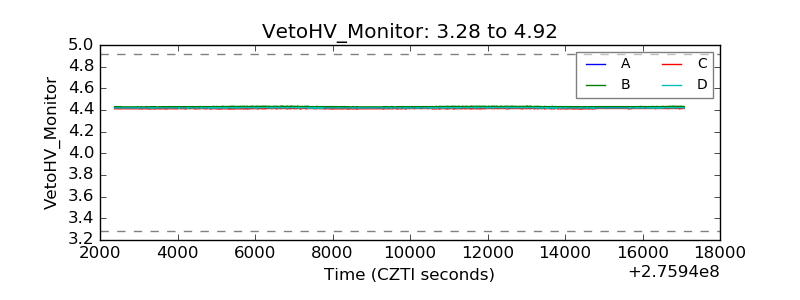 |
| Veto LLD | 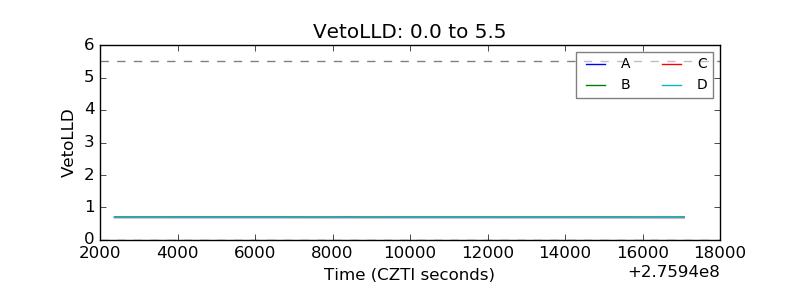 |
| Alpha Counter | 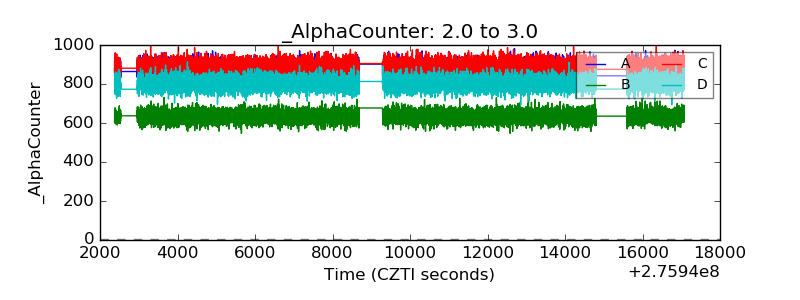 |
| _CPM_Rate | 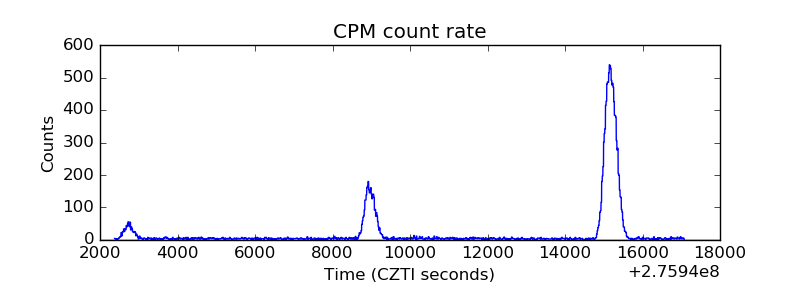 |
| CZT Counter | 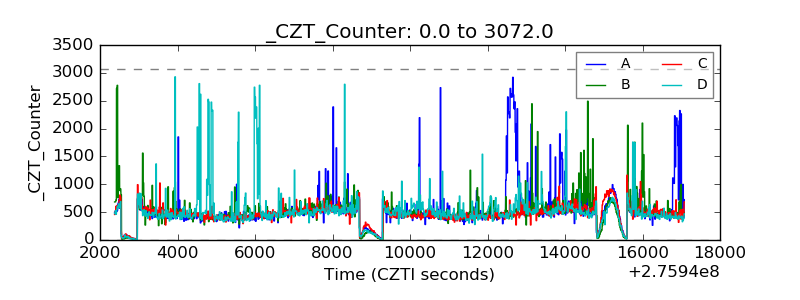 |
| +2.5 Volts monitor |  |
| +5 Volts monitor |  |
| _ROLL_ROT | 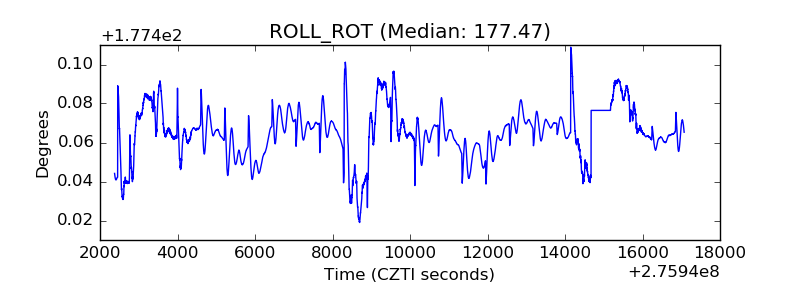 |
| _Roll_DEC | 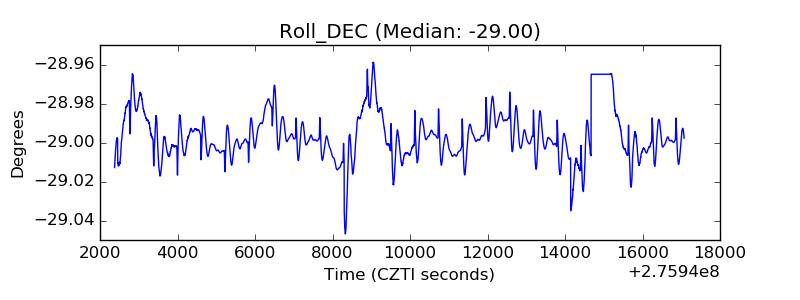 |
| _Roll_RA | 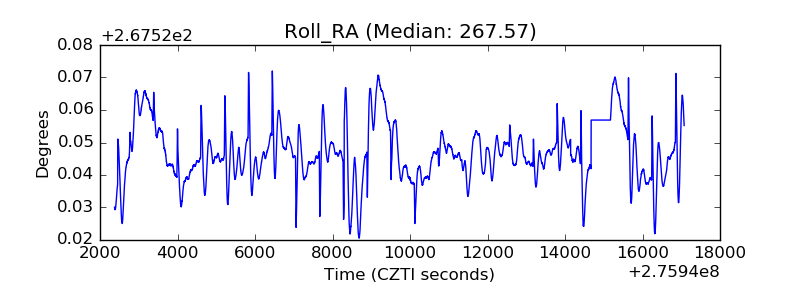 |
| Veto Counter | 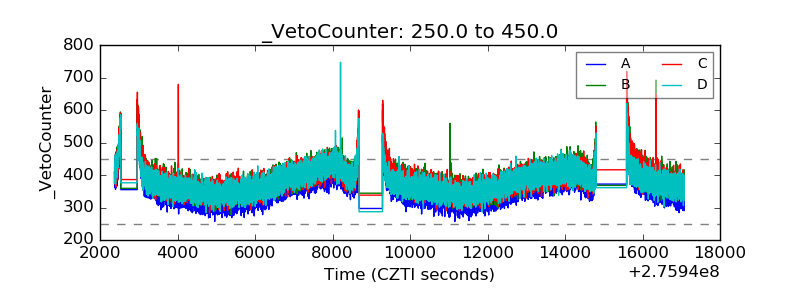 |