| Param | Original file | Final file |
|---|---|---|
| Filename | modeM0/AS1T02_112T01_9000002390_16249cztM0_level2.evt | modeM0/AS1T02_112T01_9000002390_16249cztM0_level2_quad_clean.evt |
| Size (bytes) | 550,952,640 | 78,963,840 |
| Size | 525.4 MB | 75.3 MB |
| Events in quadrant A | 5,026,026 | 457,775 |
| Events in quadrant B | 4,215,601 | 490,000 |
| Events in quadrant C | 3,714,999 | 485,598 |
| Events in quadrant D | 3,260,345 | 475,984 |
| Mode SS | |||
|---|---|---|---|
| Quadrant | BADHDUFLAG | Total packets | Discarded packets |
| A | 0 | 138 | 0 |
| B | 0 | 138 | 0 |
| C | 0 | 138 | 0 |
| D | 0 | 138 | 0 |
| Mode M9 | |||
|---|---|---|---|
| Quadrant | BADHDUFLAG | Total packets | Discarded packets |
| A | 0 | 10 | 0 |
| B | 0 | 10 | 0 |
| C | 0 | 10 | 0 |
| D | 0 | 11 | 0 |
| Mode M0 | |||
|---|---|---|---|
| Quadrant | BADHDUFLAG | Total packets | Discarded packets |
| A | 0 | 19513 | 3 |
| B | 0 | 16970 | 2 |
| C | 0 | 15414 | 2 |
| D | 0 | 14539 | 2 |
| Quadrant | Total seconds | Saturated seconds | Saturation percentage |
|---|---|---|---|
| A | 6919 | 594 | 8.585056% |
| B | 6919 | 191 | 2.760515% |
| C | 6919 | 69 | 0.997254% |
| D | 6919 | 45 | 0.650383% |
Noise dominated data is calculated using 1-second bins in cleaned event files. If a bin has >2000 counts, and if more than 50% of those come from <1% of pixels, then it is considered to be noise-dominated and hence unusable.
| Quadrant | # 1 sec bins | Bins with >0 counts | Bins with >2000 counts | High rate bins dominated by noise | Noise dominated (total time) | Noise dominated (detector-on time) | Marked lightcurve |
|---|---|---|---|---|---|---|---|
| A | 7860 | 6921 | 410 | 410 | 5.22% | 5.92% | 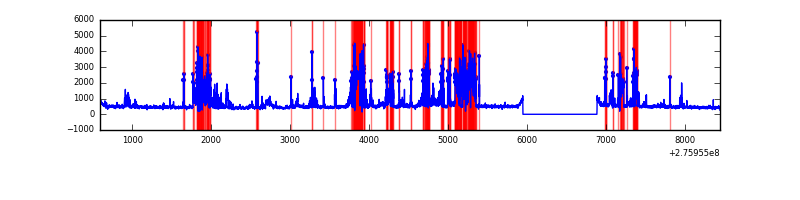 |
| B | 7860 | 6921 | 88 | 88 | 1.12% | 1.27% |  |
| C | 7860 | 6921 | 11 | 11 | 0.14% | 0.16% | 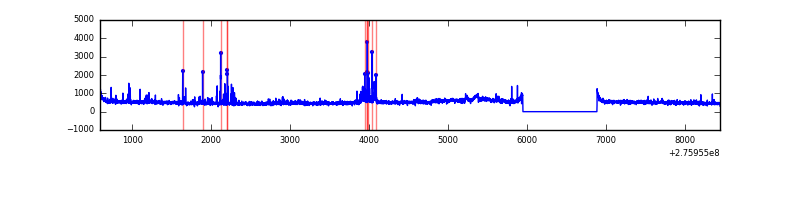 |
| D | 7860 | 6921 | 29 | 29 | 0.37% | 0.42% | 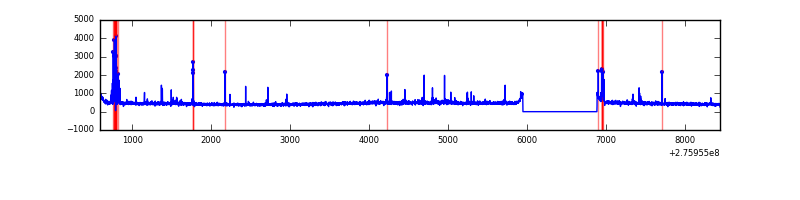 |
Top three noisy pixels from each quadrant. If the there are fewer than three noisy pixels in the level2.evt file, extra rows are filled as -1
| Pixel properties | Quadrant properties | ||||||
|---|---|---|---|---|---|---|---|
| Quadrant | DetID | PixID | Counts | Sigma | Mean | Median | Sigma |
| A | 15 | 174 | 1822842 | 11238.58 | 798 | 782 | 162.1 |
| A | 9 | 143 | 121865 | 746.85 | 798 | 782 | 162.1 |
| A | 3 | 1 | 12982 | 75.25 | 798 | 782 | 162.1 |
| B | 3 | 64 | 615059 | 3861.43 | 830 | 810 | 159.1 |
| B | 4 | 216 | 68164 | 423.42 | 830 | 810 | 159.1 |
| B | 10 | 16 | 61759 | 383.15 | 830 | 810 | 159.1 |
| C | 3 | 233 | 267879 | 1430.65 | 799 | 804 | 186.7 |
| C | 0 | 207 | 208039 | 1110.1 | 799 | 804 | 186.7 |
| C | 14 | 238 | 121820 | 648.25 | 799 | 804 | 186.7 |
| D | 10 | 70 | 95333 | 484.77 | 804 | 780 | 195.0 |
| D | 1 | 52 | 61752 | 312.6 | 804 | 780 | 195.0 |
| D | 2 | 234 | 35458 | 177.79 | 804 | 780 | 195.0 |
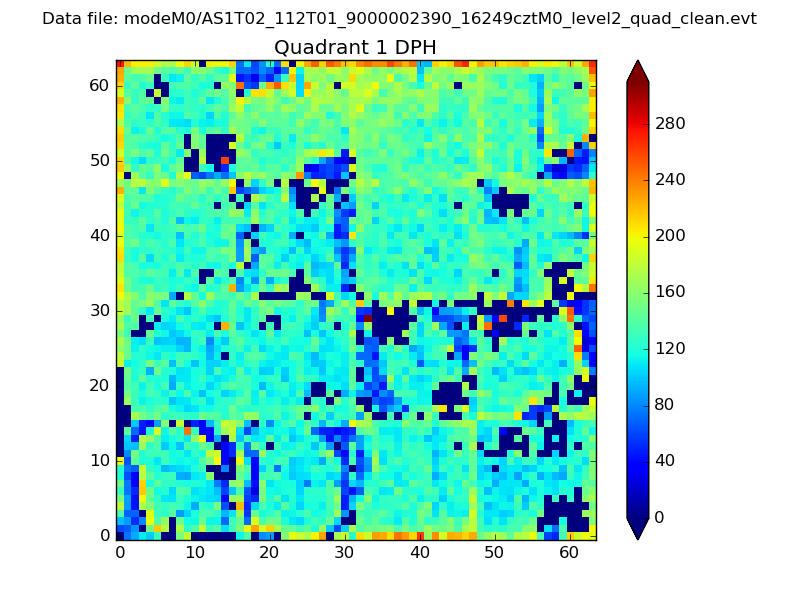
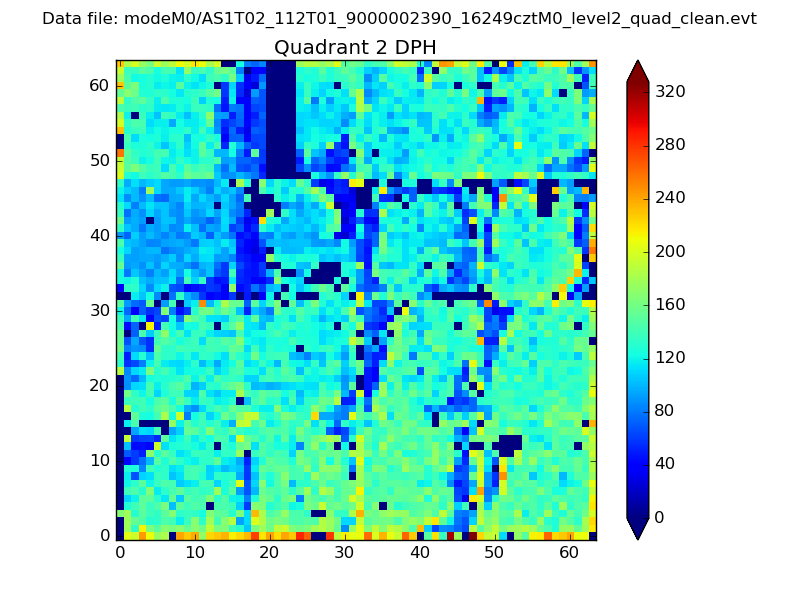
Histogram calculated using DETX and DETY for each event in the final _common_clean file
| Quadrant A | 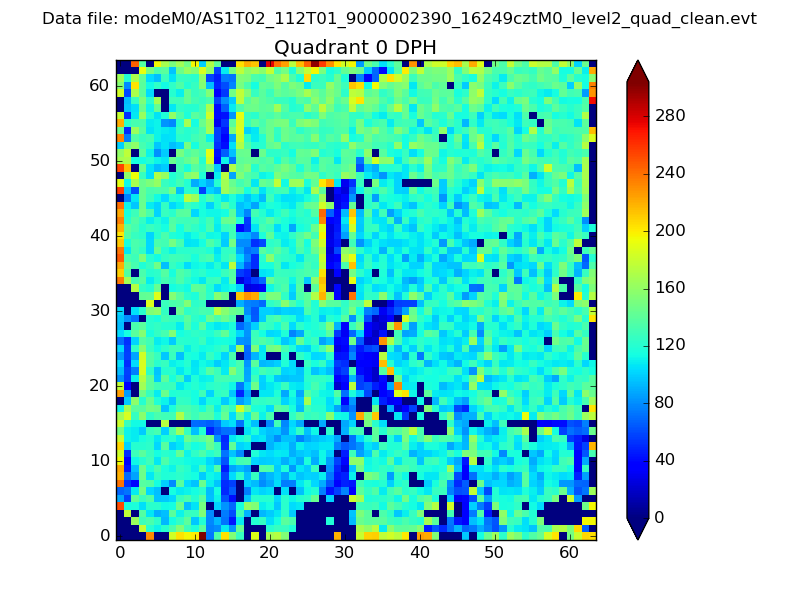 |
 |
Quadrant B |
|---|---|---|---|
| Quadrant D | 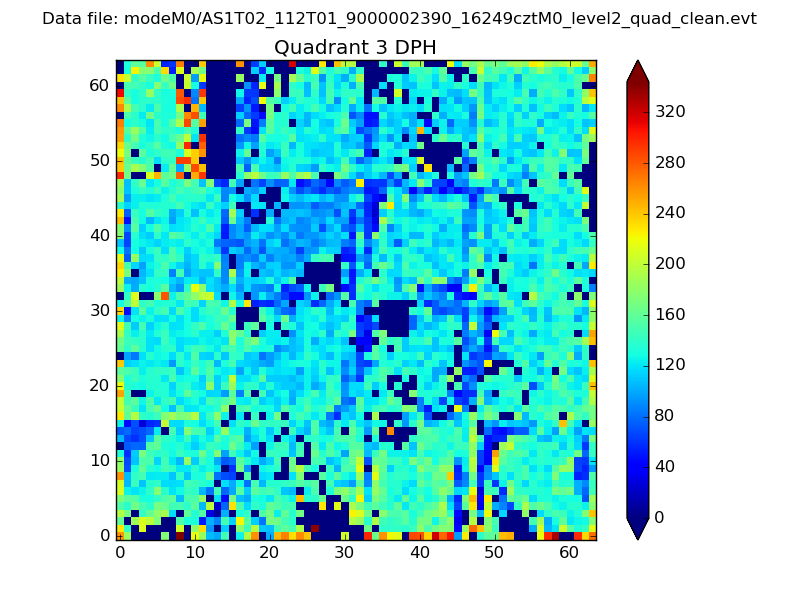 |
 |
Quadrant C |
| Plot type | Count rate plots | Images |
|---|---|---|
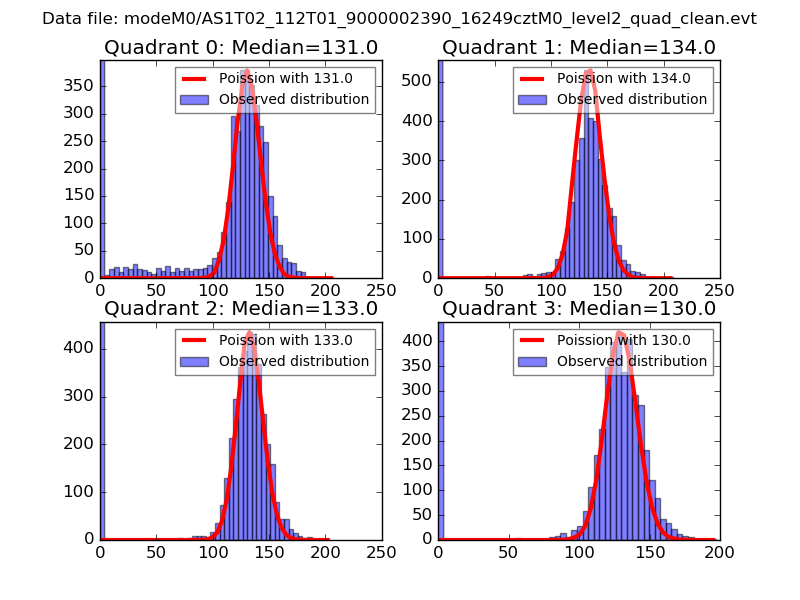
| Comparison with Poisson distribution Blue bars denote a histogram of data divided into 1 sec bins. Red curve is a Poisson curve with rate = median count rate of data. |
 |
 |
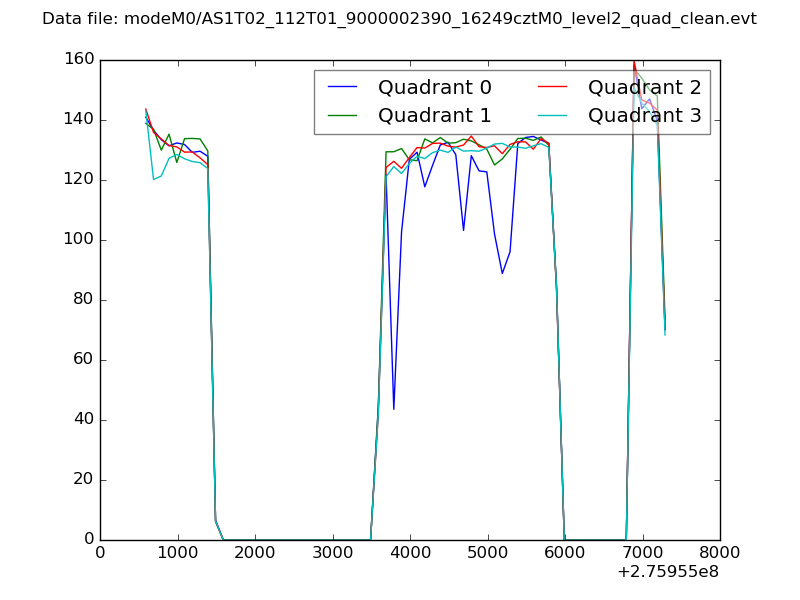
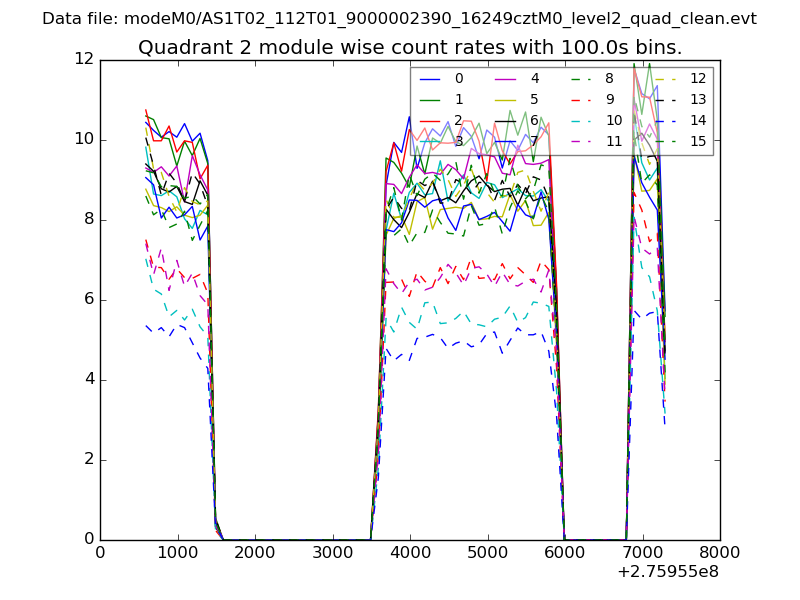
| Quadrant-wise count rates Data is divided into 100 sec bins |
 |
|
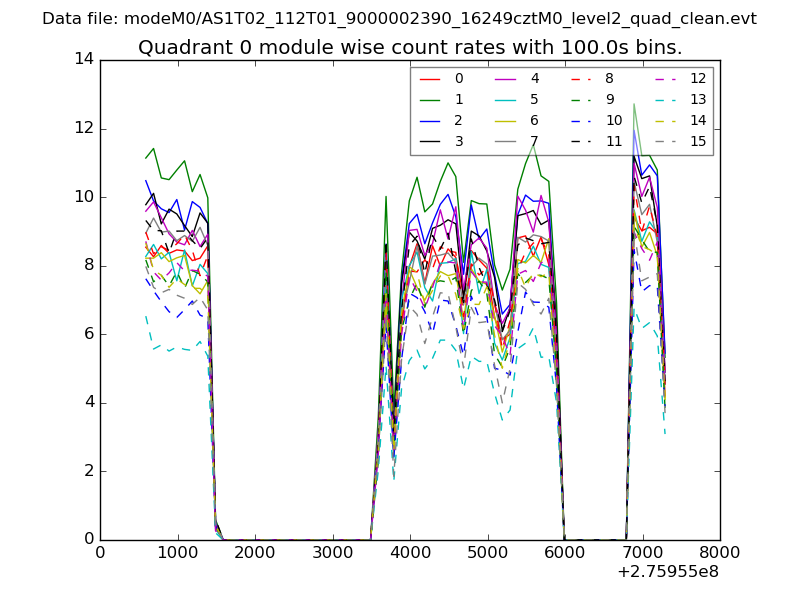
| Module-wise count rates for Quadrant A Data is divided into 100 sec bins |
 |
 |
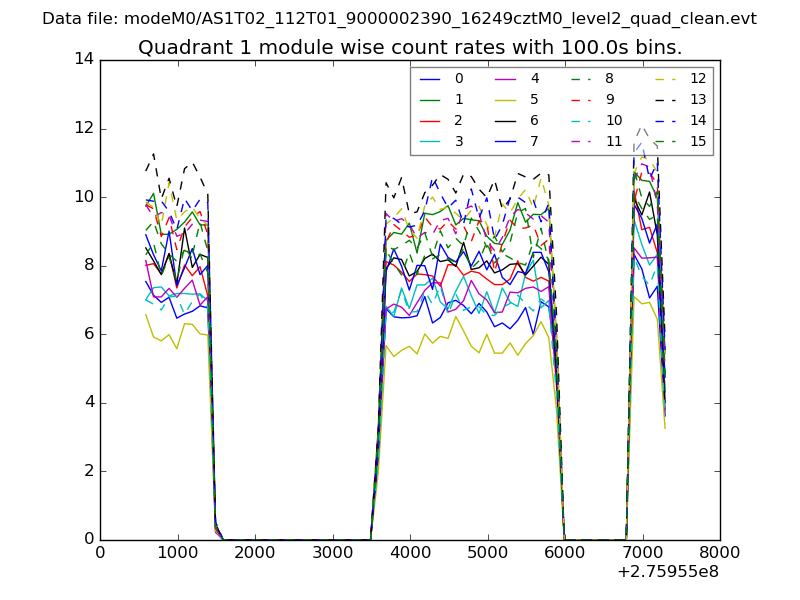
| Module-wise count rates for Quadrant B Data is divided into 100 sec bins |
 |
 |
| Module-wise count rates for Quadrant C Data is divided into 100 sec bins |
 |
 |
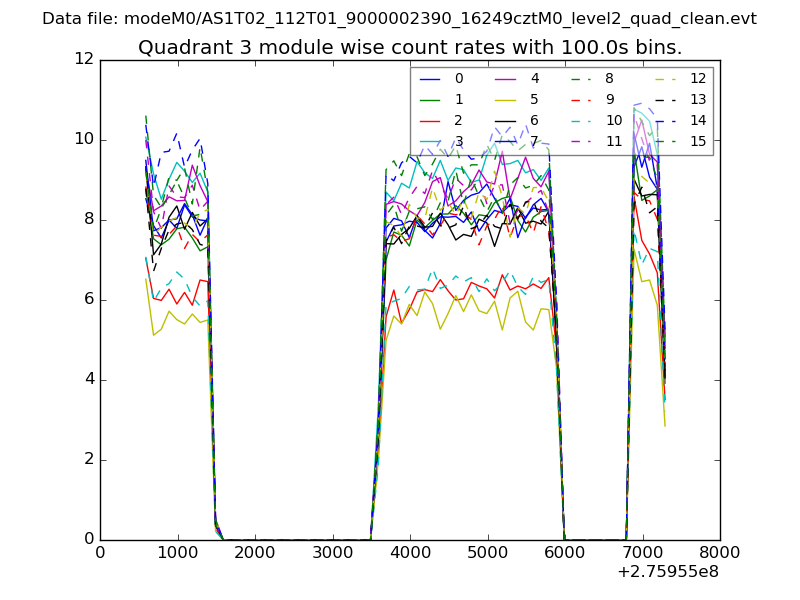
| Module-wise count rates for Quadrant D Data is divided into 100 sec bins |
 |
 |
| Parameter | Plot |
|---|---|
| CZT HV Monitor | 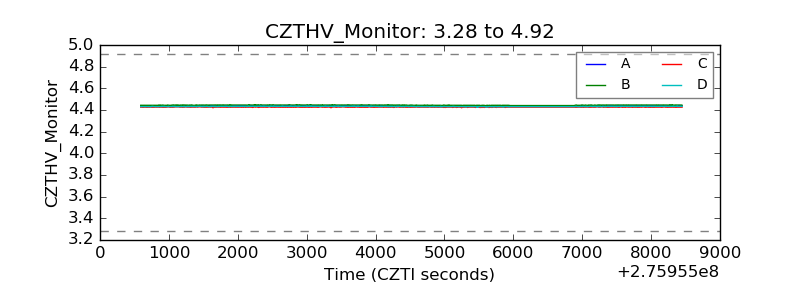 |
| D_VDD | 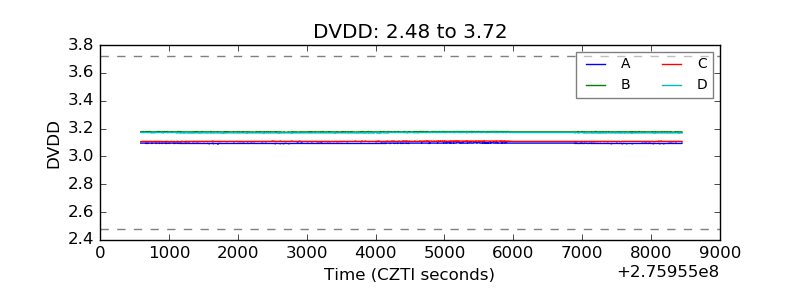 |
| Temperature 1 | 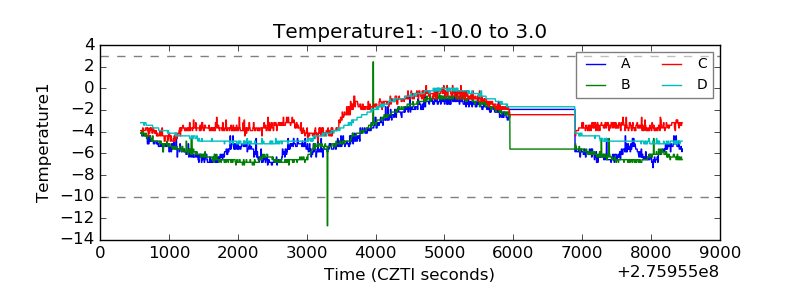 |
| Veto HV Monitor | 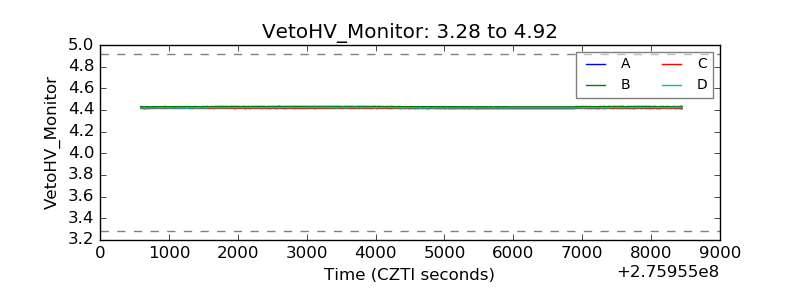 |
| Veto LLD | 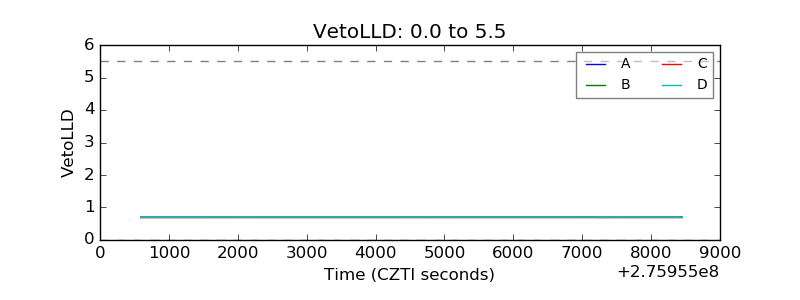 |
| Alpha Counter | 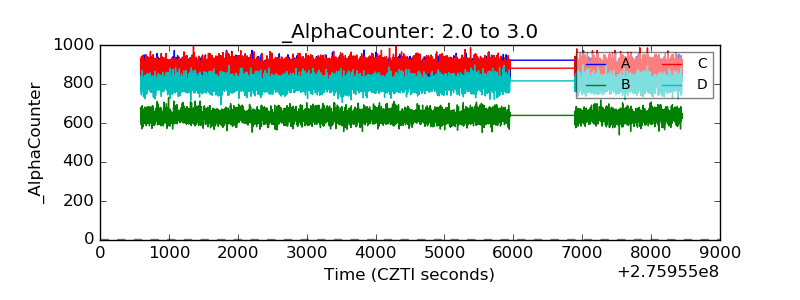 |
| _CPM_Rate | 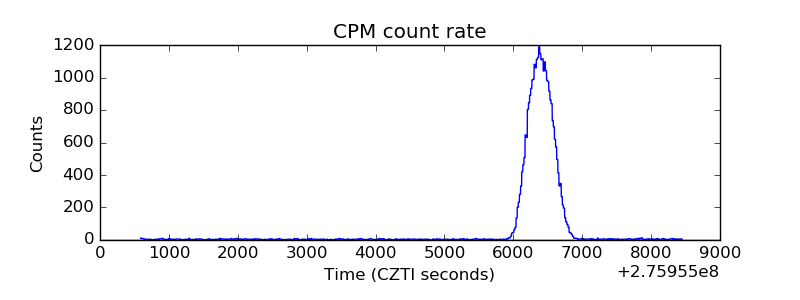 |
| CZT Counter | 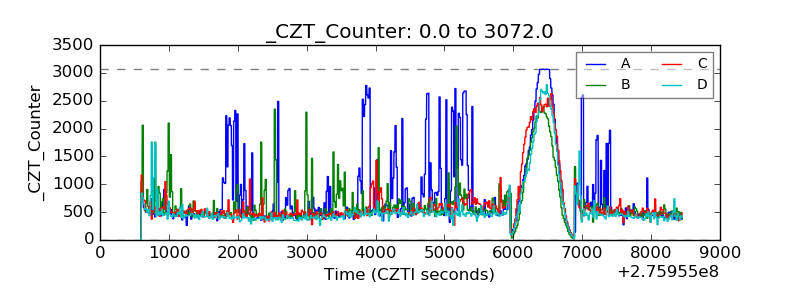 |
| +2.5 Volts monitor |  |
| +5 Volts monitor |  |
| _ROLL_ROT | 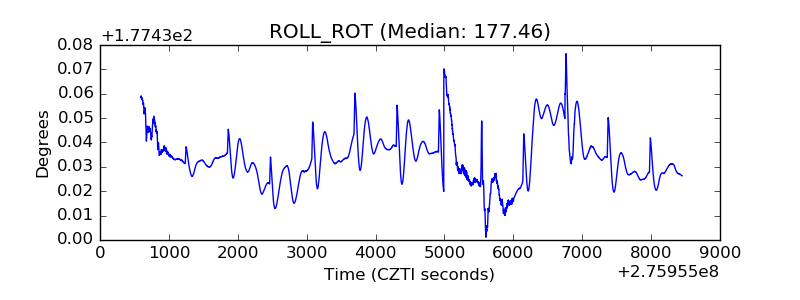 |
| _Roll_DEC | 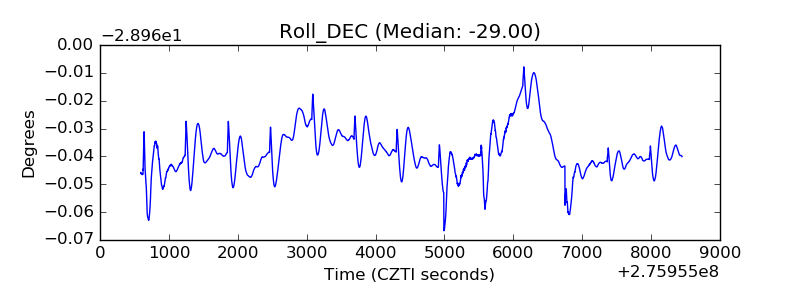 |
| _Roll_RA | 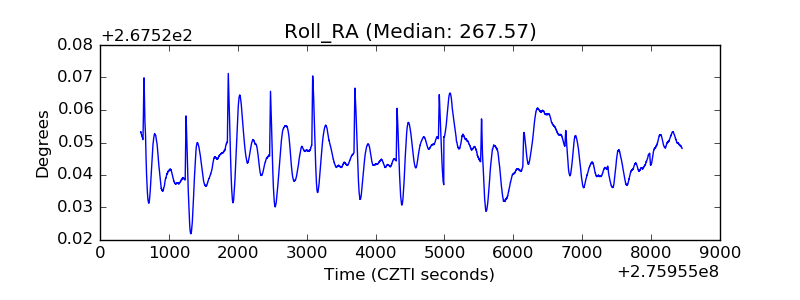 |
| Veto Counter | 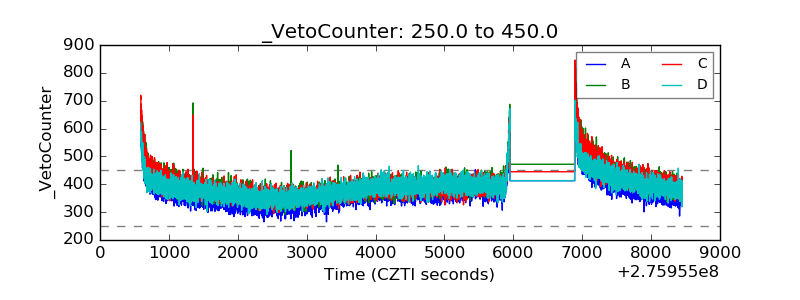 |