| Param | Original file | Final file |
|---|---|---|
| Filename | modeM0/AS1T02_112T01_9000002390_16250cztM0_level2.evt | modeM0/AS1T02_112T01_9000002390_16250cztM0_level2_quad_clean.evt |
| Size (bytes) | 466,499,520 | 63,912,960 |
| Size | 444.9 MB | 61.0 MB |
| Events in quadrant A | 3,854,956 | 374,725 |
| Events in quadrant B | 3,492,685 | 376,141 |
| Events in quadrant C | 3,222,393 | 373,728 |
| Events in quadrant D | 3,125,246 | 366,077 |
| Mode SS | |||
|---|---|---|---|
| Quadrant | BADHDUFLAG | Total packets | Discarded packets |
| A | 0 | 130 | 0 |
| B | 0 | 130 | 0 |
| C | 0 | 130 | 0 |
| D | 0 | 130 | 0 |
| Mode M9 | |||
|---|---|---|---|
| Quadrant | BADHDUFLAG | Total packets | Discarded packets |
| A | 0 | 10 | 0 |
| B | 0 | 10 | 0 |
| C | 0 | 10 | 0 |
| D | 0 | 10 | 0 |
| Mode M0 | |||
|---|---|---|---|
| Quadrant | BADHDUFLAG | Total packets | Discarded packets |
| A | 0 | 15523 | 2 |
| B | 0 | 14379 | 1 |
| C | 0 | 13319 | 1 |
| D | 0 | 13625 | 1 |
| Quadrant | Total seconds | Saturated seconds | Saturation percentage |
|---|---|---|---|
| A | 6367 | 245 | 3.847966% |
| B | 6367 | 79 | 1.240773% |
| C | 6367 | 61 | 0.958065% |
| D | 6367 | 21 | 0.329826% |
Noise dominated data is calculated using 1-second bins in cleaned event files. If a bin has >2000 counts, and if more than 50% of those come from <1% of pixels, then it is considered to be noise-dominated and hence unusable.
| Quadrant | # 1 sec bins | Bins with >0 counts | Bins with >2000 counts | High rate bins dominated by noise | Noise dominated (total time) | Noise dominated (detector-on time) | Marked lightcurve |
|---|---|---|---|---|---|---|---|
| A | 7463 | 6369 | 179 | 179 | 2.40% | 2.81% | 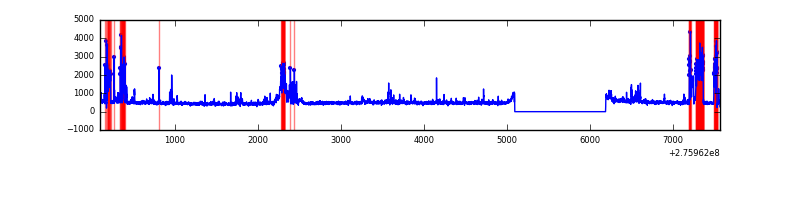 |
| B | 7463 | 6369 | 20 | 20 | 0.27% | 0.31% | 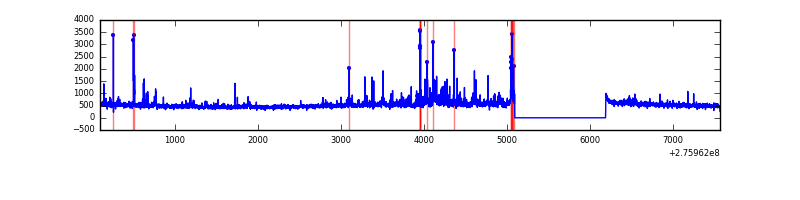 |
| C | 7463 | 6369 | 1 | 1 | 0.01% | 0.02% | 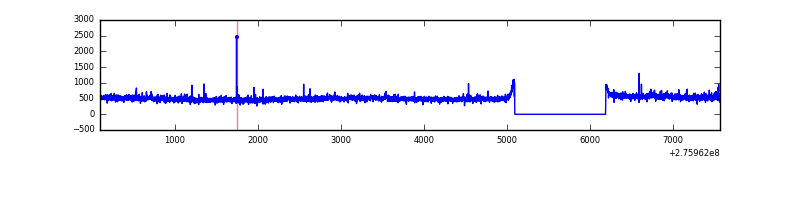 |
| D | 7463 | 6369 | 2 | 2 | 0.03% | 0.03% | 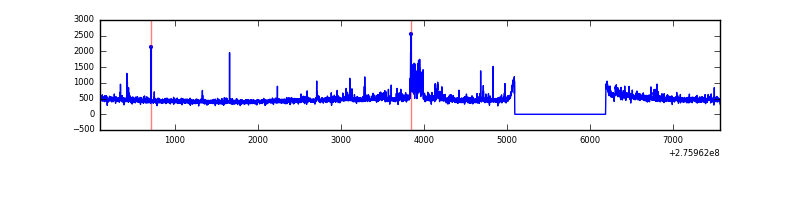 |
Top three noisy pixels from each quadrant. If the there are fewer than three noisy pixels in the level2.evt file, extra rows are filled as -1
| Pixel properties | Quadrant properties | ||||||
|---|---|---|---|---|---|---|---|
| Quadrant | DetID | PixID | Counts | Sigma | Mean | Median | Sigma |
| A | 15 | 174 | 811574 | 5207.38 | 772 | 759 | 155.7 |
| A | 9 | 143 | 54068 | 342.37 | 772 | 759 | 155.7 |
| A | 3 | 1 | 11330 | 67.89 | 772 | 759 | 155.7 |
| B | 7 | 220 | 96497 | 647.54 | 783 | 763 | 147.8 |
| B | 3 | 64 | 74092 | 495.99 | 783 | 763 | 147.8 |
| B | 0 | 198 | 65033 | 434.72 | 783 | 763 | 147.8 |
| C | 3 | 233 | 147704 | 835.32 | 755 | 760 | 175.9 |
| C | 14 | 238 | 116318 | 656.9 | 755 | 760 | 175.9 |
| C | 7 | 247 | 11386 | 60.4 | 755 | 760 | 175.9 |
| D | 1 | 52 | 214638 | 1160.9 | 758 | 737 | 184.3 |
| D | 2 | 234 | 27206 | 143.65 | 758 | 737 | 184.3 |
| D | 2 | 120 | 16929 | 87.88 | 758 | 737 | 184.3 |
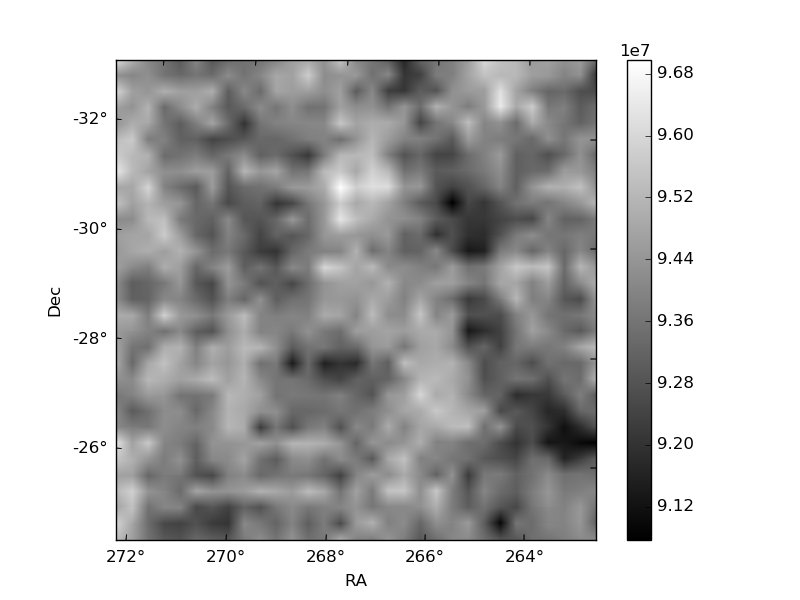
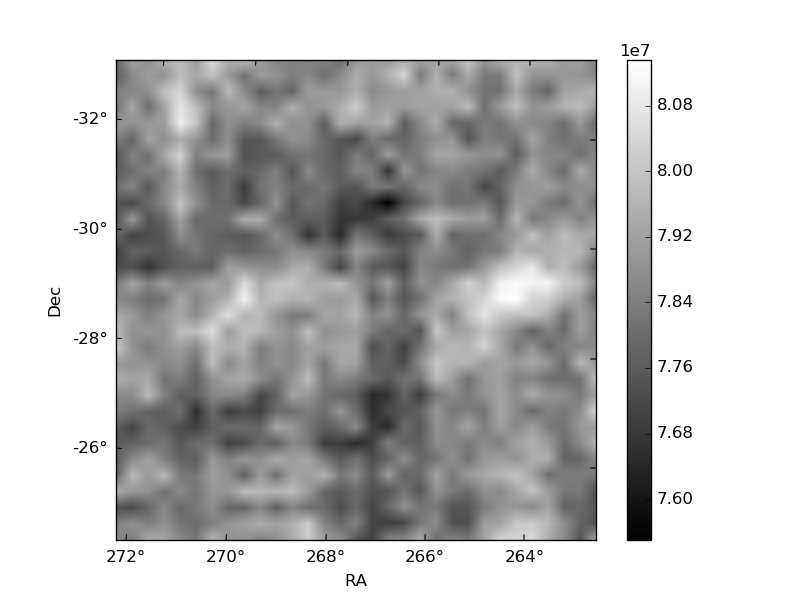
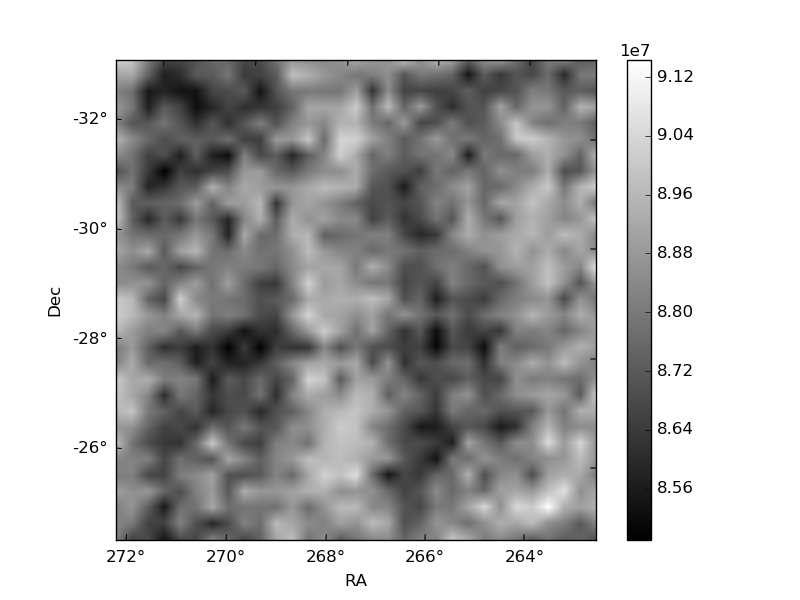
Histogram calculated using DETX and DETY for each event in the final _common_clean file
| Quadrant A | 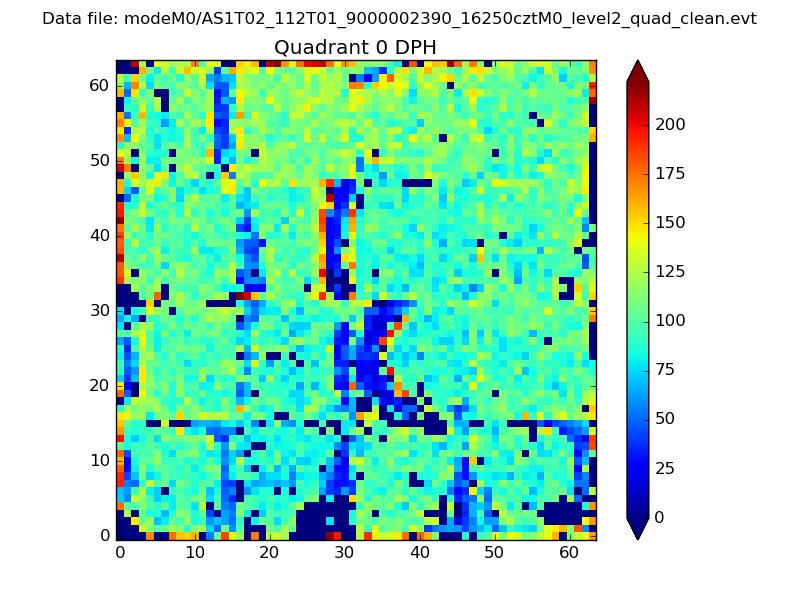 |
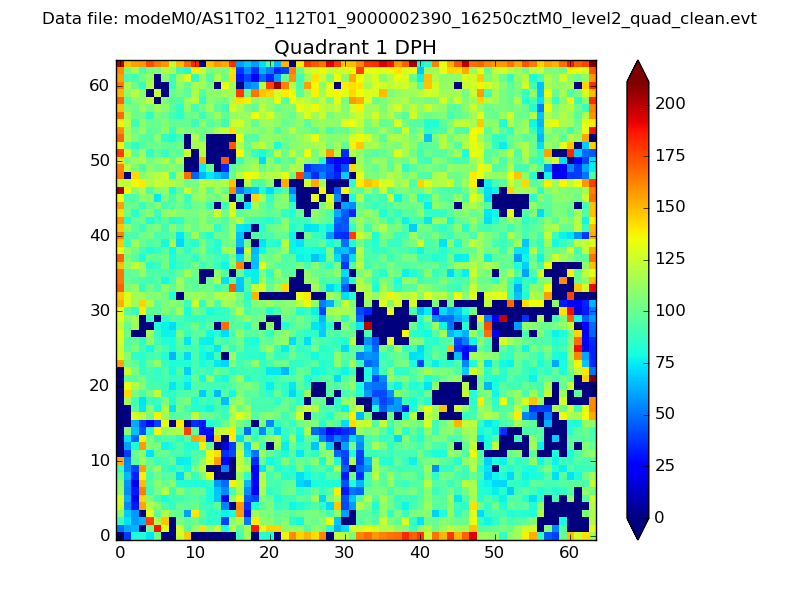 |
Quadrant B |
|---|---|---|---|
| Quadrant D | 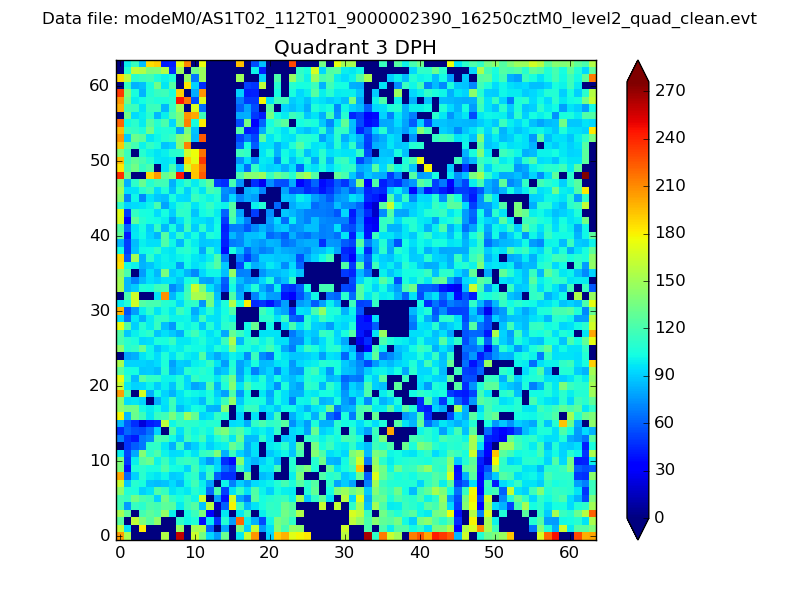 |
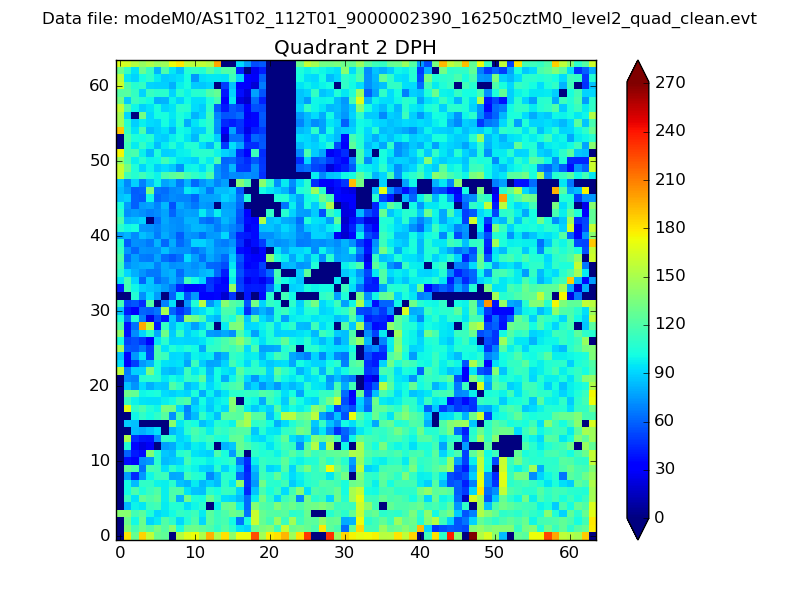 |
Quadrant C |
| Plot type | Count rate plots | Images |
|---|---|---|
| Comparison with Poisson distribution Blue bars denote a histogram of data divided into 1 sec bins. Red curve is a Poisson curve with rate = median count rate of data. |
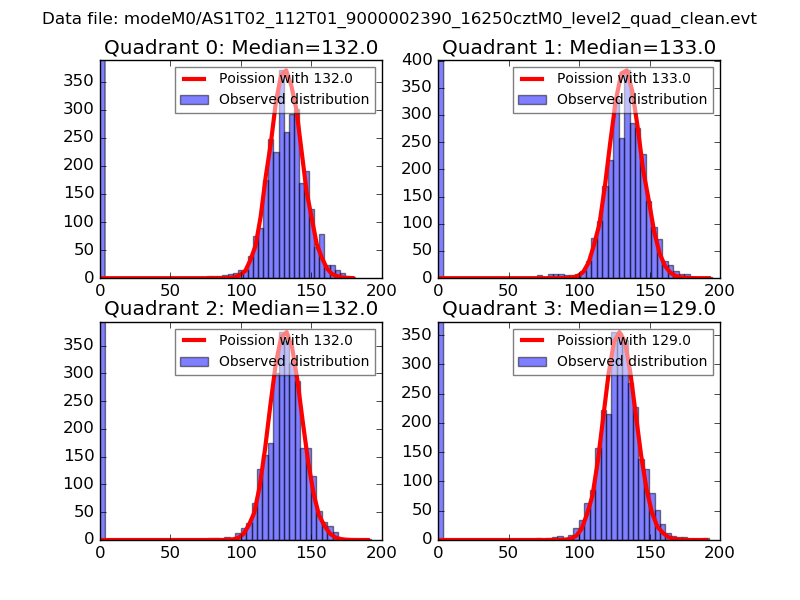 |
 |
| Quadrant-wise count rates Data is divided into 100 sec bins |
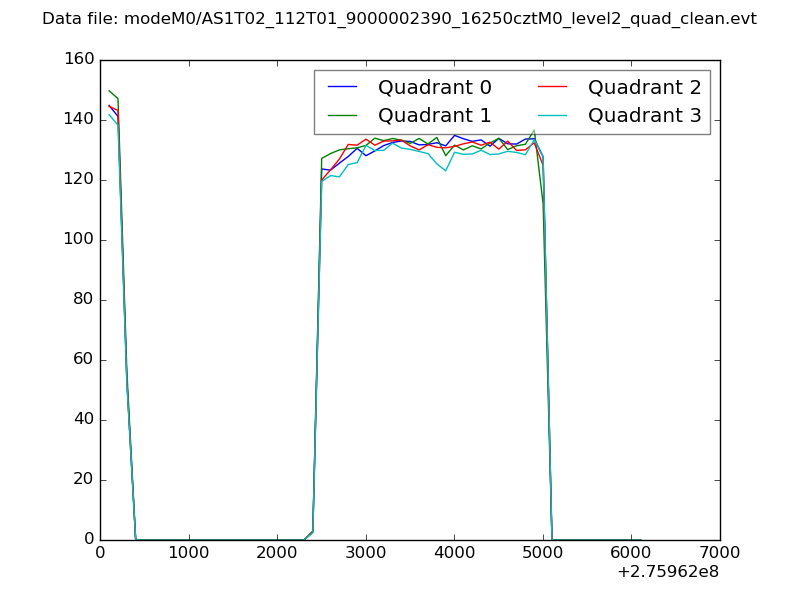 |
|
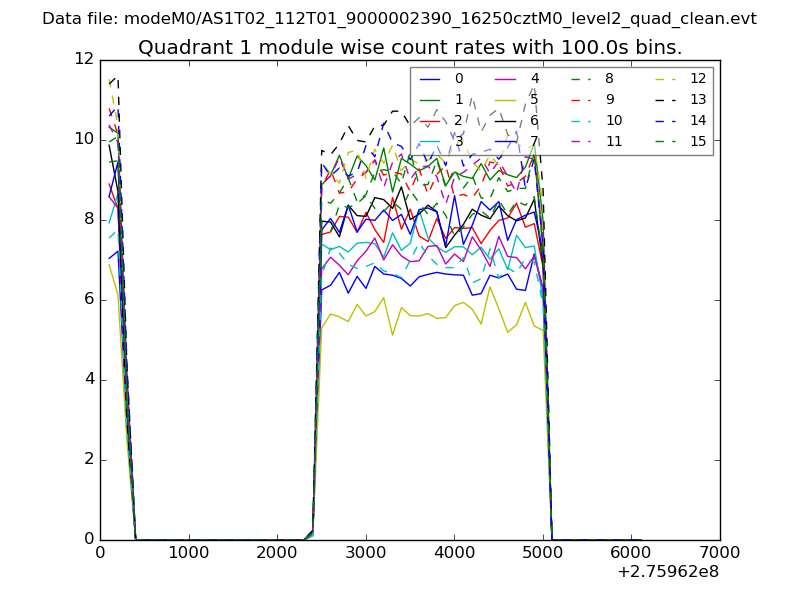
| Module-wise count rates for Quadrant A Data is divided into 100 sec bins |
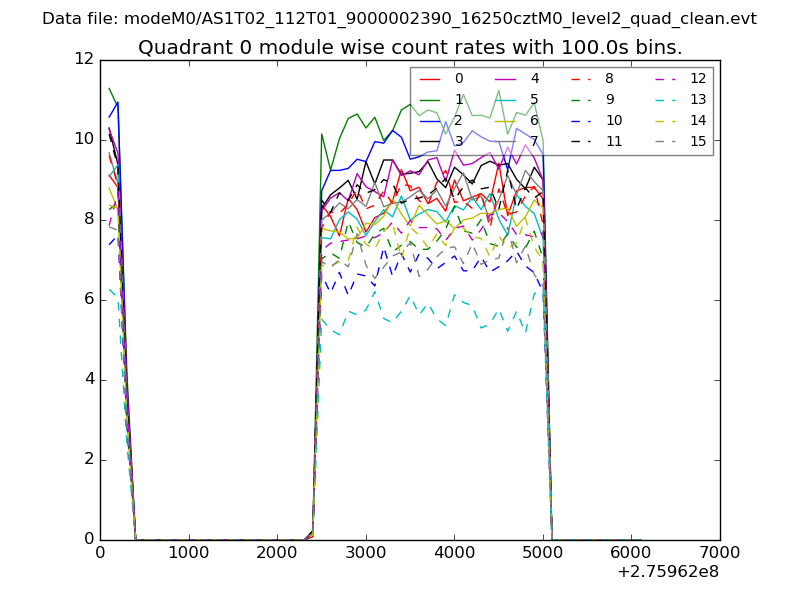 |
 |
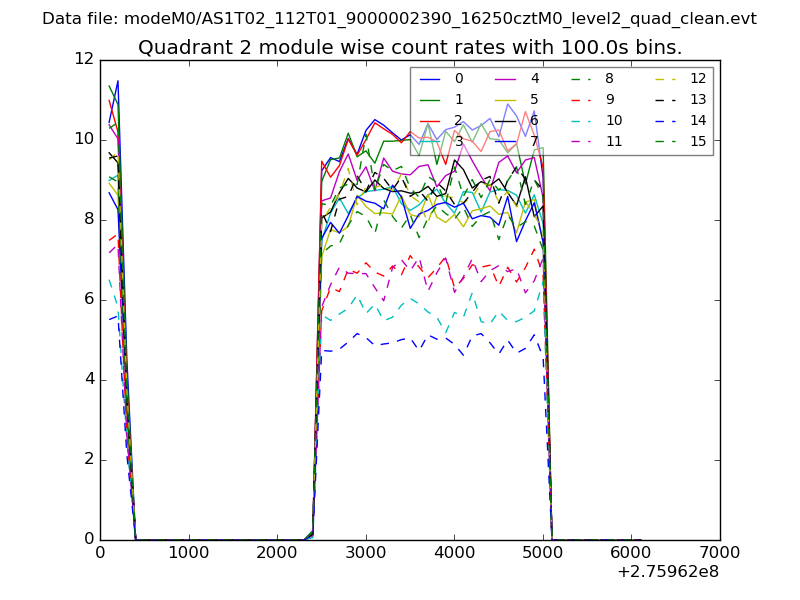
| Module-wise count rates for Quadrant B Data is divided into 100 sec bins |
 |
 |
| Module-wise count rates for Quadrant C Data is divided into 100 sec bins |
 |
 |
| Module-wise count rates for Quadrant D Data is divided into 100 sec bins |
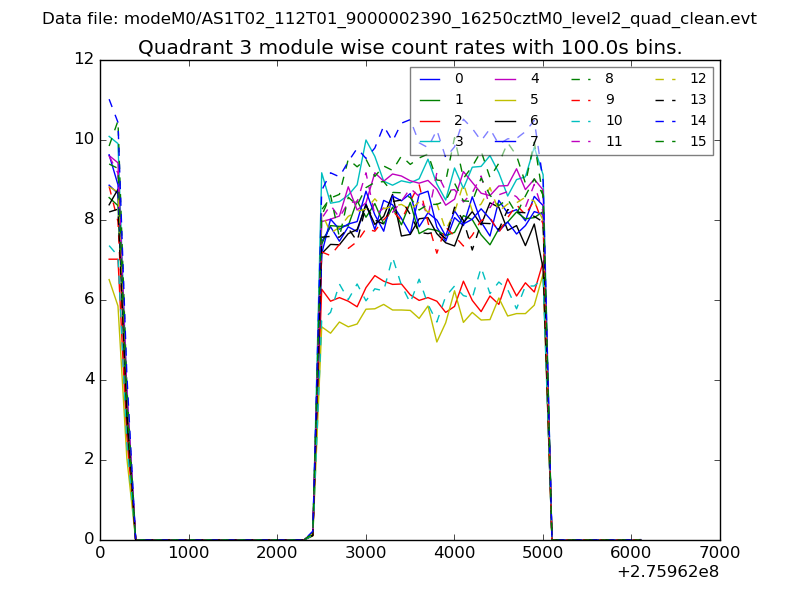 |
 |
| Parameter | Plot |
|---|---|
| CZT HV Monitor | 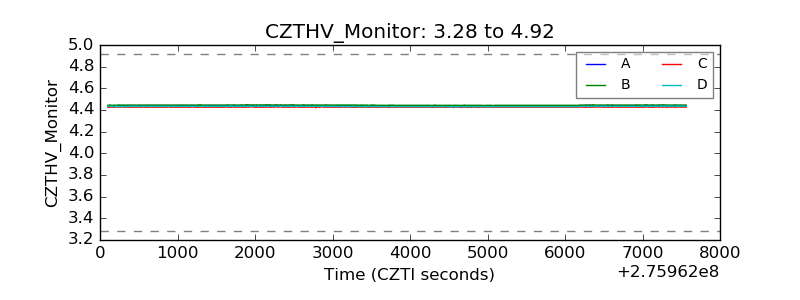 |
| D_VDD | 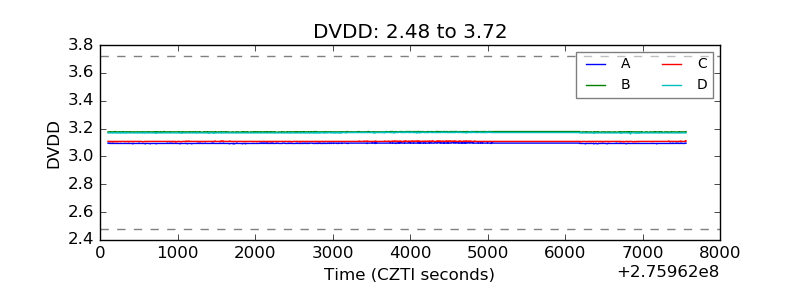 |
| Temperature 1 | 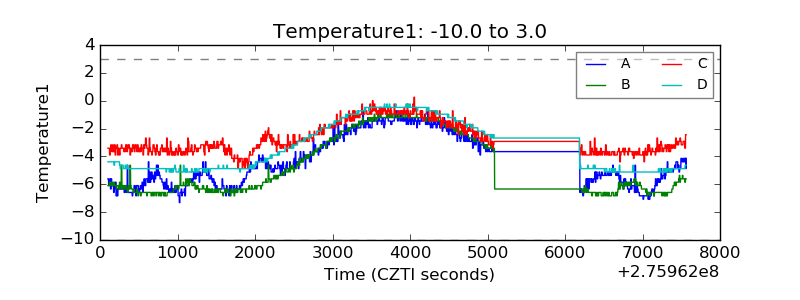 |
| Veto HV Monitor | 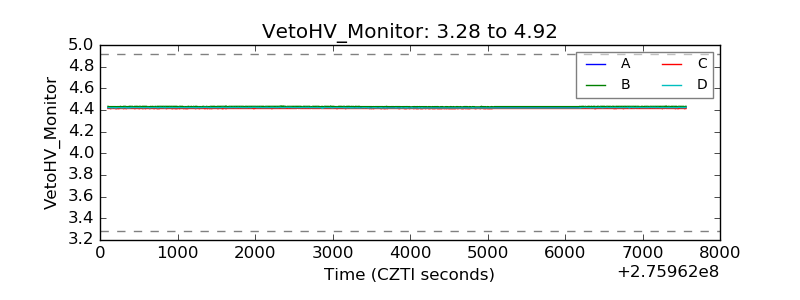 |
| Veto LLD | 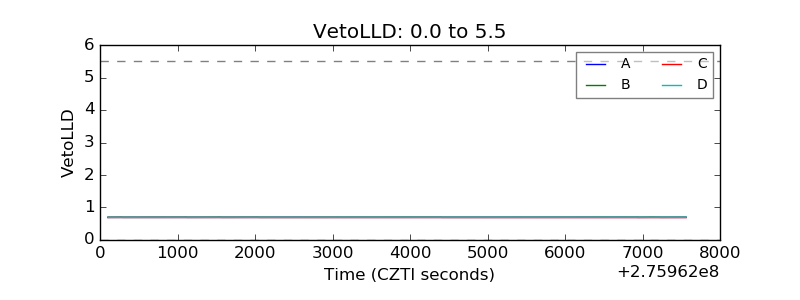 |
| Alpha Counter | 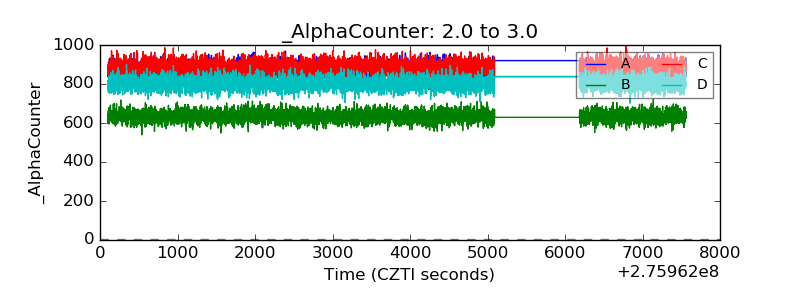 |
| _CPM_Rate | 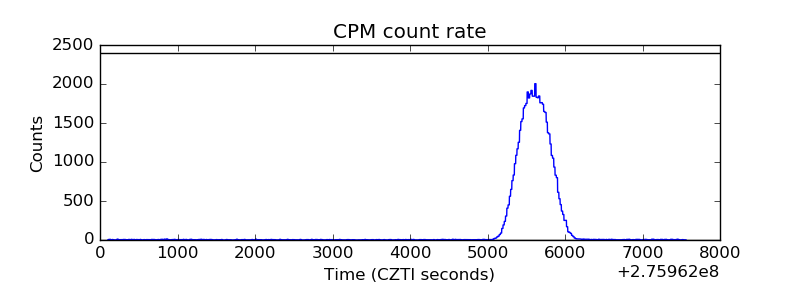 |
| CZT Counter |  |
| +2.5 Volts monitor |  |
| +5 Volts monitor |  |
| _ROLL_ROT | 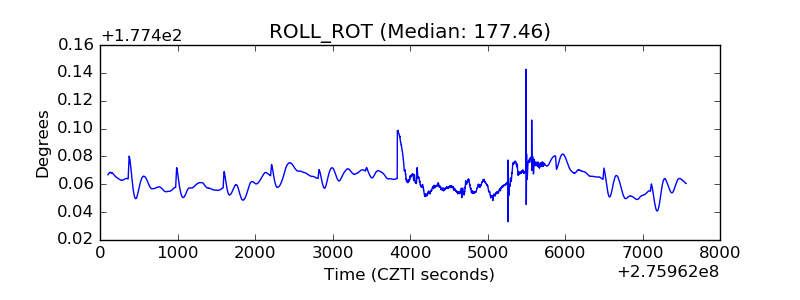 |
| _Roll_DEC | 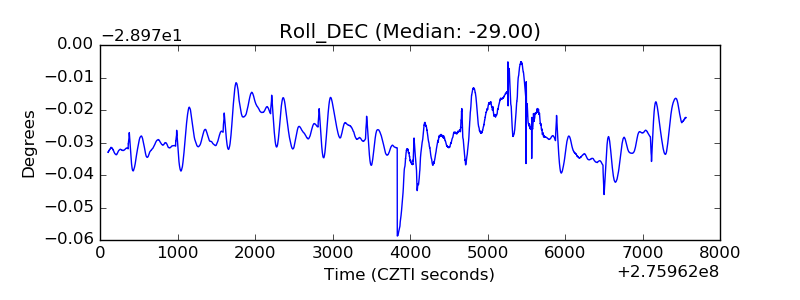 |
| _Roll_RA |  |
| Veto Counter | 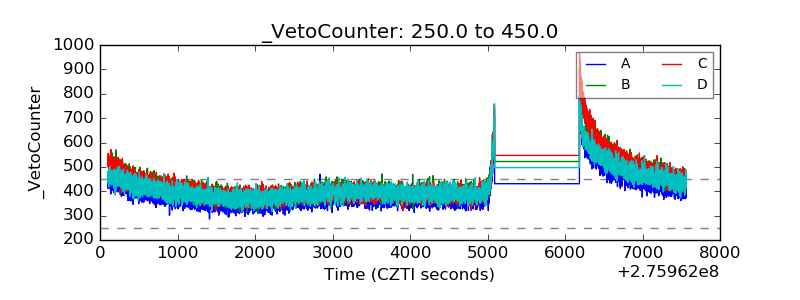 |