| Param | Original file | Final file |
|---|---|---|
| Filename | modeM0/AS1T02_112T01_9000002390_16252cztM0_level2.evt | modeM0/AS1T02_112T01_9000002390_16252cztM0_level2_quad_clean.evt |
| Size (bytes) | 492,586,560 | 64,552,320 |
| Size | 469.8 MB | 61.6 MB |
| Events in quadrant A | 4,281,603 | 389,533 |
| Events in quadrant B | 4,037,725 | 371,949 |
| Events in quadrant C | 3,190,056 | 391,661 |
| Events in quadrant D | 3,000,474 | 381,166 |
| Mode SS | |||
|---|---|---|---|
| Quadrant | BADHDUFLAG | Total packets | Discarded packets |
| A | 0 | 122 | 0 |
| B | 0 | 122 | 0 |
| C | 0 | 122 | 0 |
| D | 0 | 122 | 0 |
| Mode M9 | |||
|---|---|---|---|
| Quadrant | BADHDUFLAG | Total packets | Discarded packets |
| A | 0 | 12 | 0 |
| B | 0 | 12 | 0 |
| C | 0 | 12 | 0 |
| D | 0 | 12 | 0 |
| Mode M0 | |||
|---|---|---|---|
| Quadrant | BADHDUFLAG | Total packets | Discarded packets |
| A | 0 | 16452 | 2 |
| B | 0 | 15775 | 1 |
| C | 0 | 13021 | 1 |
| D | 0 | 12708 | 1 |
| Quadrant | Total seconds | Saturated seconds | Saturation percentage |
|---|---|---|---|
| A | 6014 | 416 | 6.917193% |
| B | 6014 | 373 | 6.202195% |
| C | 6014 | 83 | 1.380113% |
| D | 6014 | 48 | 0.798138% |
Noise dominated data is calculated using 1-second bins in cleaned event files. If a bin has >2000 counts, and if more than 50% of those come from <1% of pixels, then it is considered to be noise-dominated and hence unusable.
| Quadrant | # 1 sec bins | Bins with >0 counts | Bins with >2000 counts | High rate bins dominated by noise | Noise dominated (total time) | Noise dominated (detector-on time) | Marked lightcurve |
|---|---|---|---|---|---|---|---|
| A | 7200 | 6016 | 299 | 299 | 4.15% | 4.97% | 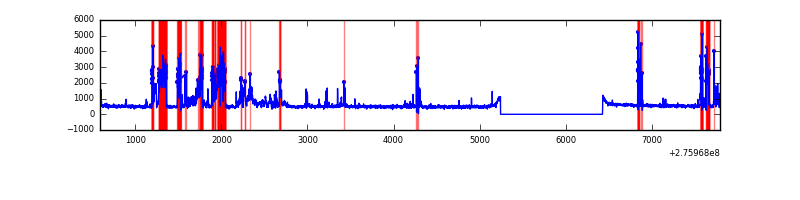 |
| B | 7200 | 6015 | 176 | 176 | 2.44% | 2.93% | 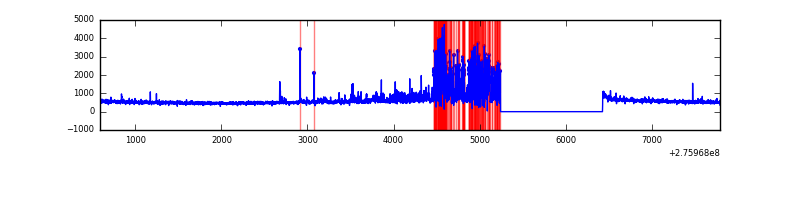 |
| C | 7200 | 6016 | 0 | 0 | 0.00% | 0.00% | 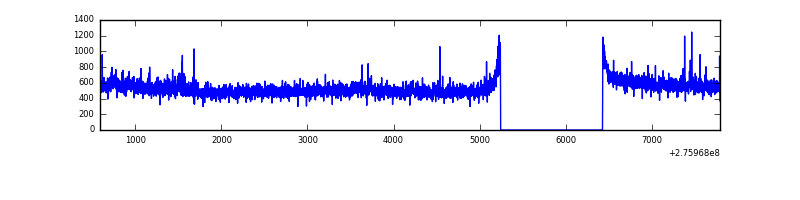 |
| D | 7200 | 6016 | 8 | 8 | 0.11% | 0.13% | 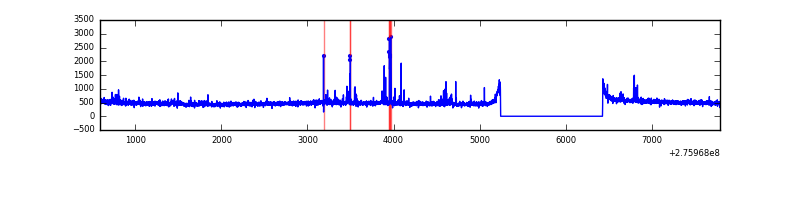 |
Top three noisy pixels from each quadrant. If the there are fewer than three noisy pixels in the level2.evt file, extra rows are filled as -1
| Pixel properties | Quadrant properties | ||||||
|---|---|---|---|---|---|---|---|
| Quadrant | DetID | PixID | Counts | Sigma | Mean | Median | Sigma |
| A | 15 | 174 | 1353672 | 8977.52 | 756 | 743 | 150.7 |
| A | 9 | 143 | 13308 | 83.38 | 756 | 743 | 150.7 |
| A | 3 | 1 | 6797 | 40.17 | 756 | 743 | 150.7 |
| B | 3 | 64 | 713267 | 5045.84 | 759 | 743 | 141.2 |
| B | 7 | 220 | 74960 | 525.58 | 759 | 743 | 141.2 |
| B | 4 | 216 | 60398 | 422.46 | 759 | 743 | 141.2 |
| C | 3 | 233 | 137960 | 801.71 | 747 | 754 | 171.1 |
| C | 14 | 238 | 117765 | 683.71 | 747 | 754 | 171.1 |
| C | 7 | 247 | 13864 | 76.6 | 747 | 754 | 171.1 |
| D | 1 | 52 | 66790 | 360.47 | 757 | 736 | 183.2 |
| D | 10 | 70 | 25700 | 136.23 | 757 | 736 | 183.2 |
| D | 2 | 234 | 23027 | 121.65 | 757 | 736 | 183.2 |
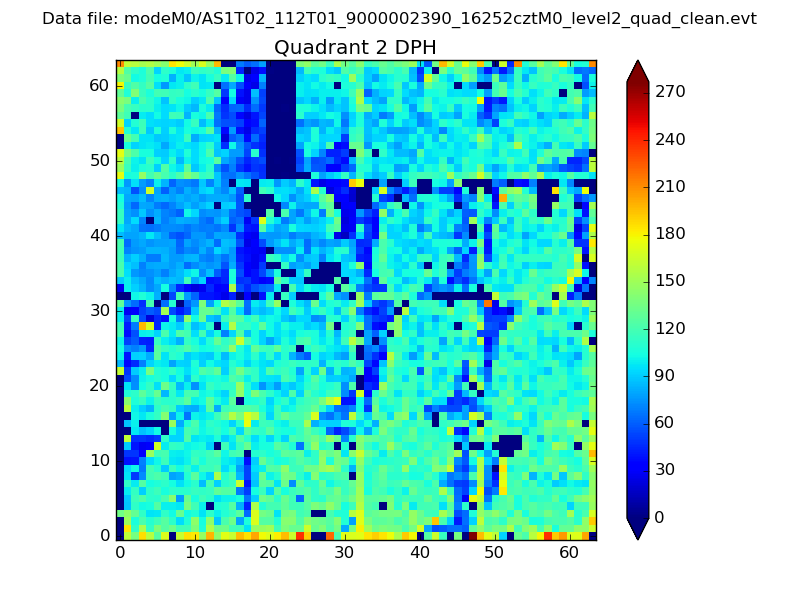
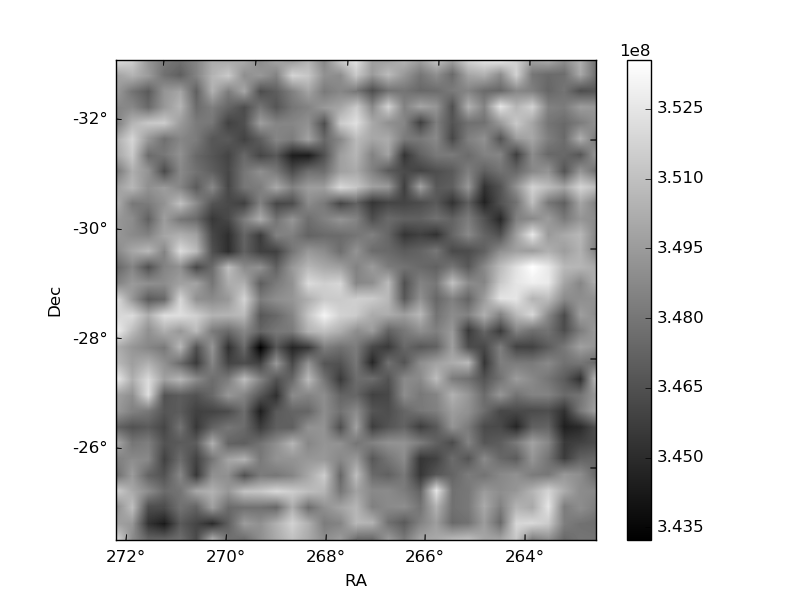
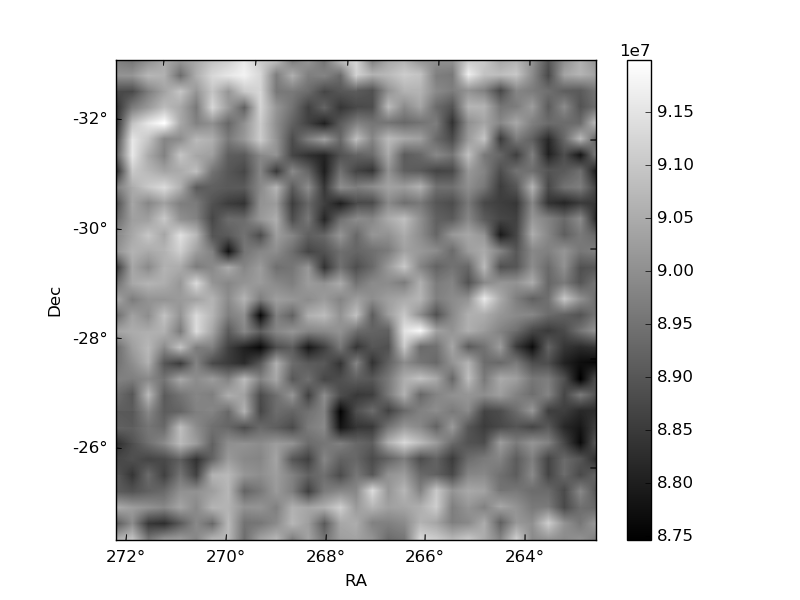
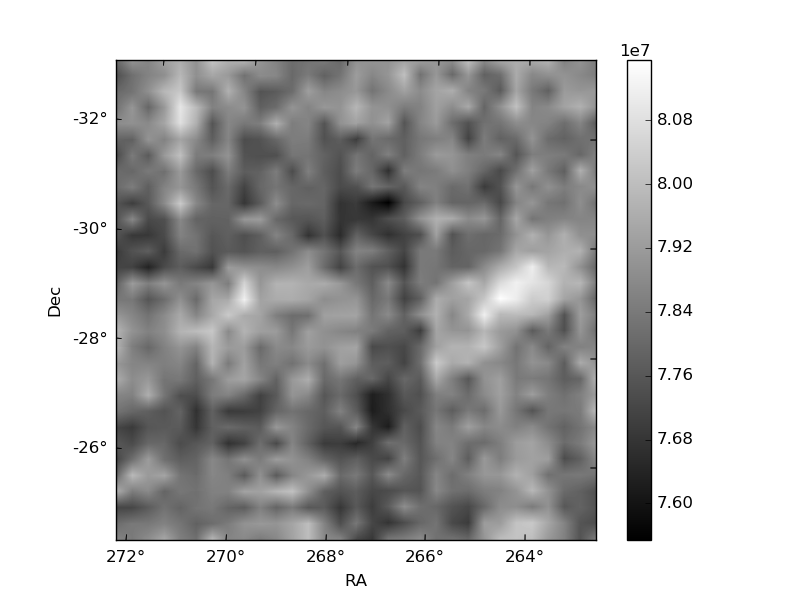
Histogram calculated using DETX and DETY for each event in the final _common_clean file
| Quadrant A | 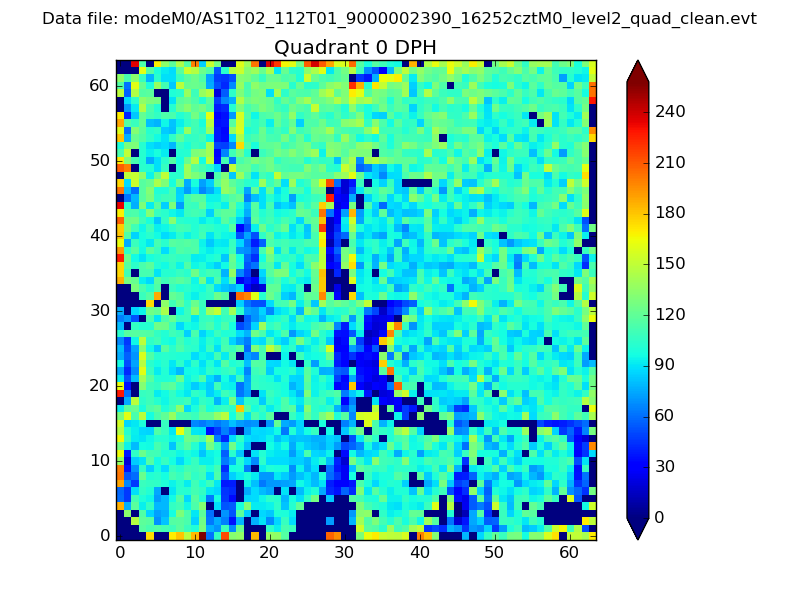 |
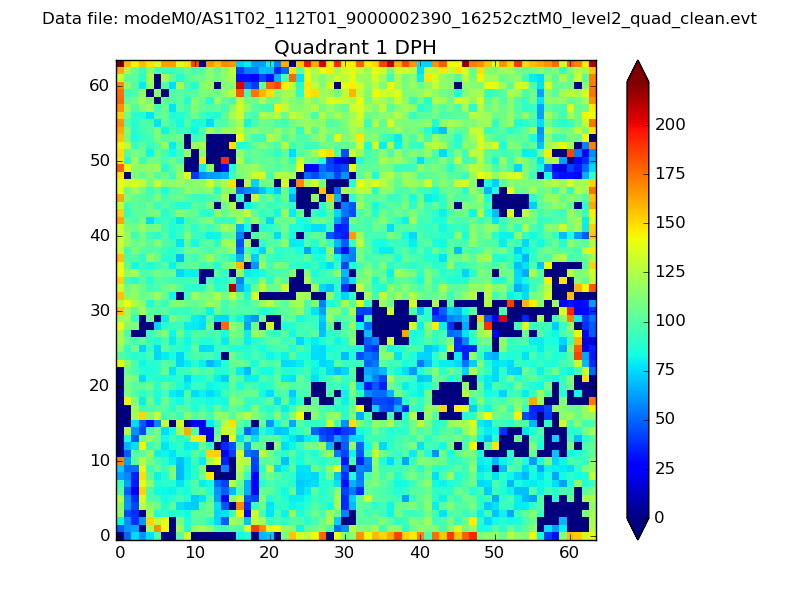 |
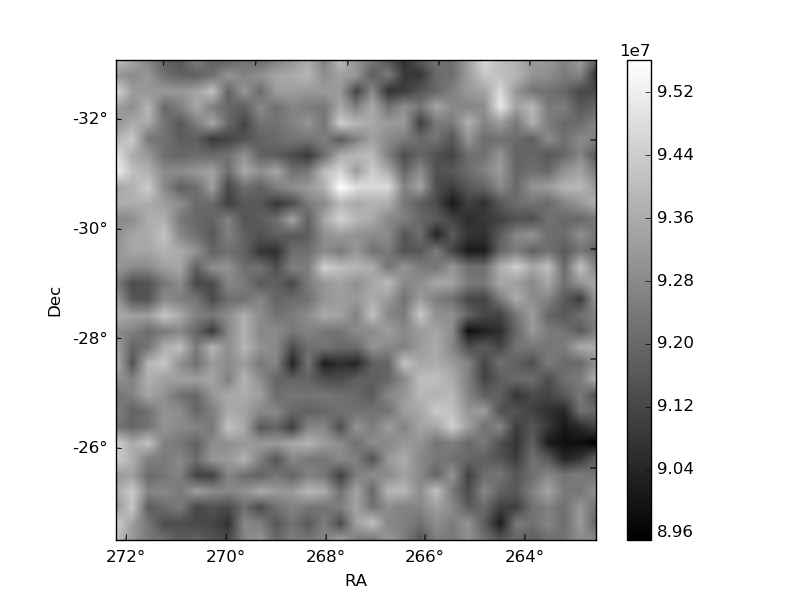
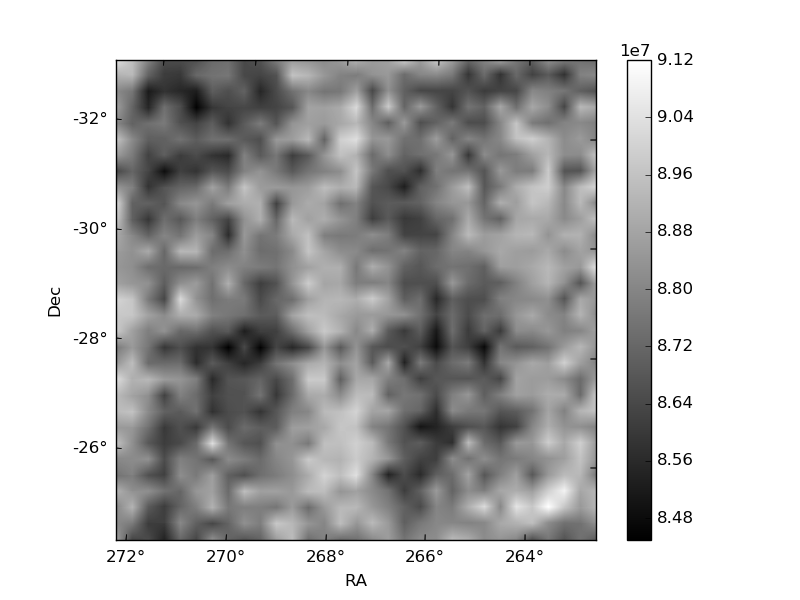
Quadrant B |
|---|---|---|---|
| Quadrant D | 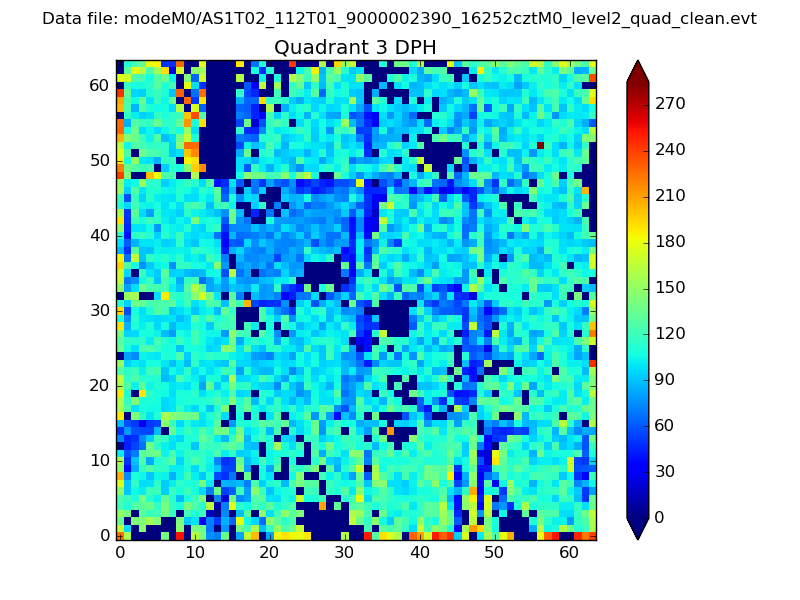 |
 |
Quadrant C |
| Plot type | Count rate plots | Images |
|---|---|---|
| Comparison with Poisson distribution Blue bars denote a histogram of data divided into 1 sec bins. Red curve is a Poisson curve with rate = median count rate of data. |
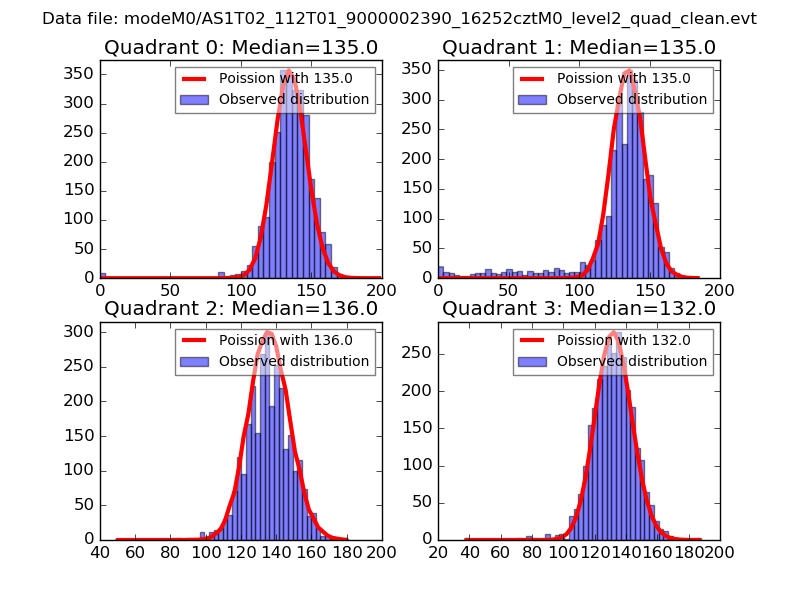 |
 |
| Quadrant-wise count rates Data is divided into 100 sec bins |
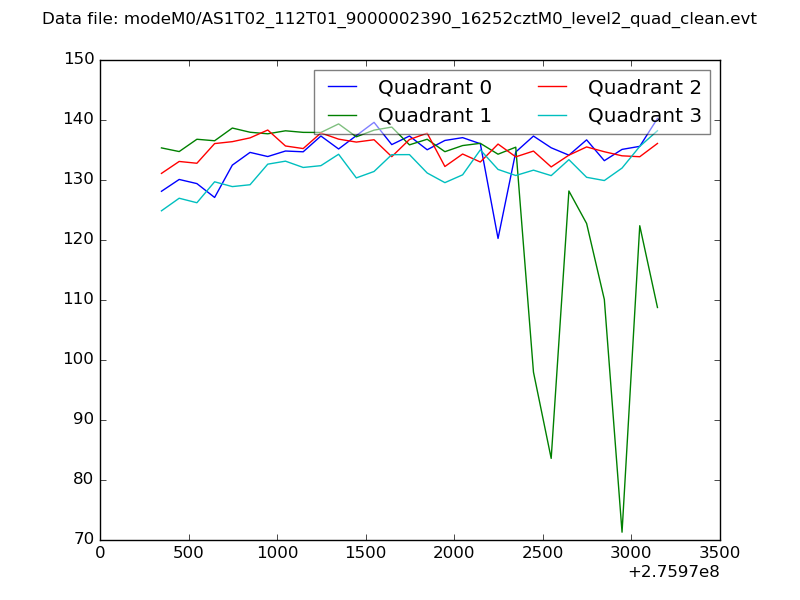 |
|
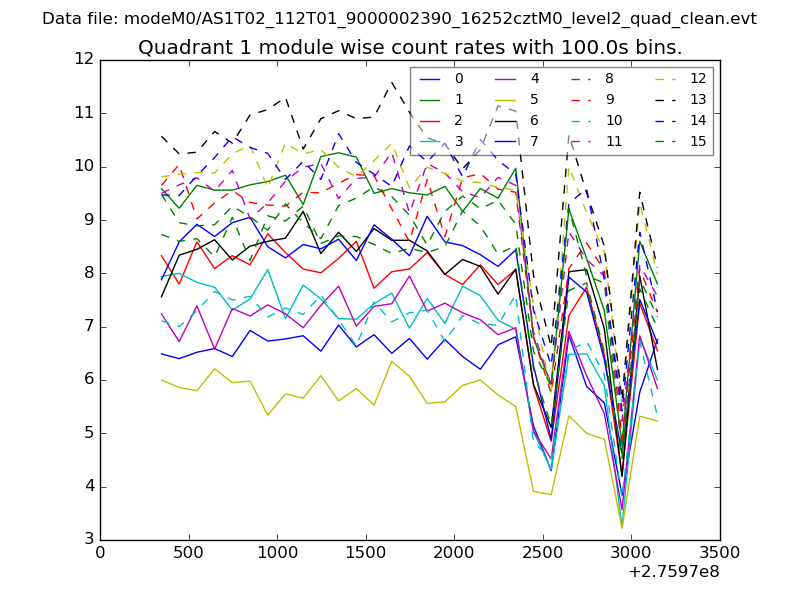
| Module-wise count rates for Quadrant A Data is divided into 100 sec bins |
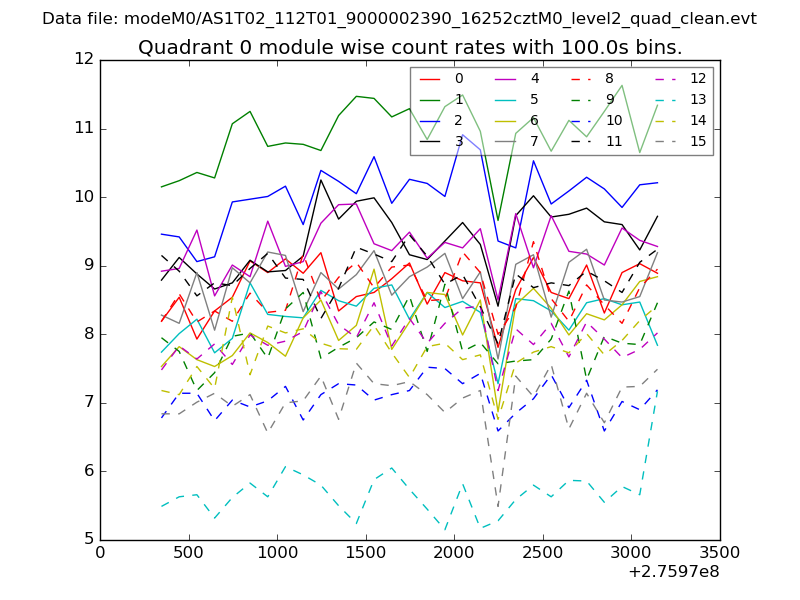 |
 |
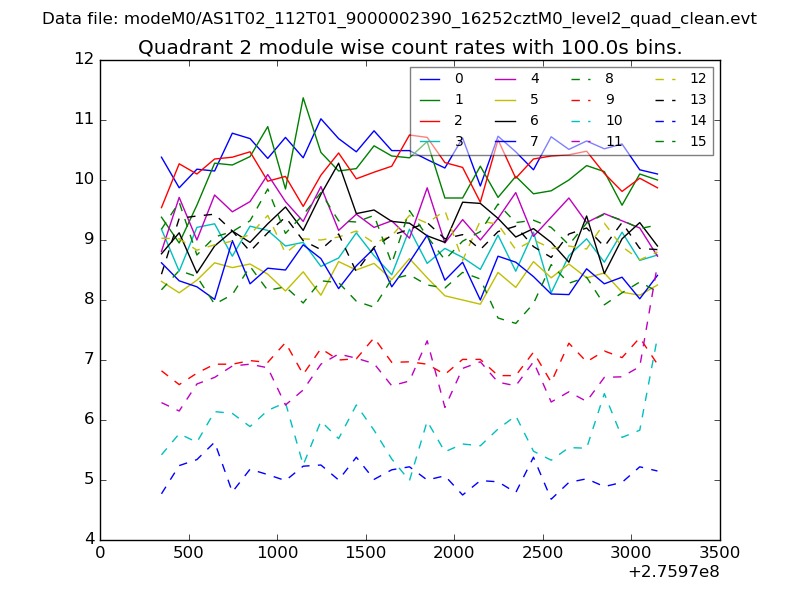
| Module-wise count rates for Quadrant B Data is divided into 100 sec bins |
 |
 |
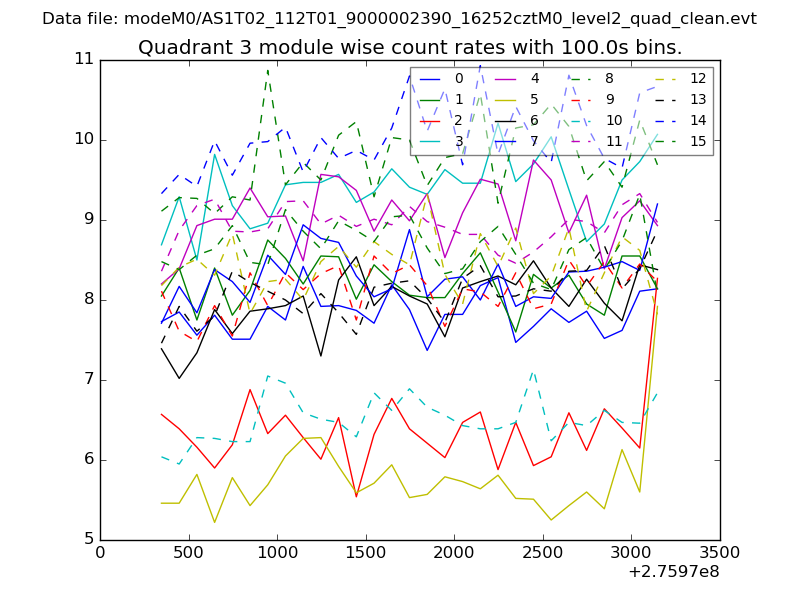
| Module-wise count rates for Quadrant C Data is divided into 100 sec bins |
 |
 |
| Module-wise count rates for Quadrant D Data is divided into 100 sec bins |
 |
 |
| Parameter | Plot |
|---|---|
| CZT HV Monitor | 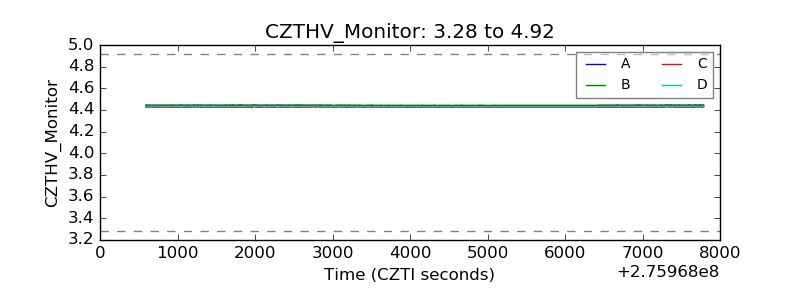 |
| D_VDD | 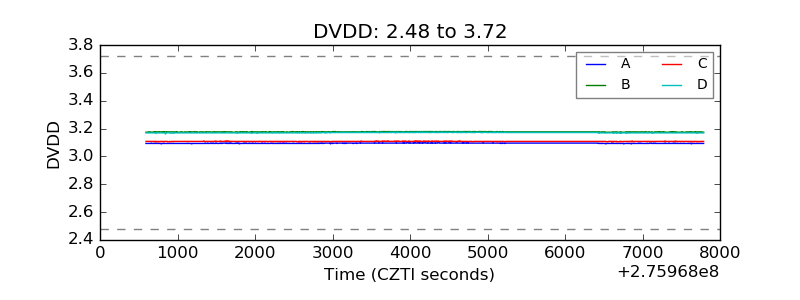 |
| Temperature 1 | 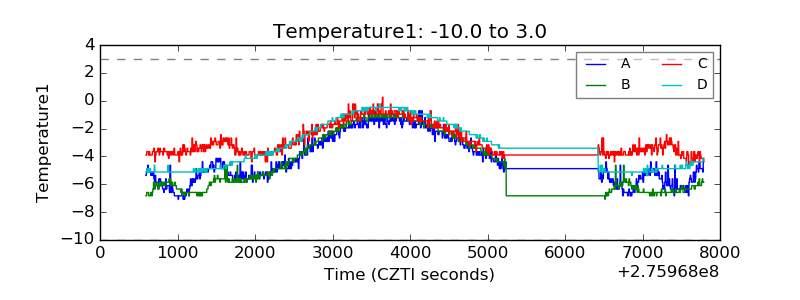 |
| Veto HV Monitor | 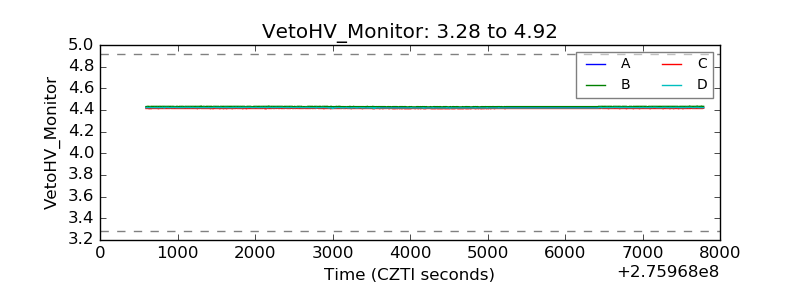 |
| Veto LLD | 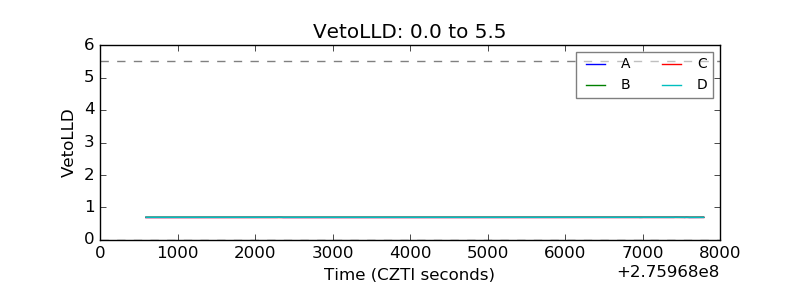 |
| Alpha Counter | 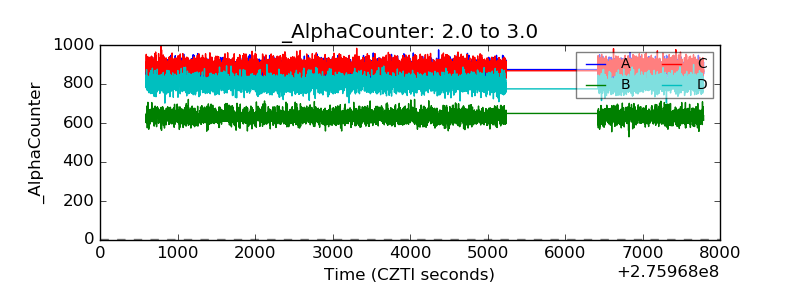 |
| _CPM_Rate | 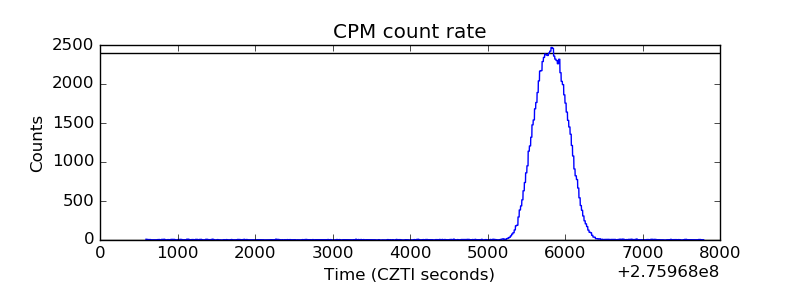 |
| CZT Counter | 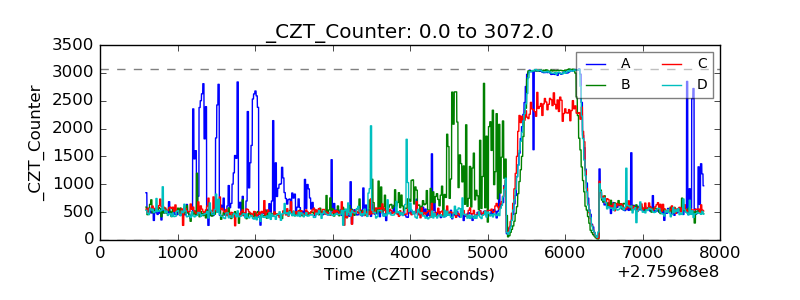 |
| +2.5 Volts monitor |  |
| +5 Volts monitor | 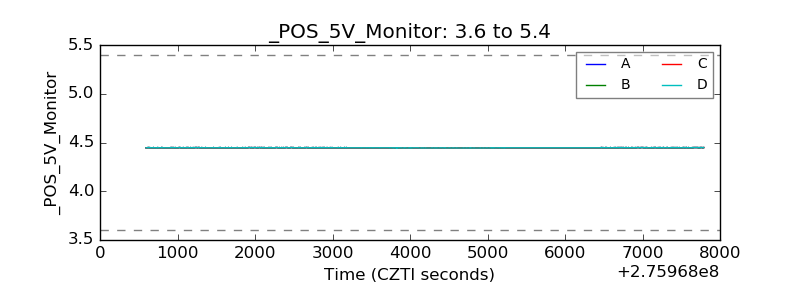 |
| _ROLL_ROT | 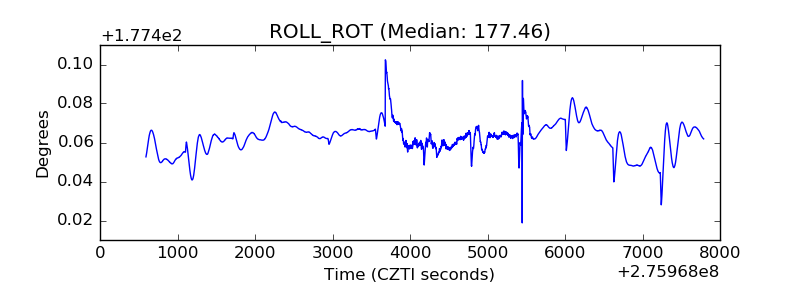 |
| _Roll_DEC | 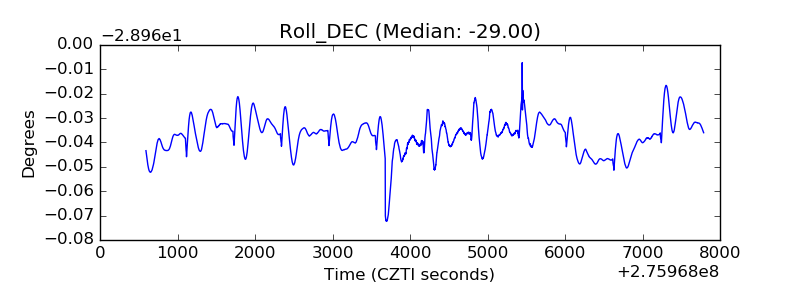 |
| _Roll_RA | 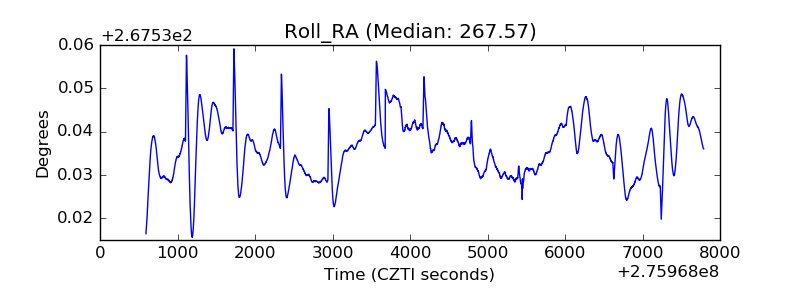 |
| Veto Counter | 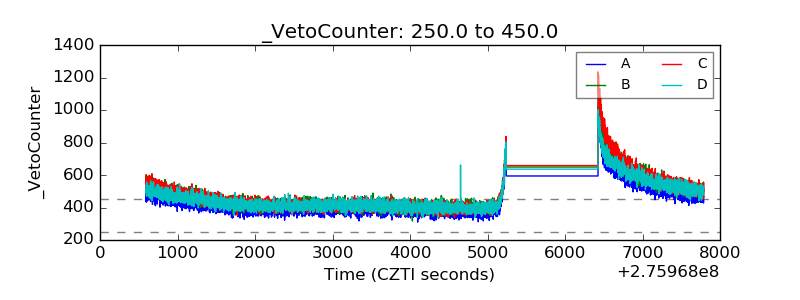 |