| Param | Original file | Final file |
|---|---|---|
| Filename | modeM0/AS1T02_112T01_9000002390_16253cztM0_level2.evt | modeM0/AS1T02_112T01_9000002390_16253cztM0_level2_quad_clean.evt |
| Size (bytes) | 459,633,600 | 74,145,600 |
| Size | 438.3 MB | 70.7 MB |
| Events in quadrant A | 3,617,662 | 454,757 |
| Events in quadrant B | 3,372,492 | 463,691 |
| Events in quadrant C | 3,371,242 | 458,042 |
| Events in quadrant D | 3,151,594 | 449,818 |
| Mode SS | |||
|---|---|---|---|
| Quadrant | BADHDUFLAG | Total packets | Discarded packets |
| A | 0 | 120 | 0 |
| B | 0 | 120 | 0 |
| C | 0 | 120 | 0 |
| D | 0 | 120 | 0 |
| Mode M9 | |||
|---|---|---|---|
| Quadrant | BADHDUFLAG | Total packets | Discarded packets |
| A | 0 | 13 | 0 |
| B | 0 | 13 | 0 |
| C | 0 | 13 | 0 |
| D | 0 | 13 | 0 |
| Mode M0 | |||
|---|---|---|---|
| Quadrant | BADHDUFLAG | Total packets | Discarded packets |
| A | 0 | 14322 | 2 |
| B | 0 | 13618 | 1 |
| C | 0 | 13631 | 1 |
| D | 0 | 12940 | 1 |
| Quadrant | Total seconds | Saturated seconds | Saturation percentage |
|---|---|---|---|
| A | 6001 | 188 | 3.132811% |
| B | 6001 | 86 | 1.433094% |
| C | 6001 | 117 | 1.949675% |
| D | 6001 | 55 | 0.916514% |
Noise dominated data is calculated using 1-second bins in cleaned event files. If a bin has >2000 counts, and if more than 50% of those come from <1% of pixels, then it is considered to be noise-dominated and hence unusable.
| Quadrant | # 1 sec bins | Bins with >0 counts | Bins with >2000 counts | High rate bins dominated by noise | Noise dominated (total time) | Noise dominated (detector-on time) | Marked lightcurve |
|---|---|---|---|---|---|---|---|
| A | 7277 | 6003 | 98 | 98 | 1.35% | 1.63% | 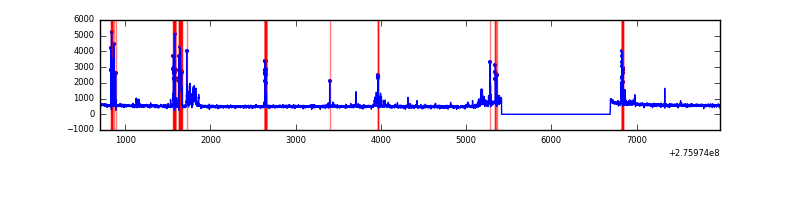 |
| B | 7277 | 6003 | 7 | 7 | 0.10% | 0.12% | 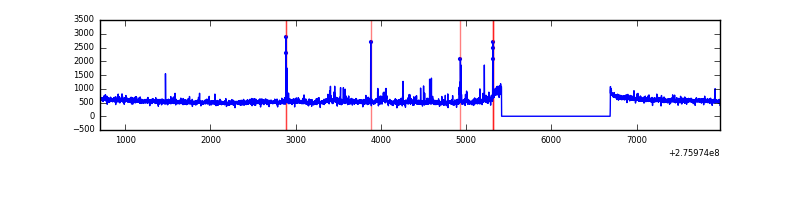 |
| C | 7277 | 6003 | 1 | 1 | 0.01% | 0.02% | 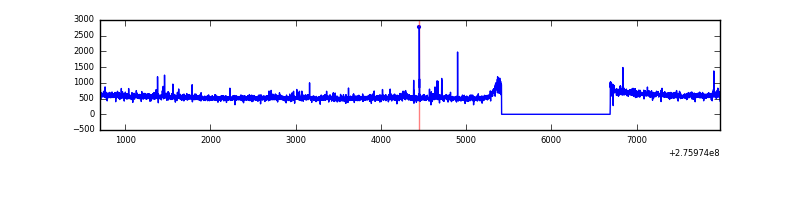 |
| D | 7277 | 6003 | 2 | 2 | 0.03% | 0.03% | 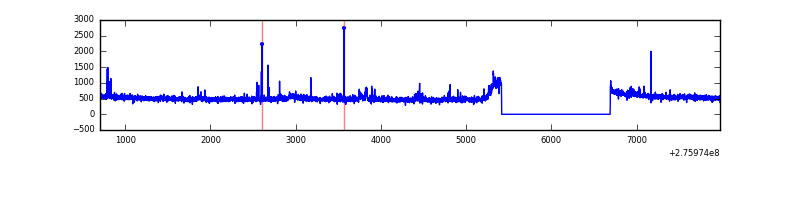 |
Top three noisy pixels from each quadrant. If the there are fewer than three noisy pixels in the level2.evt file, extra rows are filled as -1
| Pixel properties | Quadrant properties | ||||||
|---|---|---|---|---|---|---|---|
| Quadrant | DetID | PixID | Counts | Sigma | Mean | Median | Sigma |
| A | 15 | 174 | 463173 | 2901.95 | 808 | 796 | 159.3 |
| A | 9 | 143 | 33259 | 203.74 | 808 | 796 | 159.3 |
| A | 3 | 1 | 13038 | 76.83 | 808 | 796 | 159.3 |
| B | 0 | 198 | 40071 | 257.07 | 815 | 799 | 152.8 |
| B | 0 | 189 | 39196 | 251.34 | 815 | 799 | 152.8 |
| B | 4 | 216 | 29538 | 188.12 | 815 | 799 | 152.8 |
| C | 3 | 233 | 131613 | 728.41 | 787 | 795 | 179.6 |
| C | 14 | 238 | 124771 | 690.31 | 787 | 795 | 179.6 |
| C | 0 | 207 | 35848 | 195.18 | 787 | 795 | 179.6 |
| D | 1 | 52 | 56561 | 292.45 | 799 | 778 | 190.7 |
| D | 15 | 0 | 30773 | 157.25 | 799 | 778 | 190.7 |
| D | 2 | 234 | 19901 | 100.25 | 799 | 778 | 190.7 |
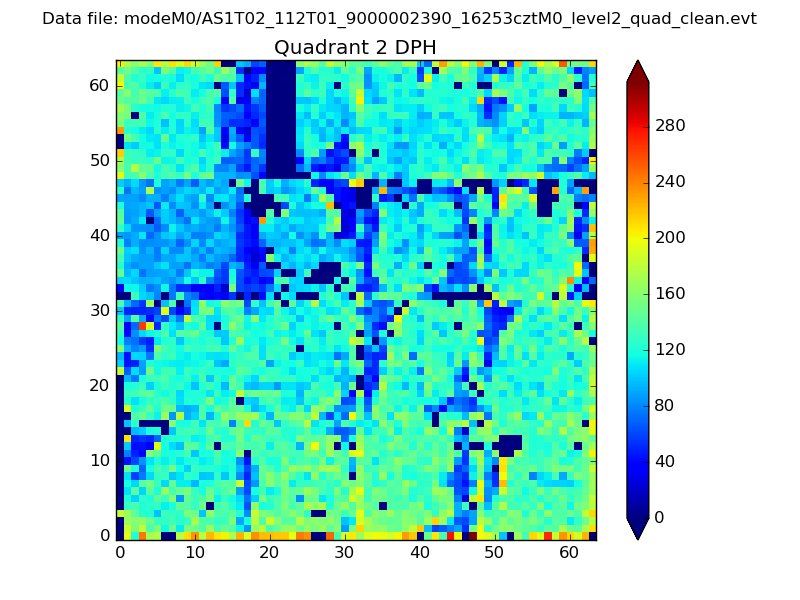
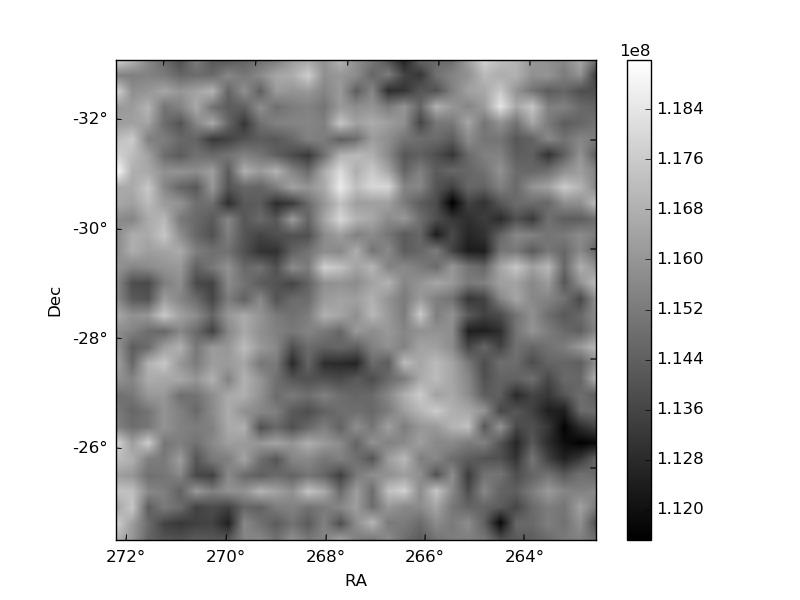
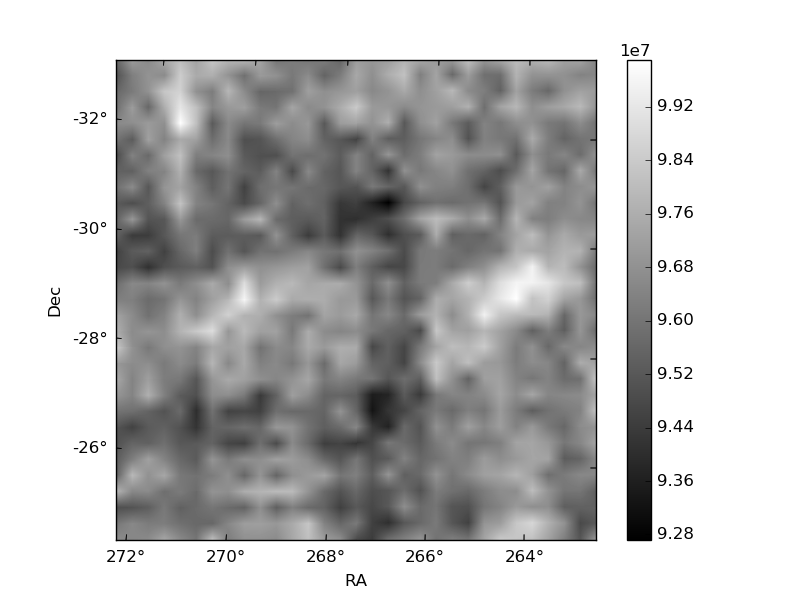
Histogram calculated using DETX and DETY for each event in the final _common_clean file
| Quadrant A | 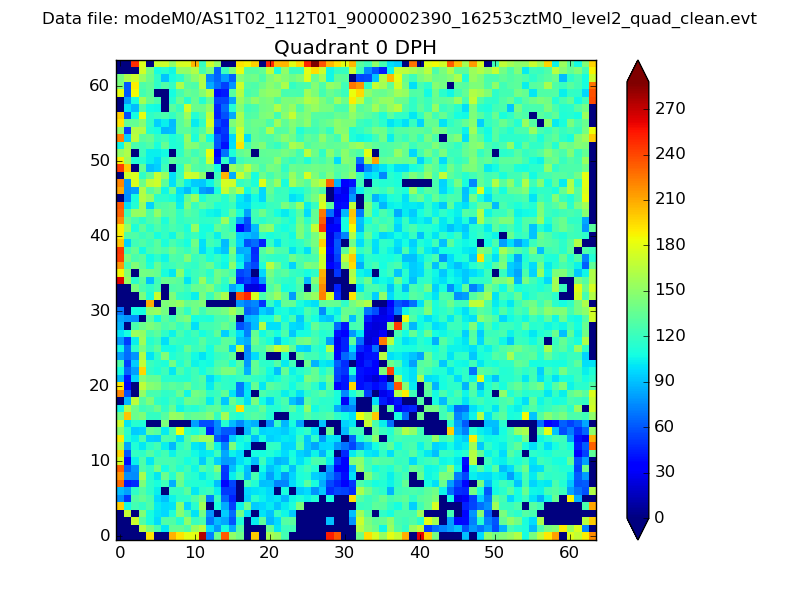 |
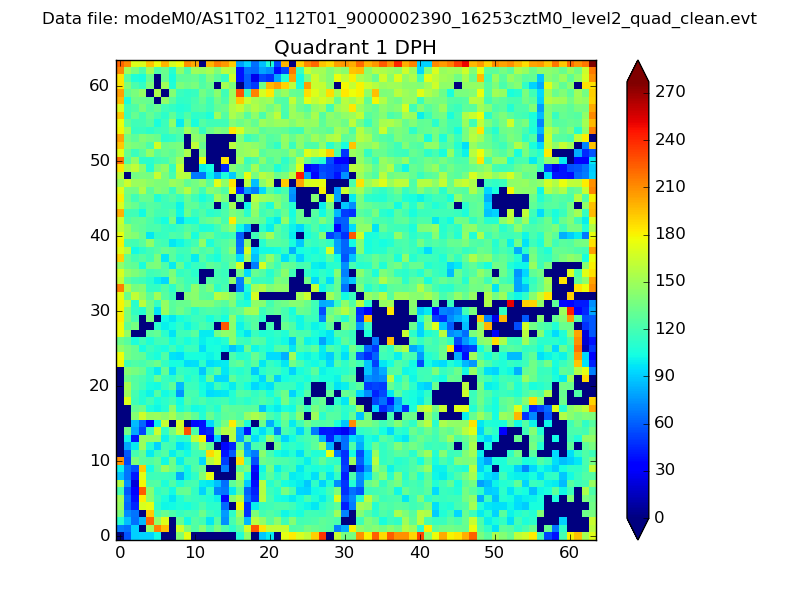 |
Quadrant B |
|---|---|---|---|
| Quadrant D | 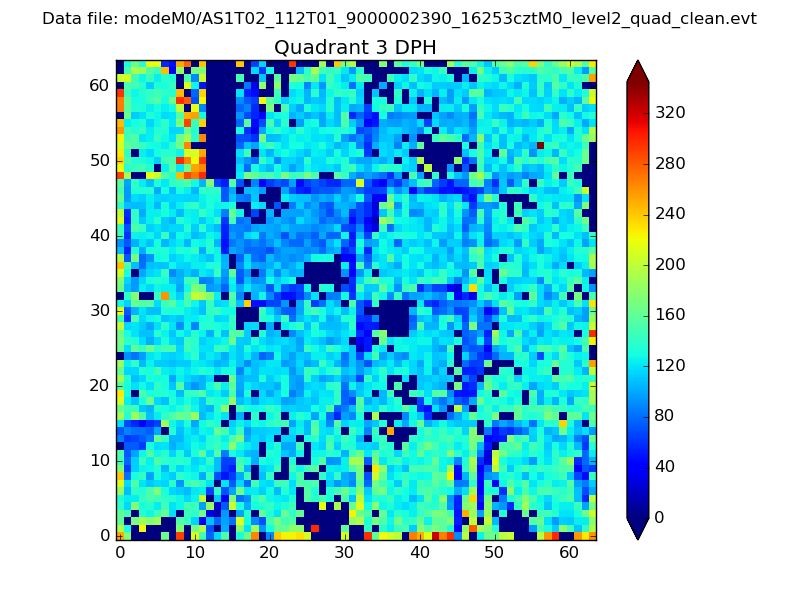 |
 |
Quadrant C |
| Plot type | Count rate plots | Images |
|---|---|---|
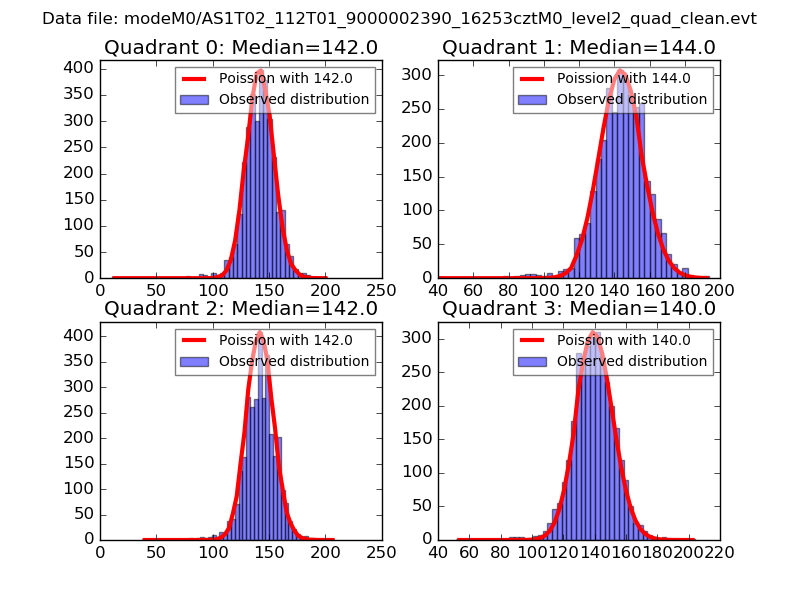
| Comparison with Poisson distribution Blue bars denote a histogram of data divided into 1 sec bins. Red curve is a Poisson curve with rate = median count rate of data. |
 |
 |
| Quadrant-wise count rates Data is divided into 100 sec bins |
 |
|
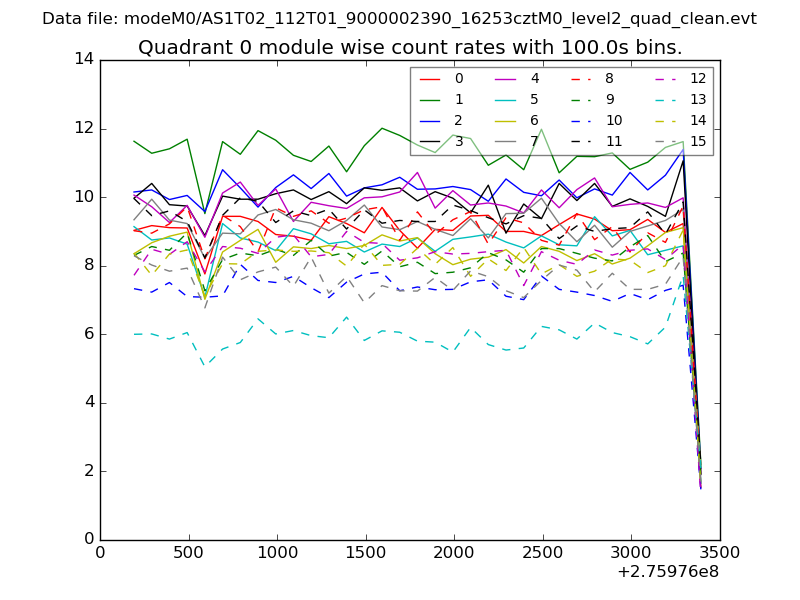
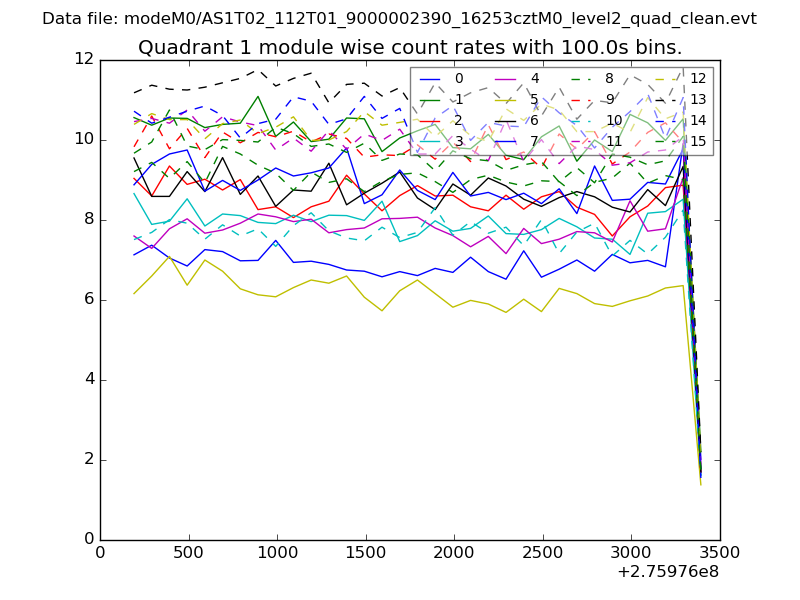
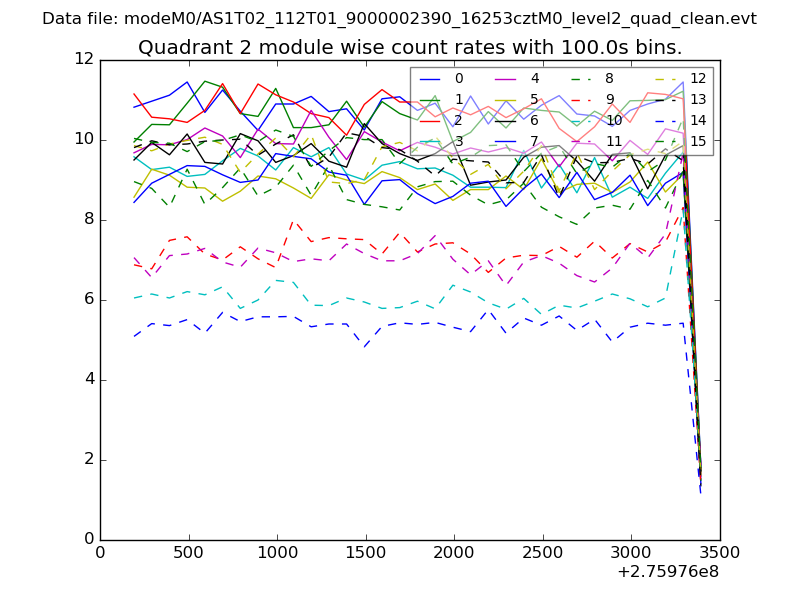
| Module-wise count rates for Quadrant A Data is divided into 100 sec bins |
 |
 |
| Module-wise count rates for Quadrant B Data is divided into 100 sec bins |
 |
 |
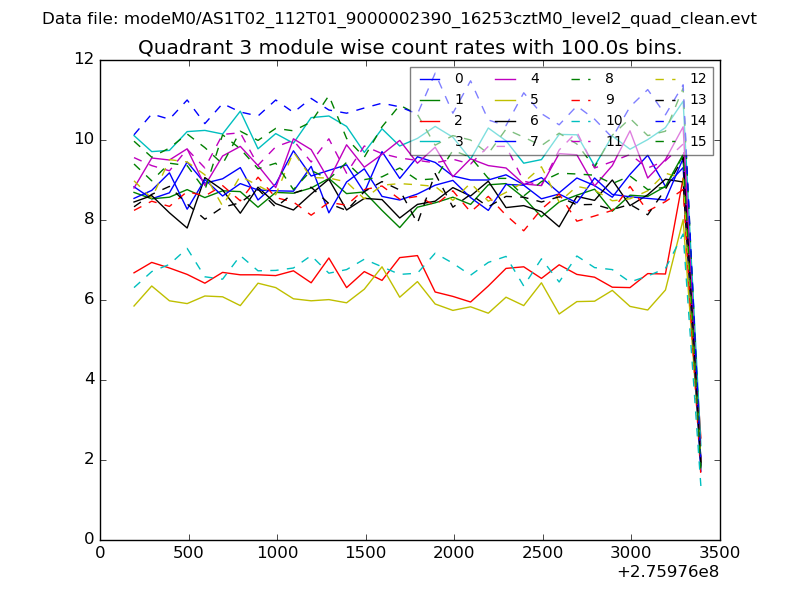
| Module-wise count rates for Quadrant C Data is divided into 100 sec bins |
 |
 |
| Module-wise count rates for Quadrant D Data is divided into 100 sec bins |
 |
 |
| Parameter | Plot |
|---|---|
| CZT HV Monitor | 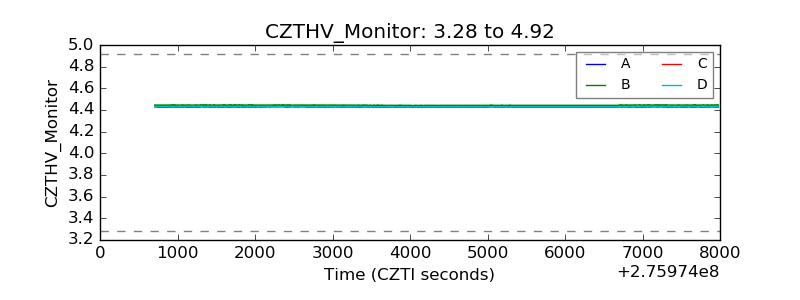 |
| D_VDD | 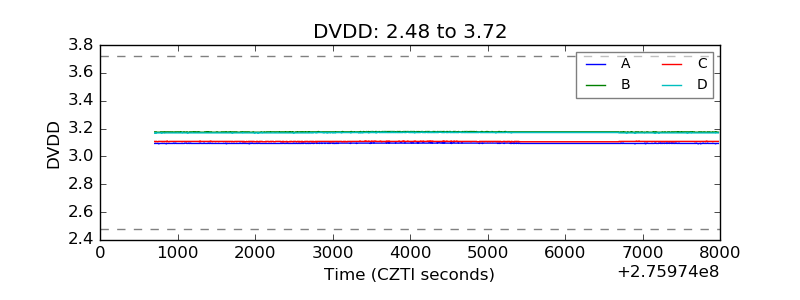 |
| Temperature 1 | 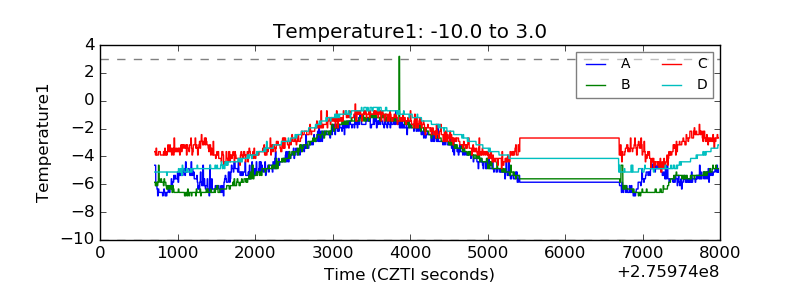 |
| Veto HV Monitor | 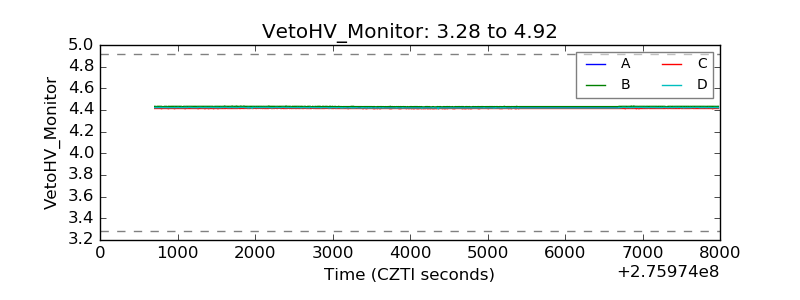 |
| Veto LLD | 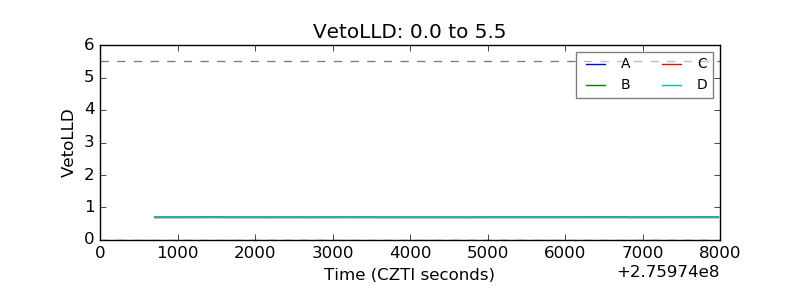 |
| Alpha Counter | 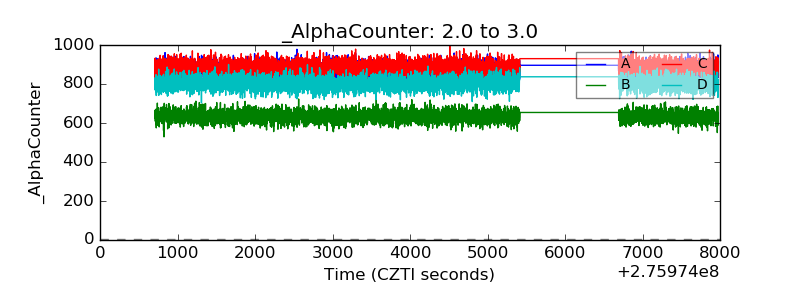 |
| _CPM_Rate | 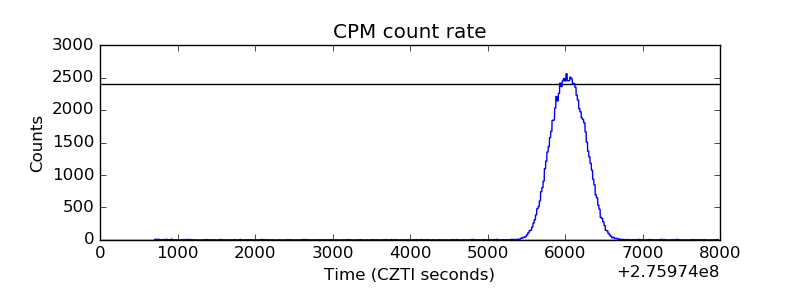 |
| CZT Counter |  |
| +2.5 Volts monitor |  |
| +5 Volts monitor |  |
| _ROLL_ROT | 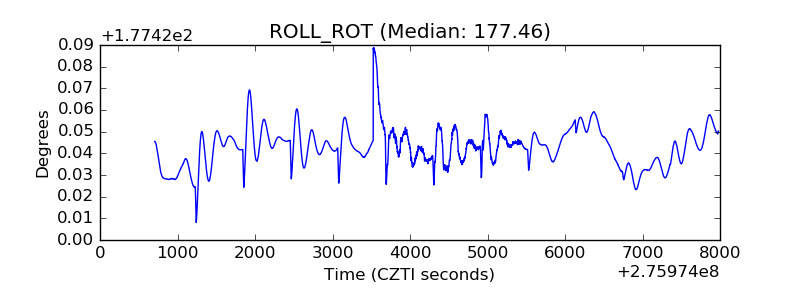 |
| _Roll_DEC | 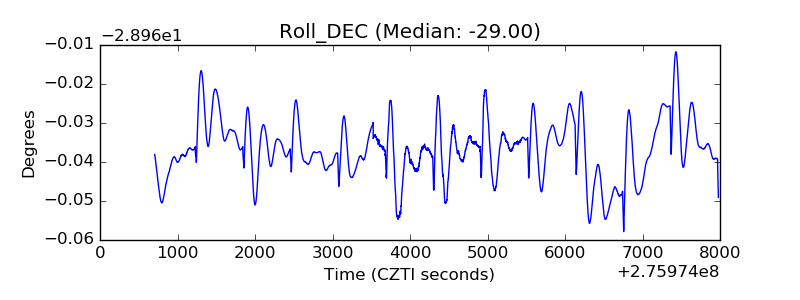 |
| _Roll_RA | 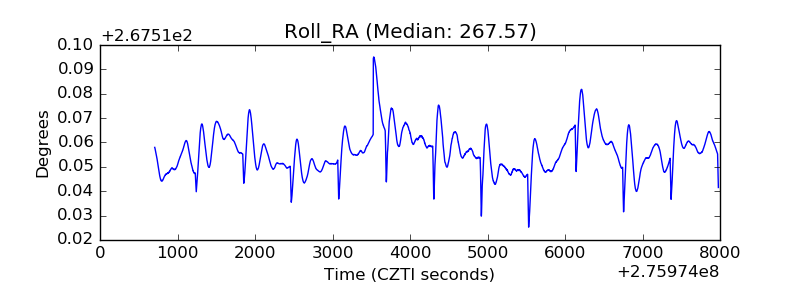 |
| Veto Counter | 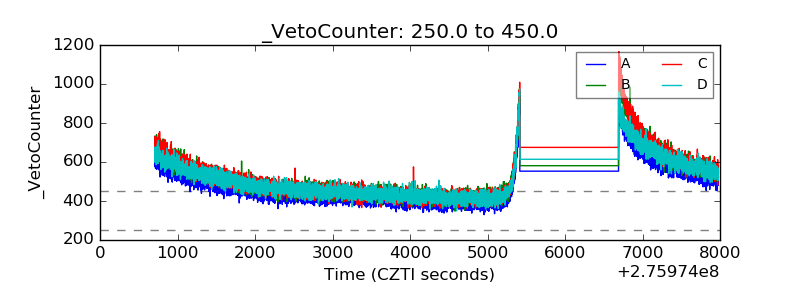 |