| Param | Original file | Final file |
|---|---|---|
| Filename | modeM0/AS1T02_112T01_9000002390_16254cztM0_level2.evt | modeM0/AS1T02_112T01_9000002390_16254cztM0_level2_quad_clean.evt |
| Size (bytes) | 488,854,080 | 91,031,040 |
| Size | 466.2 MB | 86.8 MB |
| Events in quadrant A | 3,675,251 | 583,709 |
| Events in quadrant B | 3,714,169 | 589,638 |
| Events in quadrant C | 3,610,991 | 580,469 |
| Events in quadrant D | 3,384,338 | 570,570 |
| Mode SS | |||
|---|---|---|---|
| Quadrant | BADHDUFLAG | Total packets | Discarded packets |
| A | 0 | 126 | 0 |
| B | 0 | 126 | 0 |
| C | 0 | 126 | 0 |
| D | 0 | 126 | 0 |
| Mode M9 | |||
|---|---|---|---|
| Quadrant | BADHDUFLAG | Total packets | Discarded packets |
| A | 0 | 21 | 0 |
| B | 0 | 21 | 0 |
| C | 0 | 21 | 0 |
| D | 0 | 22 | 0 |
| Mode M0 | |||
|---|---|---|---|
| Quadrant | BADHDUFLAG | Total packets | Discarded packets |
| A | 0 | 14733 | 3 |
| B | 0 | 14938 | 2 |
| C | 0 | 14697 | 2 |
| D | 0 | 13773 | 2 |
| Quadrant | Total seconds | Saturated seconds | Saturation percentage |
|---|---|---|---|
| A | 6193 | 140 | 2.260617% |
| B | 6193 | 123 | 1.986113% |
| C | 6193 | 154 | 2.486679% |
| D | 6193 | 90 | 1.453254% |
Noise dominated data is calculated using 1-second bins in cleaned event files. If a bin has >2000 counts, and if more than 50% of those come from <1% of pixels, then it is considered to be noise-dominated and hence unusable.
| Quadrant | # 1 sec bins | Bins with >0 counts | Bins with >2000 counts | High rate bins dominated by noise | Noise dominated (total time) | Noise dominated (detector-on time) | Marked lightcurve |
|---|---|---|---|---|---|---|---|
| A | 7519 | 6195 | 36 | 36 | 0.48% | 0.58% | 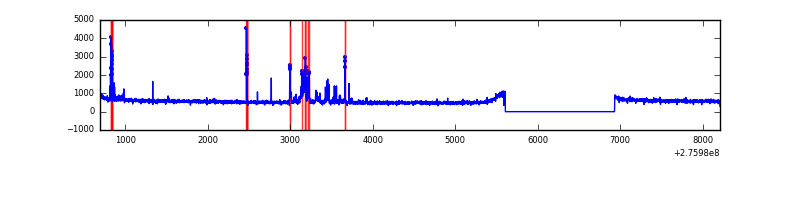 |
| B | 7519 | 6195 | 14 | 14 | 0.19% | 0.23% | 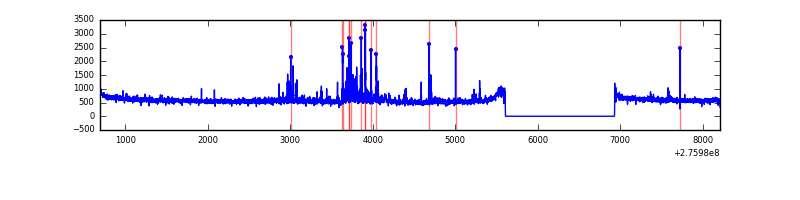 |
| C | 7519 | 6195 | 5 | 5 | 0.07% | 0.08% | 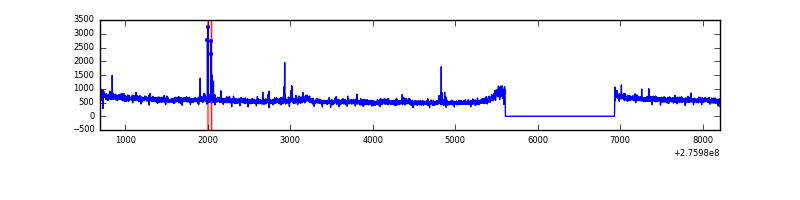 |
| D | 7519 | 6195 | 8 | 8 | 0.11% | 0.13% | 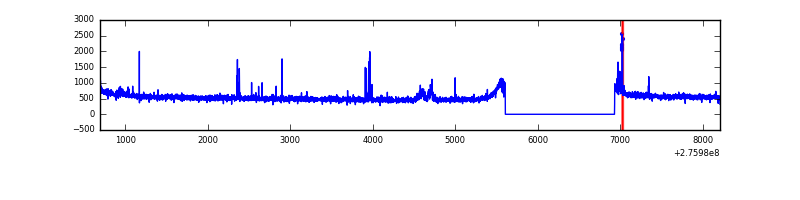 |
Top three noisy pixels from each quadrant. If the there are fewer than three noisy pixels in the level2.evt file, extra rows are filled as -1
| Pixel properties | Quadrant properties | ||||||
|---|---|---|---|---|---|---|---|
| Quadrant | DetID | PixID | Counts | Sigma | Mean | Median | Sigma |
| A | 15 | 174 | 282406 | 1612.9 | 879 | 865 | 174.6 |
| A | 3 | 1 | 10943 | 57.74 | 879 | 865 | 174.6 |
| A | 0 | 226 | 7903 | 40.32 | 879 | 865 | 174.6 |
| B | 7 | 220 | 128140 | 792.0 | 871 | 854 | 160.7 |
| B | 0 | 198 | 60284 | 369.78 | 871 | 854 | 160.7 |
| B | 3 | 209 | 31504 | 190.71 | 871 | 854 | 160.7 |
| C | 14 | 238 | 132158 | 685.89 | 843 | 854 | 191.4 |
| C | 3 | 233 | 119532 | 619.94 | 843 | 854 | 191.4 |
| C | 0 | 207 | 70035 | 361.38 | 843 | 854 | 191.4 |
| D | 15 | 0 | 46388 | 223.58 | 861 | 841 | 203.7 |
| D | 1 | 52 | 39230 | 188.44 | 861 | 841 | 203.7 |
| D | 2 | 234 | 21068 | 99.29 | 861 | 841 | 203.7 |
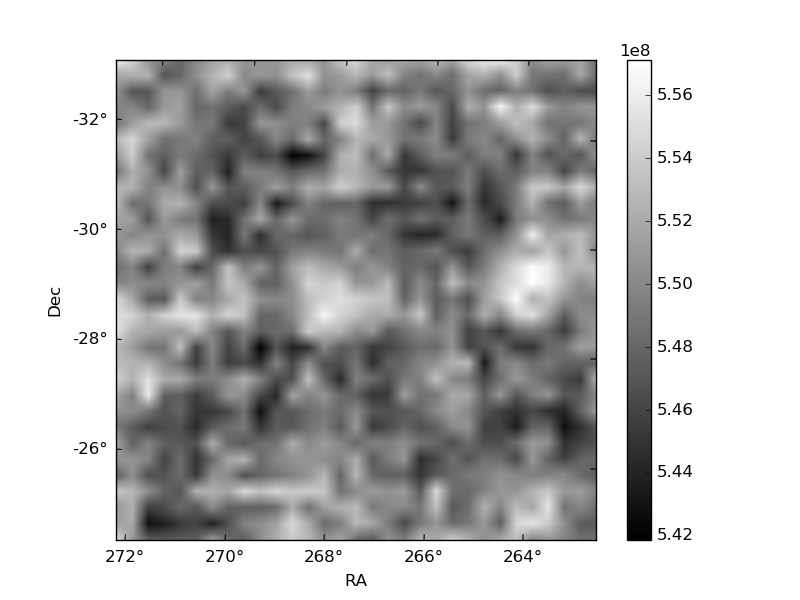
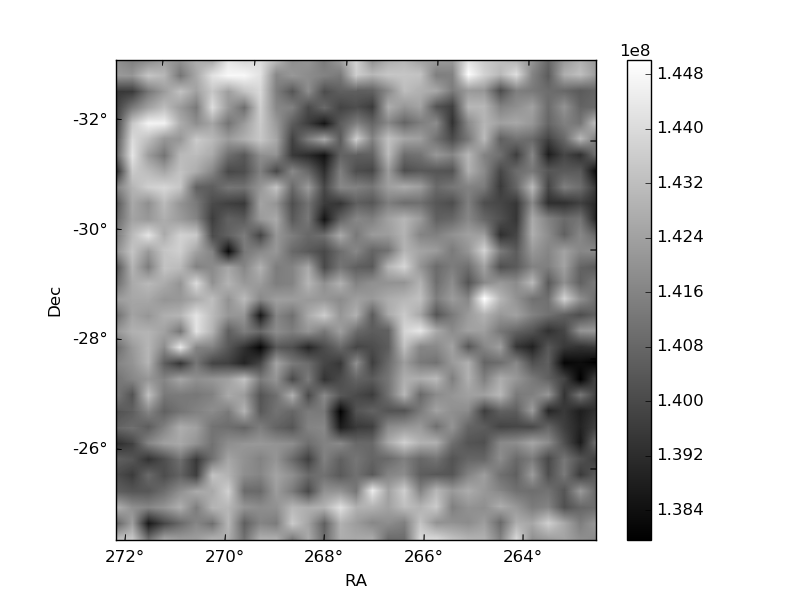
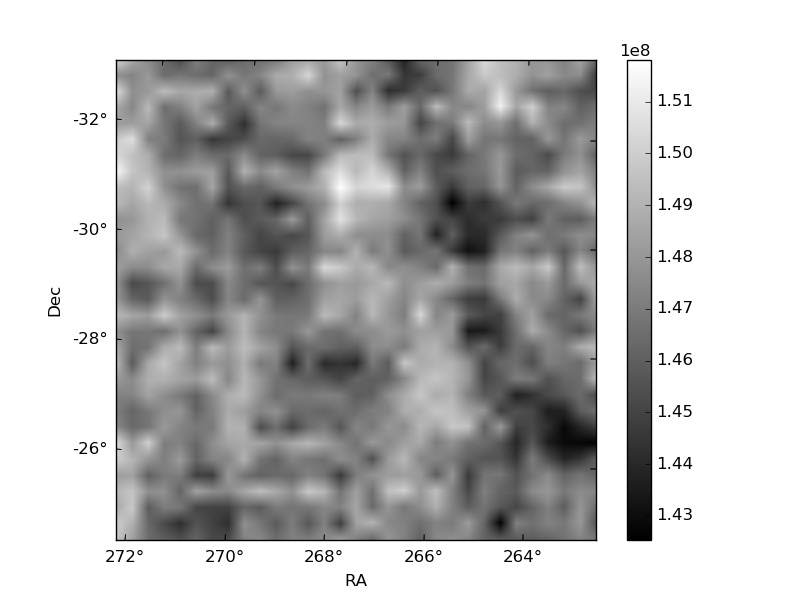
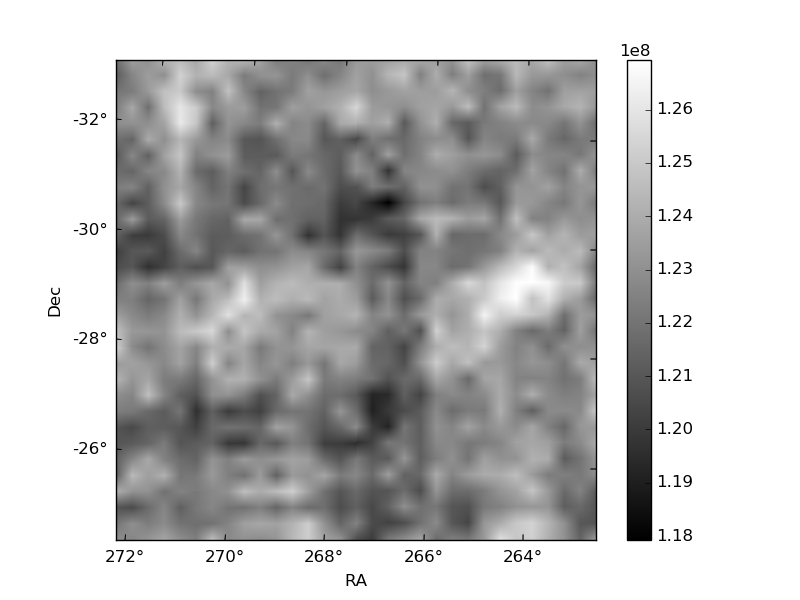
Histogram calculated using DETX and DETY for each event in the final _common_clean file
| Quadrant A |  |
 |
Quadrant B |
|---|---|---|---|
| Quadrant D |  |
 |
Quadrant C |
| Plot type | Count rate plots | Images |
|---|---|---|
| Comparison with Poisson distribution Blue bars denote a histogram of data divided into 1 sec bins. Red curve is a Poisson curve with rate = median count rate of data. |
 |
 |
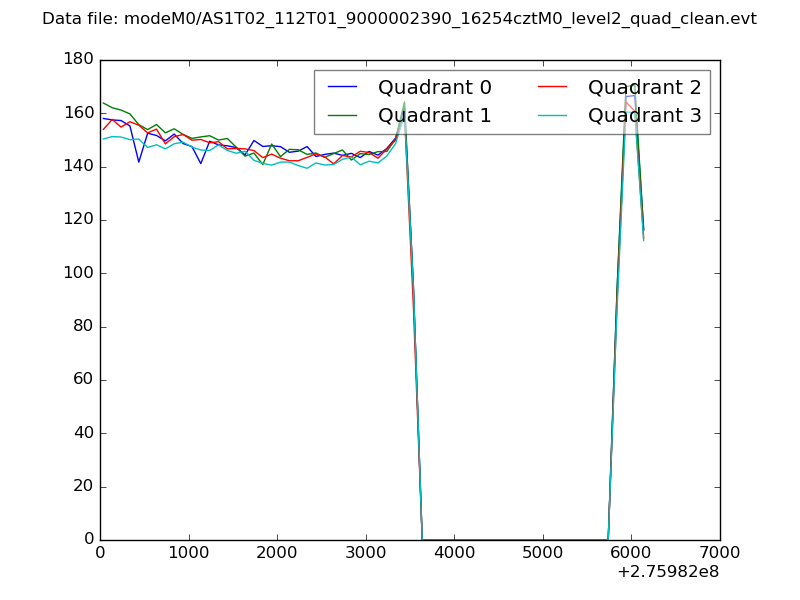
| Quadrant-wise count rates Data is divided into 100 sec bins |
 |
|
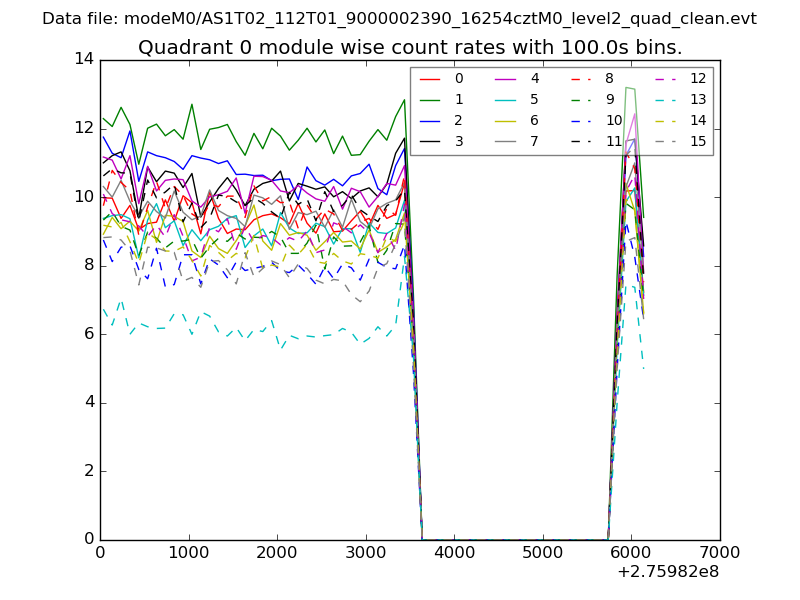
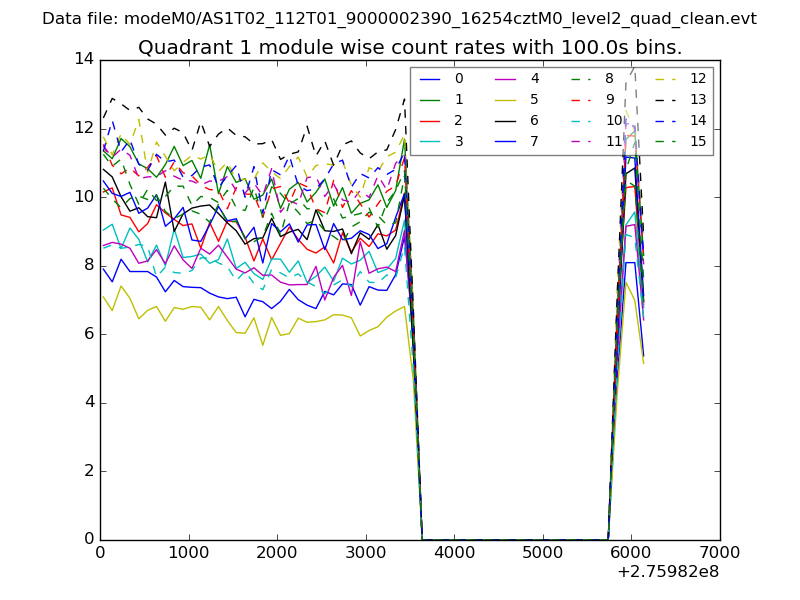
| Module-wise count rates for Quadrant A Data is divided into 100 sec bins |
 |
 |
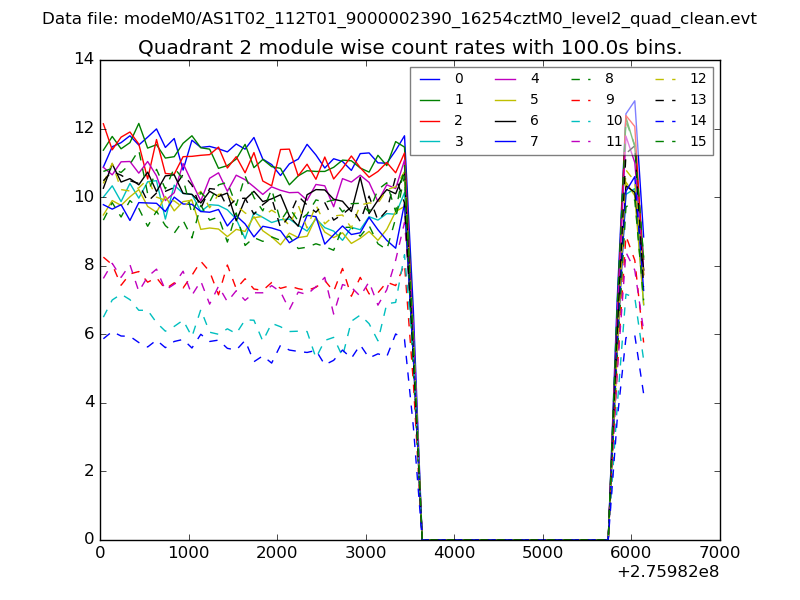
| Module-wise count rates for Quadrant B Data is divided into 100 sec bins |
 |
 |
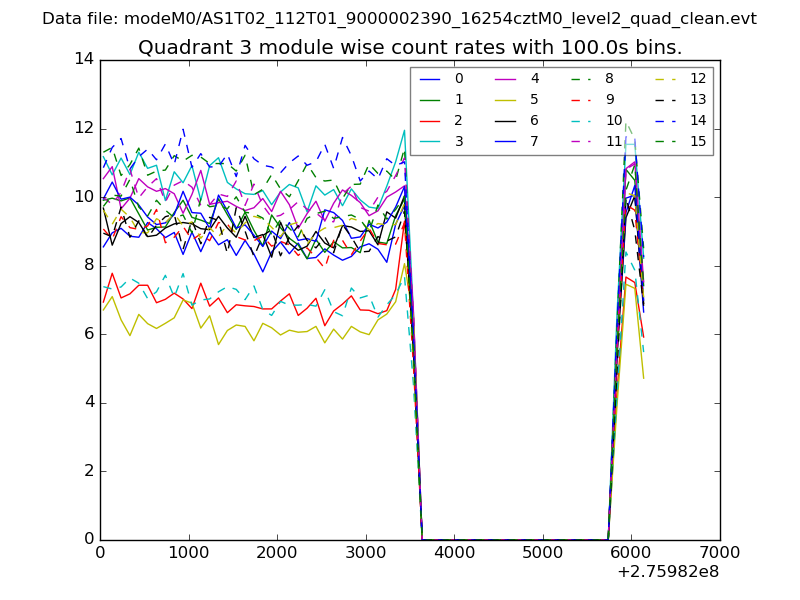
| Module-wise count rates for Quadrant C Data is divided into 100 sec bins |
 |
 |
| Module-wise count rates for Quadrant D Data is divided into 100 sec bins |
 |
 |
| Parameter | Plot |
|---|---|
| CZT HV Monitor | 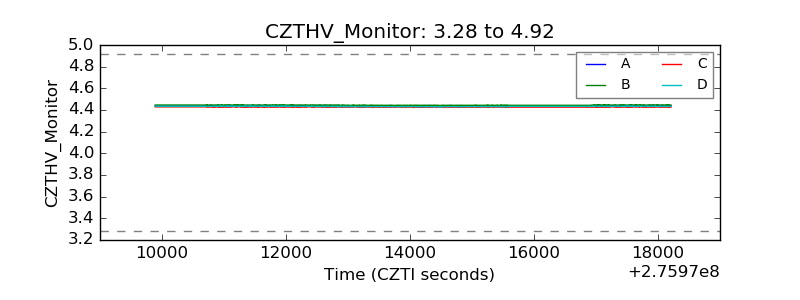 |
| D_VDD | 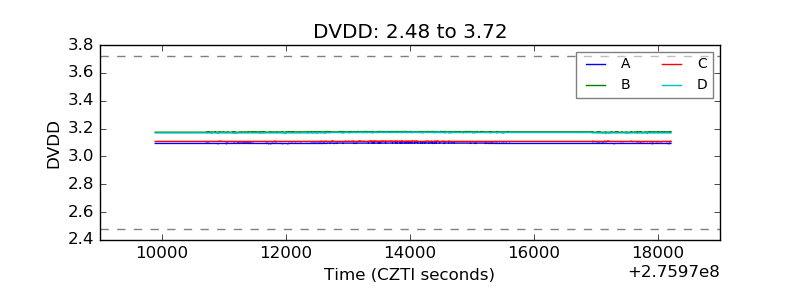 |
| Temperature 1 | 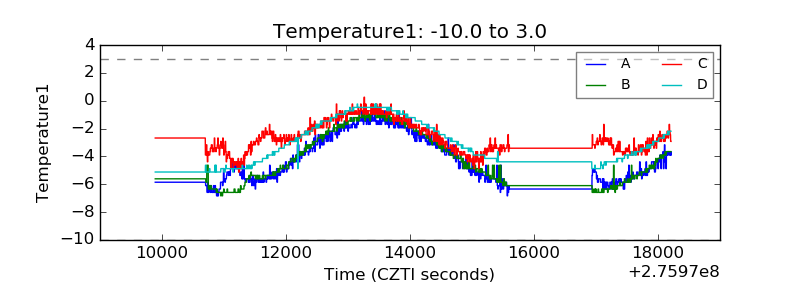 |
| Veto HV Monitor |  |
| Veto LLD | 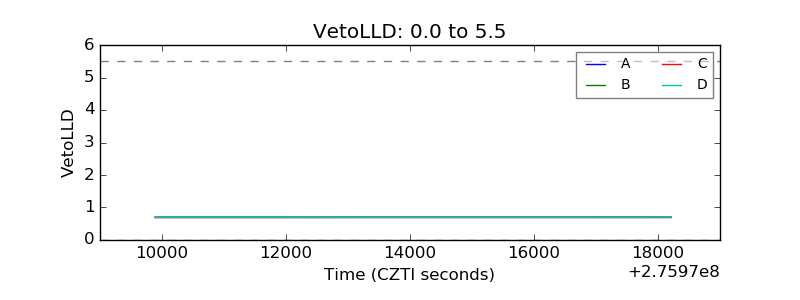 |
| Alpha Counter | 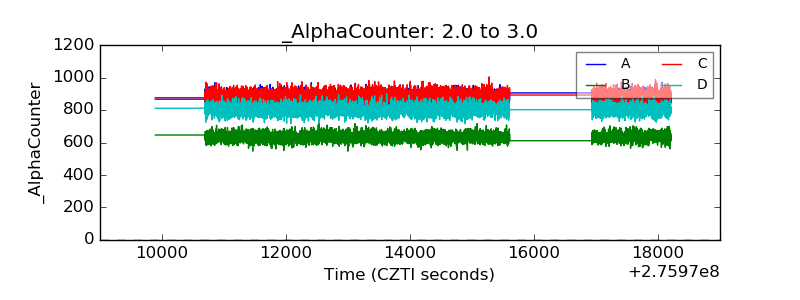 |
| _CPM_Rate | 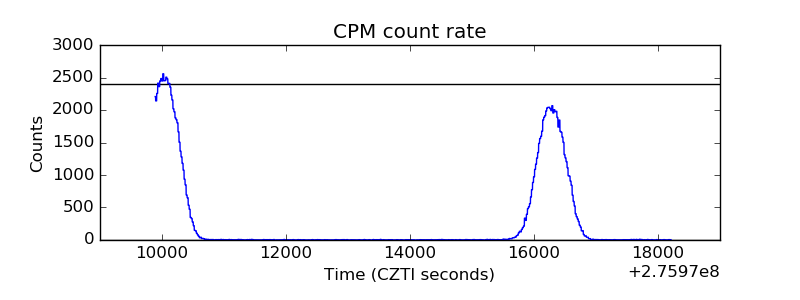 |
| CZT Counter | 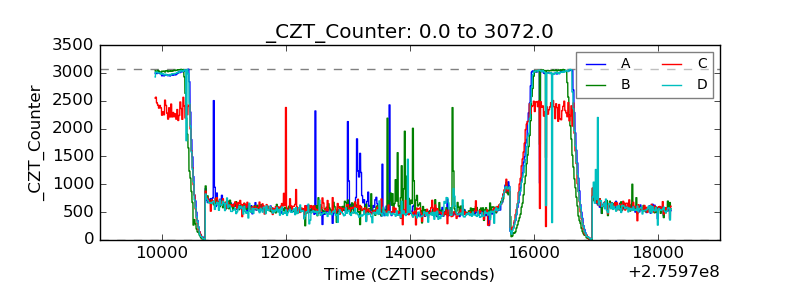 |
| +2.5 Volts monitor |  |
| +5 Volts monitor | 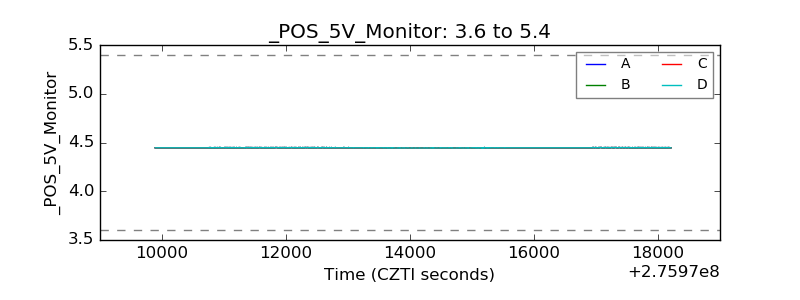 |
| _ROLL_ROT | 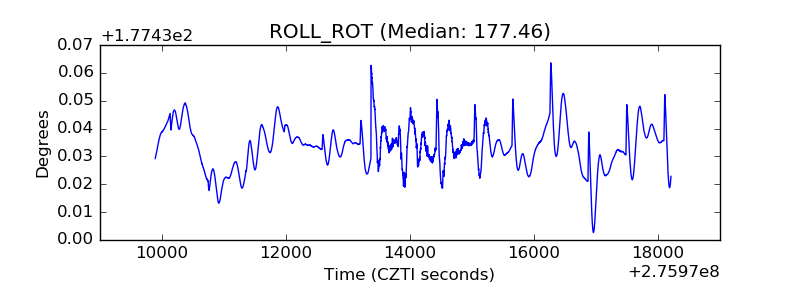 |
| _Roll_DEC | 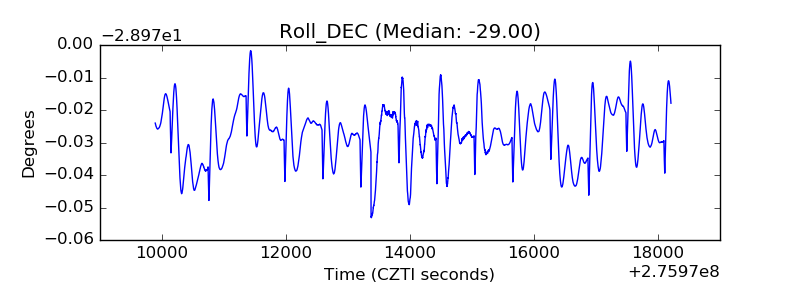 |
| _Roll_RA | 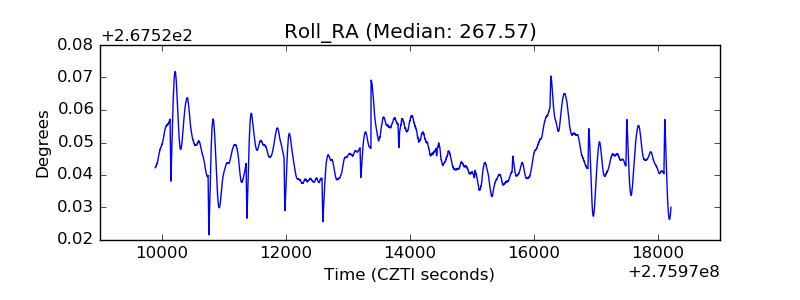 |
| Veto Counter | 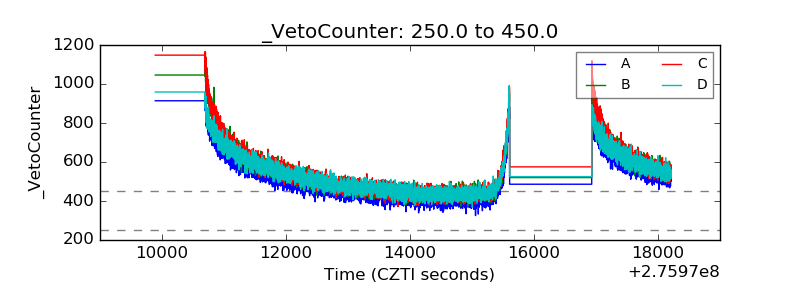 |