| Param | Original file | Final file |
|---|---|---|
| Filename | modeM0/AS1T02_112T01_9000002390_16258cztM0_level2.evt | modeM0/AS1T02_112T01_9000002390_16258cztM0_level2_quad_clean.evt |
| Size (bytes) | 535,541,760 | 99,060,480 |
| Size | 510.7 MB | 94.5 MB |
| Events in quadrant A | 3,496,517 | 635,736 |
| Events in quadrant B | 3,952,475 | 638,201 |
| Events in quadrant C | 3,568,353 | 632,351 |
| Events in quadrant D | 4,728,850 | 608,071 |
| Mode SS | |||
|---|---|---|---|
| Quadrant | BADHDUFLAG | Total packets | Discarded packets |
| A | 0 | 142 | 0 |
| B | 0 | 142 | 0 |
| C | 0 | 142 | 0 |
| D | 0 | 142 | 0 |
| Mode M9 | |||
|---|---|---|---|
| Quadrant | BADHDUFLAG | Total packets | Discarded packets |
| A | 0 | 4 | 0 |
| B | 0 | 4 | 0 |
| C | 0 | 4 | 0 |
| D | 0 | 4 | 0 |
| Mode M0 | |||
|---|---|---|---|
| Quadrant | BADHDUFLAG | Total packets | Discarded packets |
| A | 0 | 14865 | 2 |
| B | 0 | 16141 | 1 |
| C | 0 | 14877 | 1 |
| D | 0 | 18904 | 1 |
| Quadrant | Total seconds | Saturated seconds | Saturation percentage |
|---|---|---|---|
| A | 6971 | 68 | 0.975470% |
| B | 6971 | 104 | 1.491895% |
| C | 6971 | 93 | 1.334098% |
| D | 6971 | 147 | 2.108736% |
Noise dominated data is calculated using 1-second bins in cleaned event files. If a bin has >2000 counts, and if more than 50% of those come from <1% of pixels, then it is considered to be noise-dominated and hence unusable.
| Quadrant | # 1 sec bins | Bins with >0 counts | Bins with >2000 counts | High rate bins dominated by noise | Noise dominated (total time) | Noise dominated (detector-on time) | Marked lightcurve |
|---|---|---|---|---|---|---|---|
| A | 7427 | 6973 | 29 | 29 | 0.39% | 0.42% | 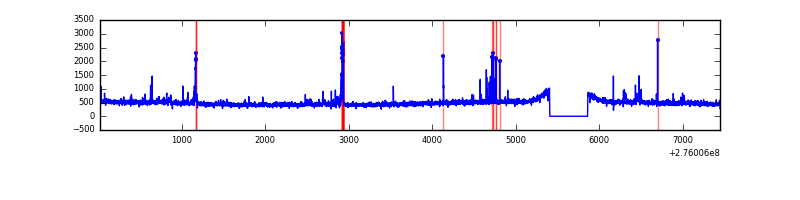 |
| B | 7427 | 6973 | 27 | 27 | 0.36% | 0.39% | 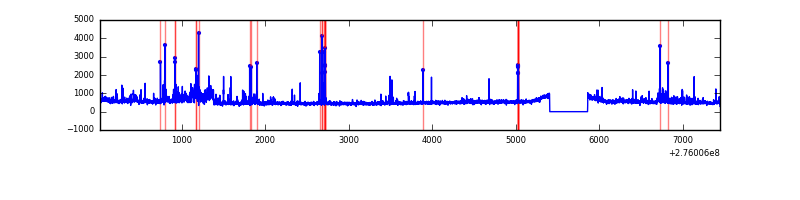 |
| C | 7427 | 6973 | 3 | 3 | 0.04% | 0.04% | 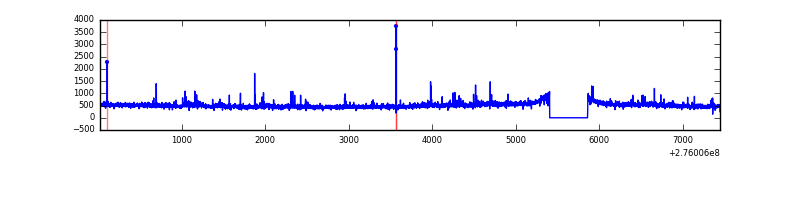 |
| D | 7427 | 6973 | 76 | 76 | 1.02% | 1.09% | 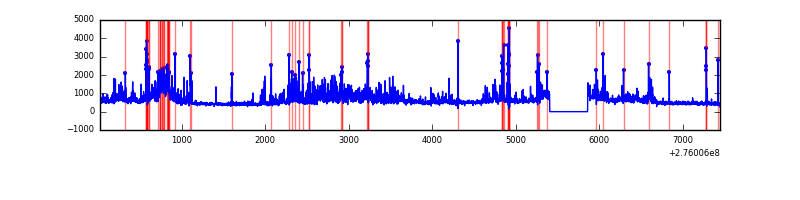 |
Top three noisy pixels from each quadrant. If the there are fewer than three noisy pixels in the level2.evt file, extra rows are filled as -1
| Pixel properties | Quadrant properties | ||||||
|---|---|---|---|---|---|---|---|
| Quadrant | DetID | PixID | Counts | Sigma | Mean | Median | Sigma |
| A | 15 | 174 | 162726 | 926.01 | 861 | 844 | 174.8 |
| A | 9 | 143 | 14960 | 80.74 | 861 | 844 | 174.8 |
| A | 0 | 226 | 7708 | 39.26 | 861 | 844 | 174.8 |
| B | 7 | 220 | 203610 | 1230.65 | 855 | 835 | 164.8 |
| B | 4 | 216 | 104692 | 630.31 | 855 | 835 | 164.8 |
| B | 0 | 189 | 60254 | 360.62 | 855 | 835 | 164.8 |
| C | 3 | 233 | 140114 | 726.63 | 820 | 826 | 191.7 |
| C | 14 | 238 | 128265 | 664.81 | 820 | 826 | 191.7 |
| C | 7 | 247 | 53259 | 273.53 | 820 | 826 | 191.7 |
| D | 1 | 52 | 1354907 | 6649.56 | 831 | 808 | 203.6 |
| D | 12 | 233 | 97507 | 474.86 | 831 | 808 | 203.6 |
| D | 10 | 70 | 66449 | 322.34 | 831 | 808 | 203.6 |
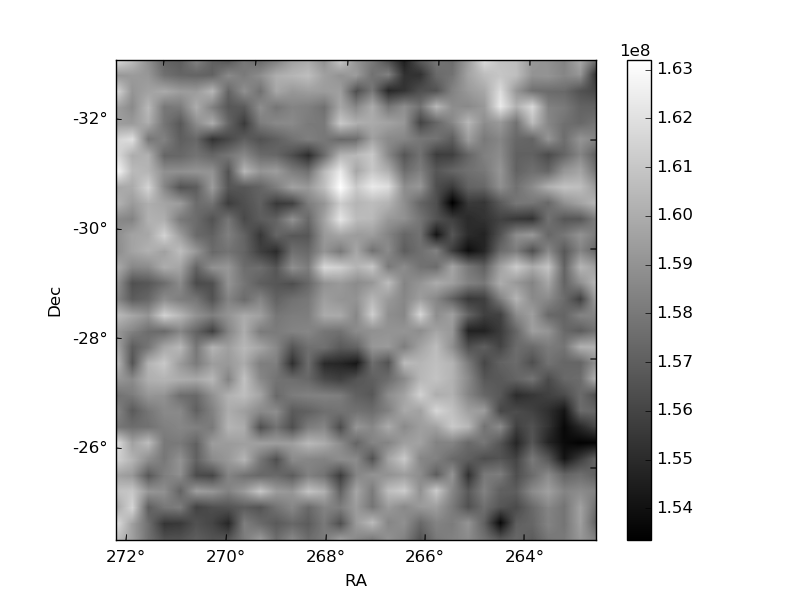
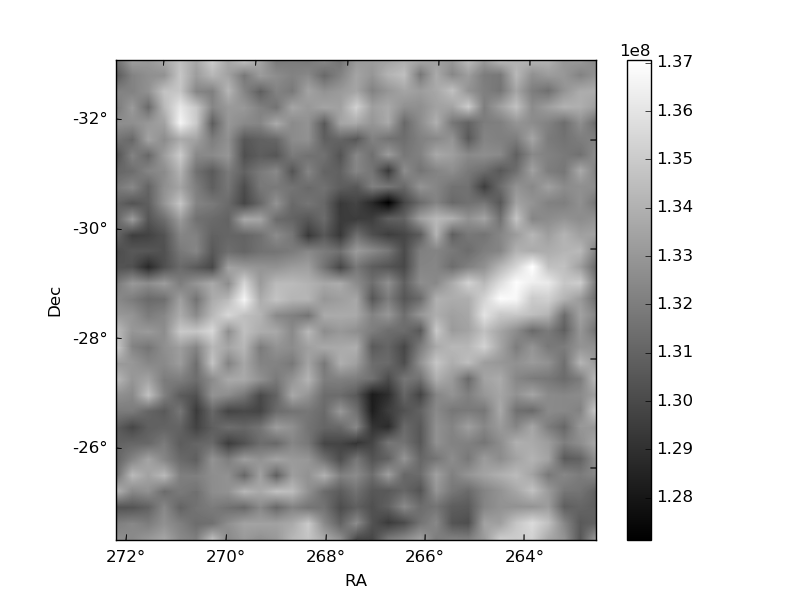
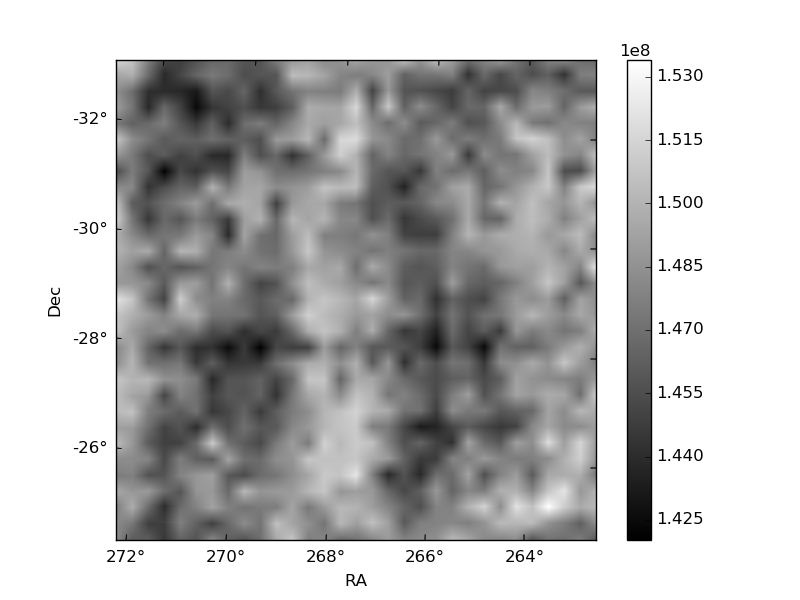
Histogram calculated using DETX and DETY for each event in the final _common_clean file
| Quadrant A | 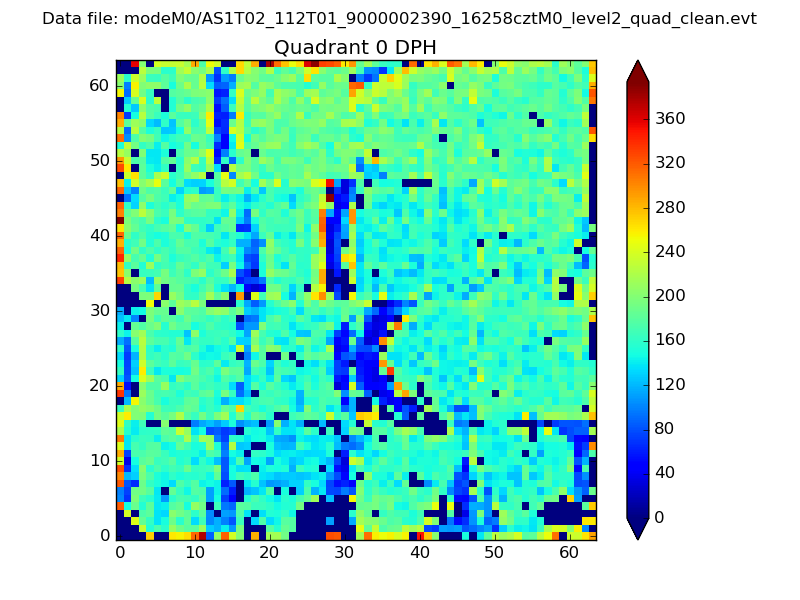 |
 |
Quadrant B |
|---|---|---|---|
| Quadrant D | 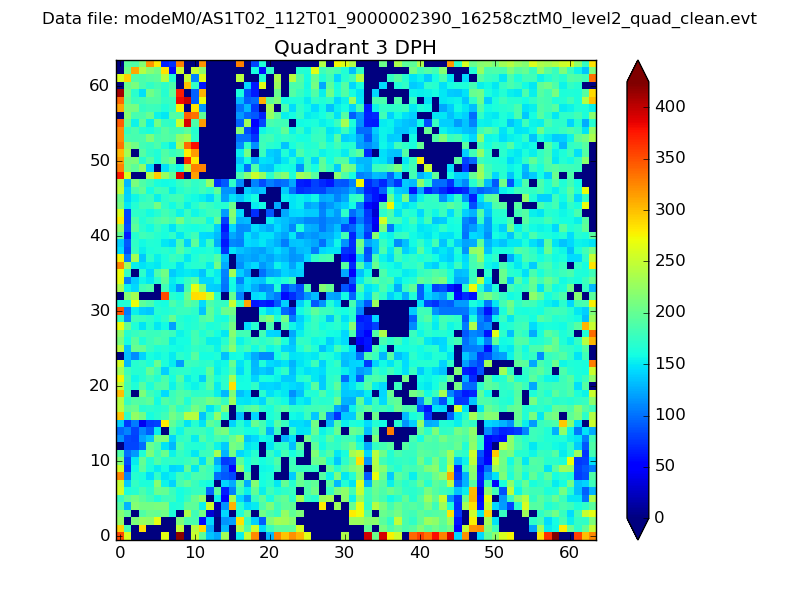 |
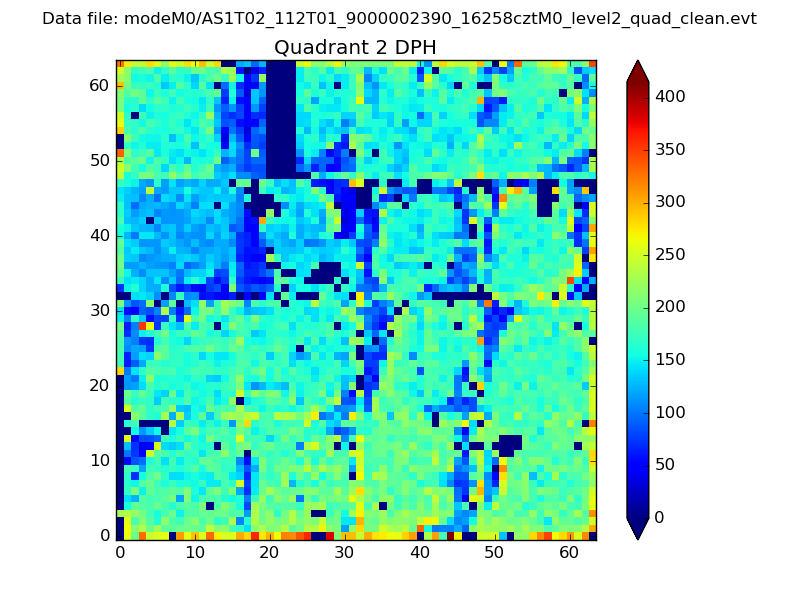 |
Quadrant C |
| Plot type | Count rate plots | Images |
|---|---|---|
| Comparison with Poisson distribution Blue bars denote a histogram of data divided into 1 sec bins. Red curve is a Poisson curve with rate = median count rate of data. |
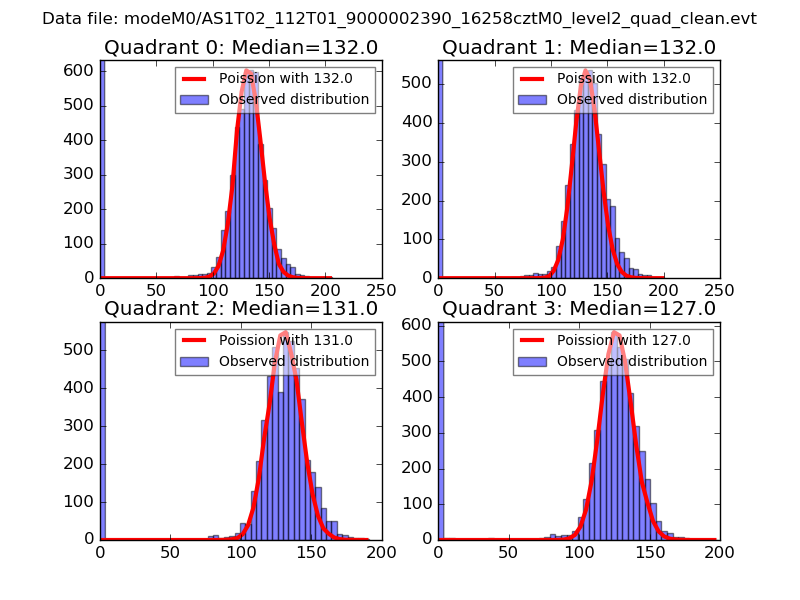 |
 |
| Quadrant-wise count rates Data is divided into 100 sec bins |
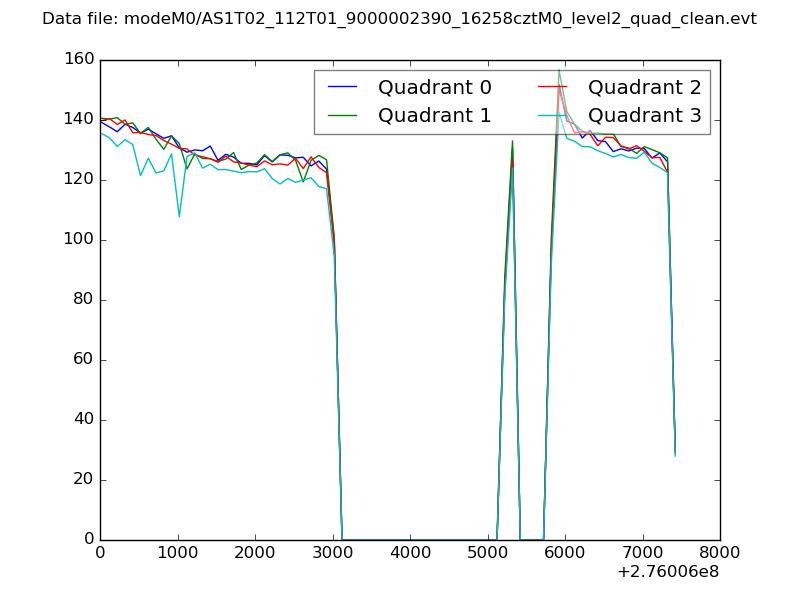 |
|
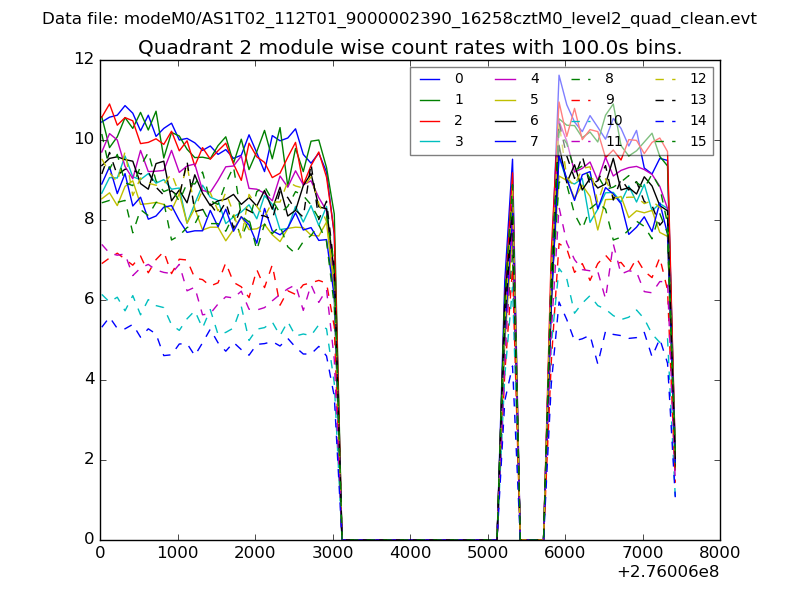
| Module-wise count rates for Quadrant A Data is divided into 100 sec bins |
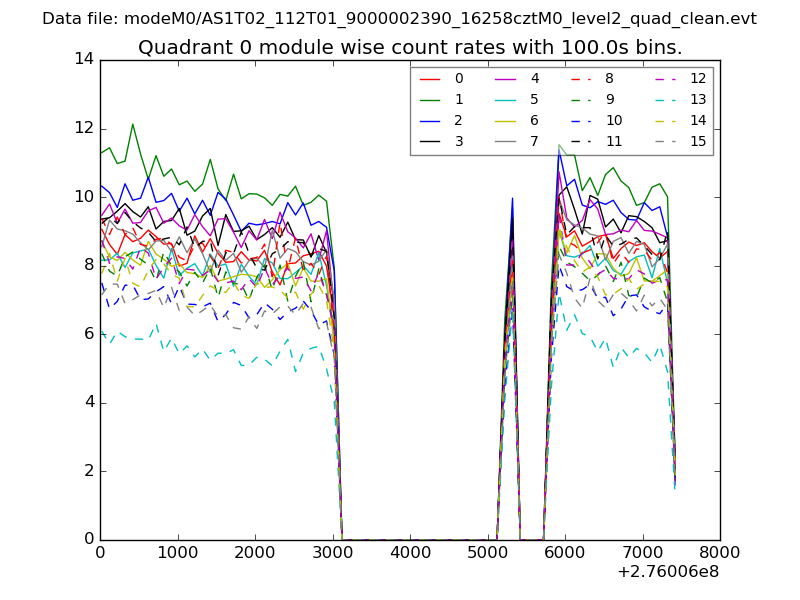 |
 |
| Module-wise count rates for Quadrant B Data is divided into 100 sec bins |
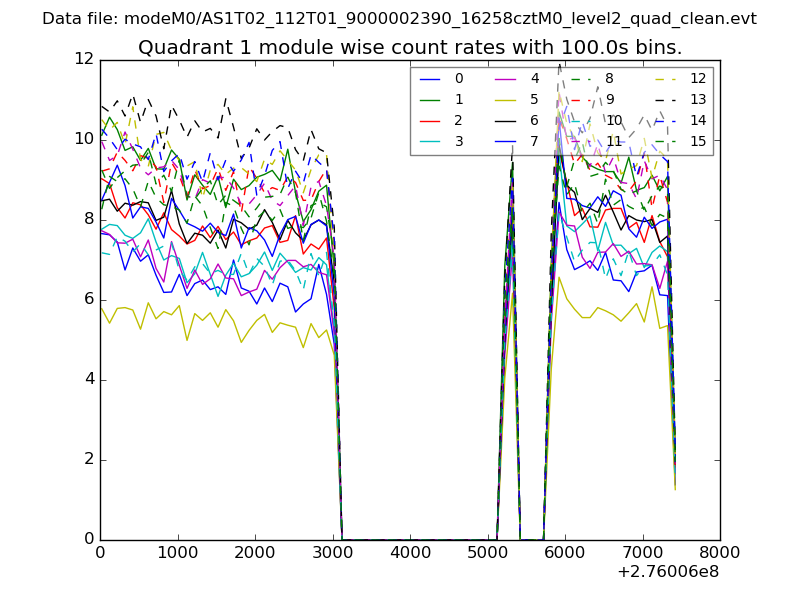 |
 |
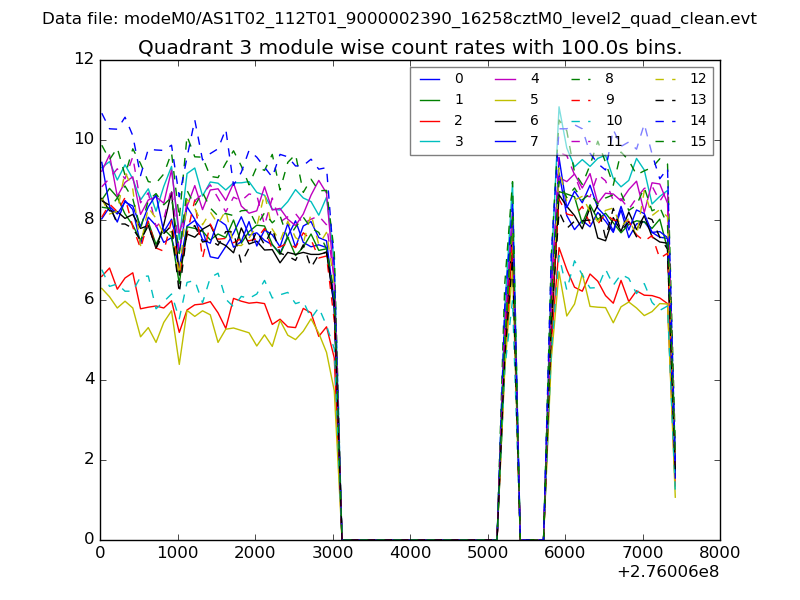
| Module-wise count rates for Quadrant C Data is divided into 100 sec bins |
 |
 |
| Module-wise count rates for Quadrant D Data is divided into 100 sec bins |
 |
 |
| Parameter | Plot |
|---|---|
| CZT HV Monitor | 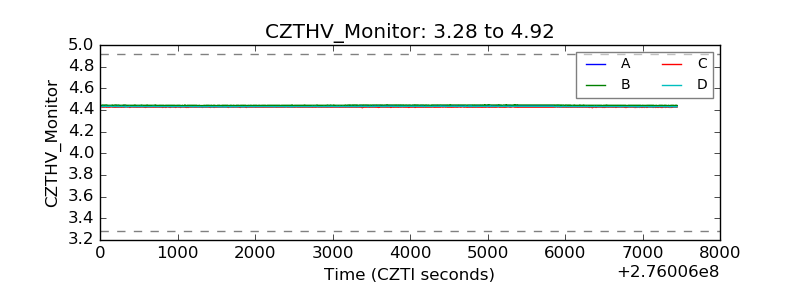 |
| D_VDD | 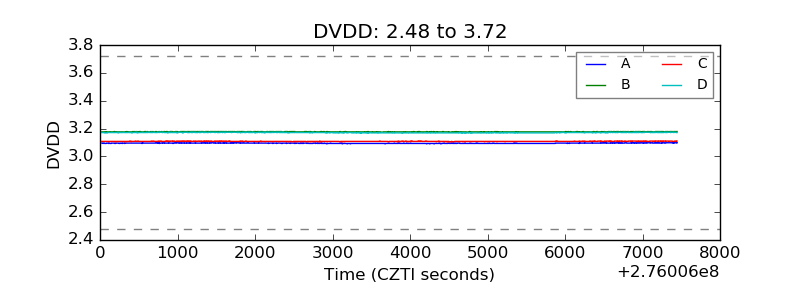 |
| Temperature 1 | 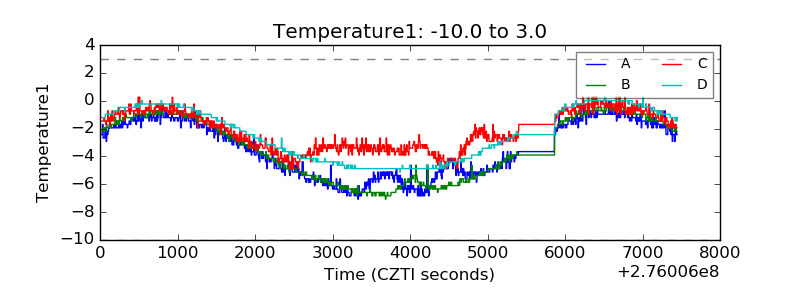 |
| Veto HV Monitor | 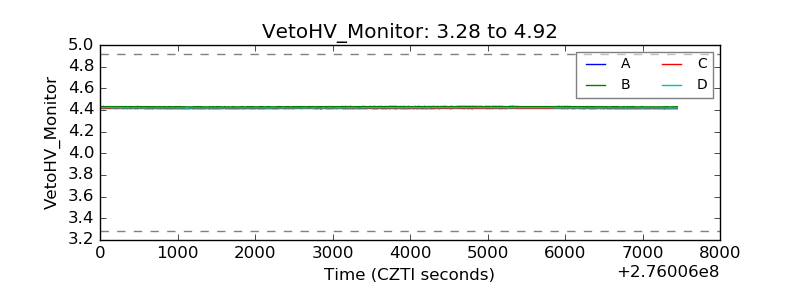 |
| Veto LLD | 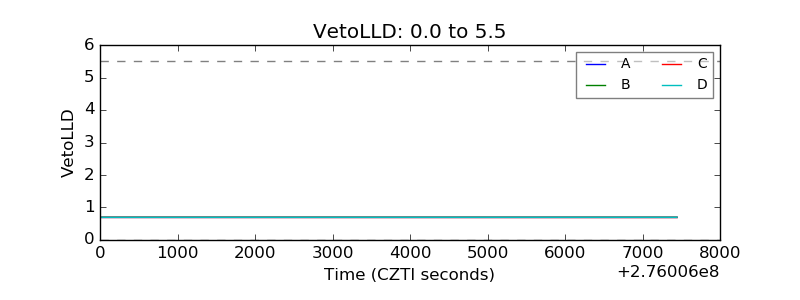 |
| Alpha Counter | 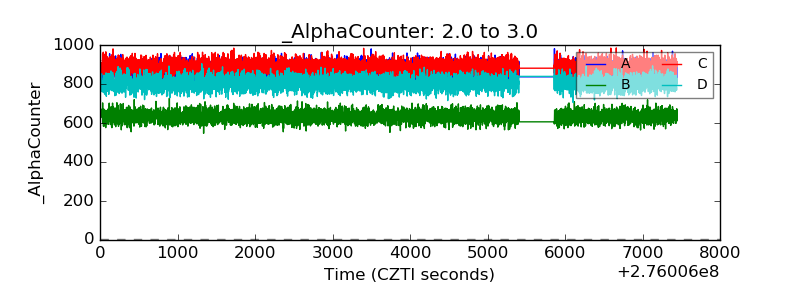 |
| _CPM_Rate | 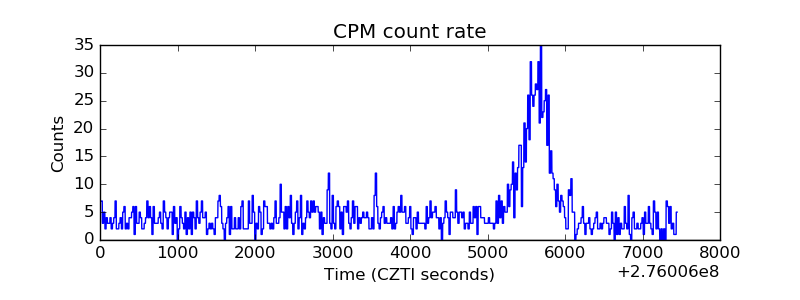 |
| CZT Counter | 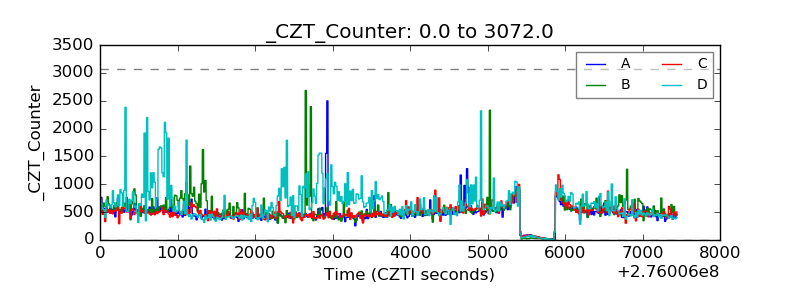 |
| +2.5 Volts monitor |  |
| +5 Volts monitor | 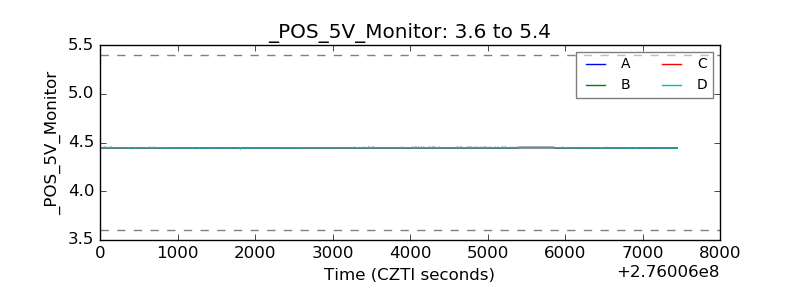 |
| _ROLL_ROT | 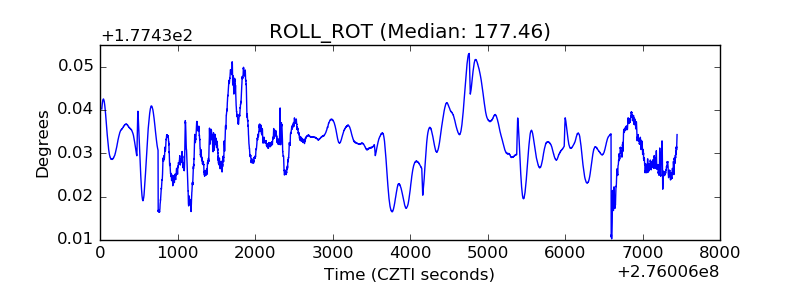 |
| _Roll_DEC | 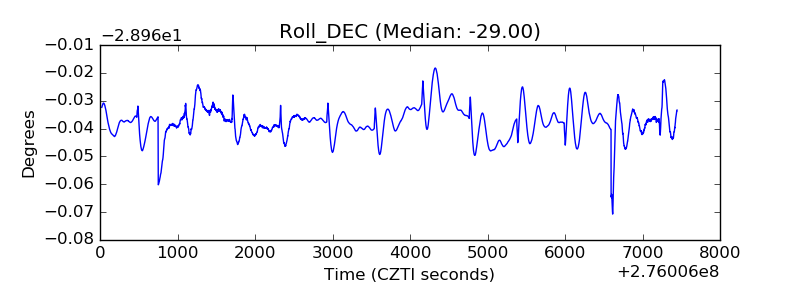 |
| _Roll_RA | 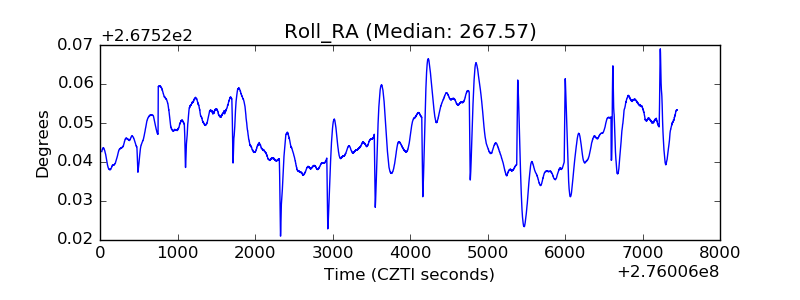 |
| Veto Counter | 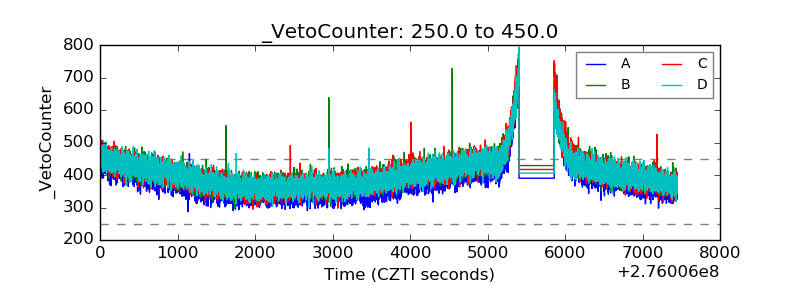 |