| Param | Original file | Final file |
|---|---|---|
| Filename | modeM0/AS1T02_112T01_9000002390_16259cztM0_level2.evt | modeM0/AS1T02_112T01_9000002390_16259cztM0_level2_quad_clean.evt |
| Size (bytes) | 513,443,520 | 99,336,960 |
| Size | 489.7 MB | 94.7 MB |
| Events in quadrant A | 3,860,930 | 629,813 |
| Events in quadrant B | 3,882,755 | 639,117 |
| Events in quadrant C | 3,479,942 | 633,215 |
| Events in quadrant D | 3,849,147 | 616,790 |
| Mode SS | |||
|---|---|---|---|
| Quadrant | BADHDUFLAG | Total packets | Discarded packets |
| A | 0 | 144 | 0 |
| B | 0 | 144 | 0 |
| C | 0 | 144 | 0 |
| D | 0 | 144 | 0 |
| Mode M9 | |||
|---|---|---|---|
| Quadrant | BADHDUFLAG | Total packets | Discarded packets |
| A | 0 | 3 | 0 |
| B | 0 | 3 | 0 |
| C | 0 | 3 | 0 |
| D | 0 | 3 | 0 |
| Mode M0 | |||
|---|---|---|---|
| Quadrant | BADHDUFLAG | Total packets | Discarded packets |
| A | 0 | 16176 | 2 |
| B | 0 | 16030 | 1 |
| C | 0 | 14847 | 1 |
| D | 0 | 16158 | 1 |
| Quadrant | Total seconds | Saturated seconds | Saturation percentage |
|---|---|---|---|
| A | 7034 | 194 | 2.758032% |
| B | 7034 | 133 | 1.890816% |
| C | 7034 | 99 | 1.407450% |
| D | 7034 | 119 | 1.691783% |
Noise dominated data is calculated using 1-second bins in cleaned event files. If a bin has >2000 counts, and if more than 50% of those come from <1% of pixels, then it is considered to be noise-dominated and hence unusable.
| Quadrant | # 1 sec bins | Bins with >0 counts | Bins with >2000 counts | High rate bins dominated by noise | Noise dominated (total time) | Noise dominated (detector-on time) | Marked lightcurve |
|---|---|---|---|---|---|---|---|
| A | 7195 | 7038 | 93 | 93 | 1.29% | 1.32% | 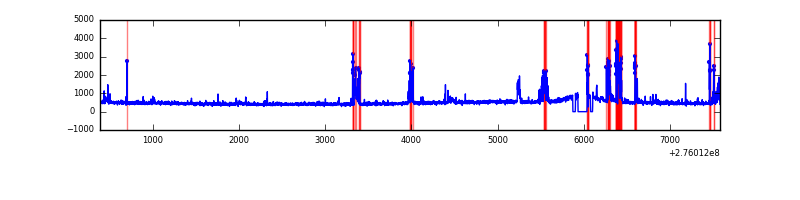 |
| B | 7195 | 7038 | 18 | 18 | 0.25% | 0.26% | 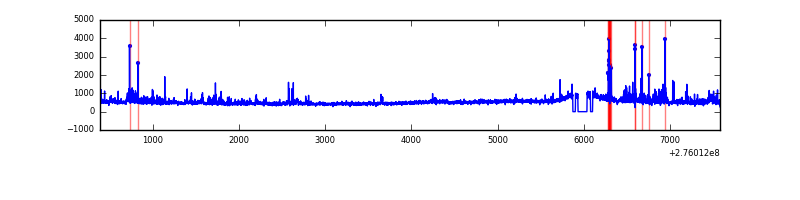 |
| C | 7195 | 7038 | 1 | 1 | 0.01% | 0.01% | 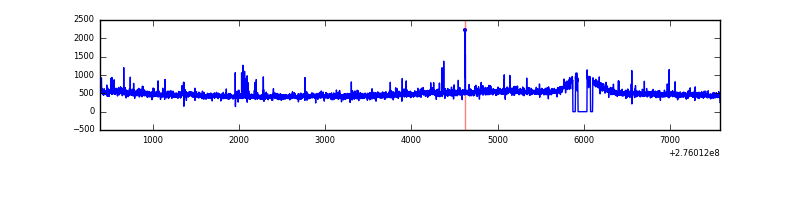 |
| D | 7195 | 7038 | 32 | 32 | 0.44% | 0.45% | 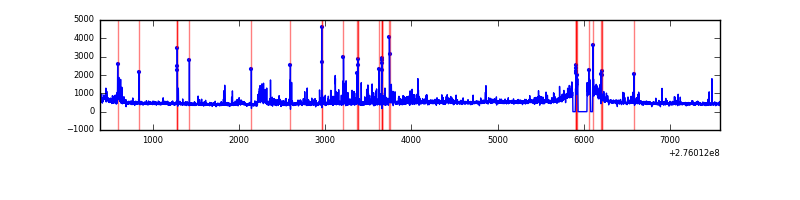 |
Top three noisy pixels from each quadrant. If the there are fewer than three noisy pixels in the level2.evt file, extra rows are filled as -1
| Pixel properties | Quadrant properties | ||||||
|---|---|---|---|---|---|---|---|
| Quadrant | DetID | PixID | Counts | Sigma | Mean | Median | Sigma |
| A | 15 | 174 | 417975 | 2406.19 | 857 | 841 | 173.4 |
| A | 14 | 250 | 55244 | 313.82 | 857 | 841 | 173.4 |
| A | 9 | 143 | 55018 | 312.51 | 857 | 841 | 173.4 |
| B | 7 | 220 | 239024 | 1440.42 | 861 | 842 | 165.4 |
| B | 4 | 216 | 41107 | 243.51 | 861 | 842 | 165.4 |
| B | 0 | 198 | 36223 | 213.97 | 861 | 842 | 165.4 |
| C | 14 | 238 | 129506 | 666.0 | 825 | 829 | 193.2 |
| C | 3 | 233 | 76851 | 393.47 | 825 | 829 | 193.2 |
| C | 0 | 207 | 32814 | 165.55 | 825 | 829 | 193.2 |
| D | 1 | 52 | 518323 | 2524.22 | 836 | 810 | 205.0 |
| D | 10 | 70 | 48696 | 233.57 | 836 | 810 | 205.0 |
| D | 12 | 233 | 46227 | 221.52 | 836 | 810 | 205.0 |
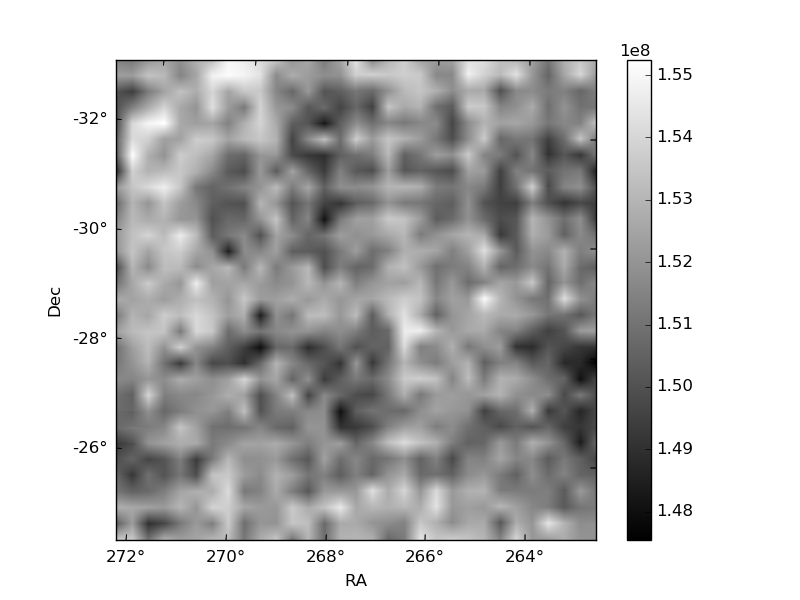
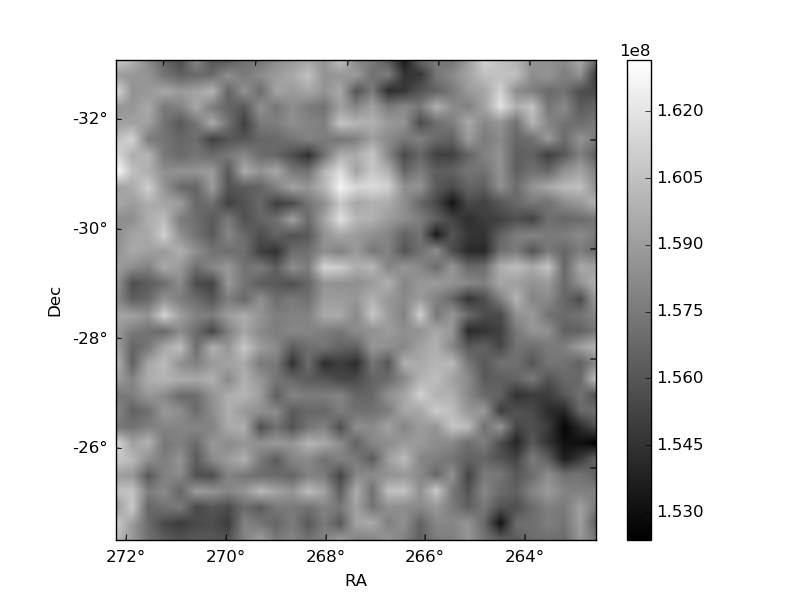
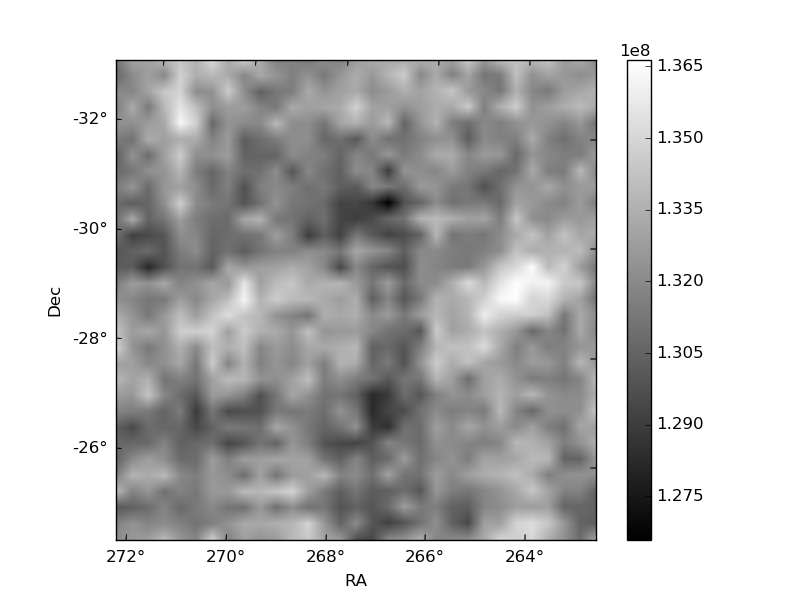
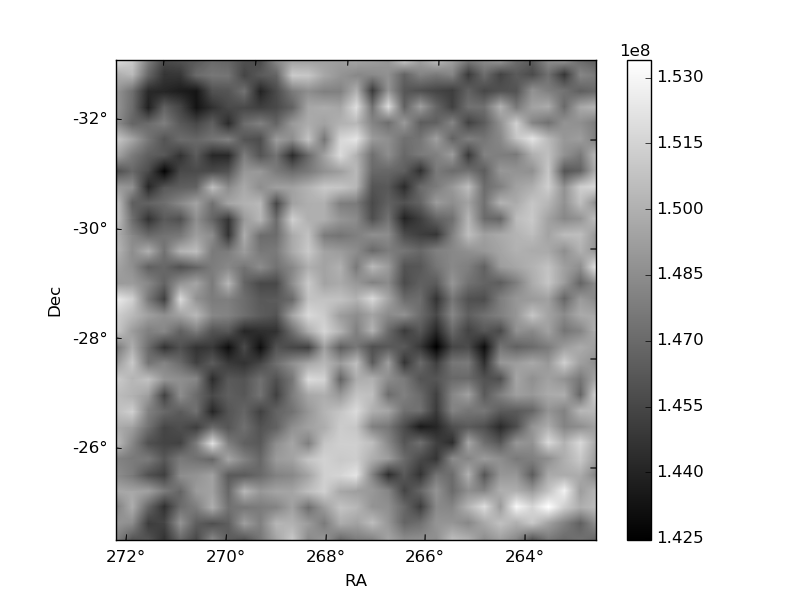
Histogram calculated using DETX and DETY for each event in the final _common_clean file
| Quadrant A | 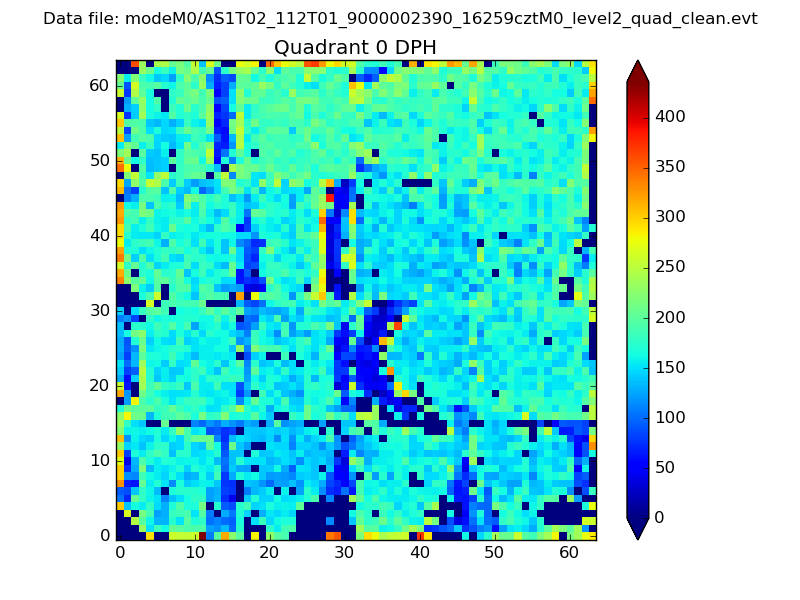 |
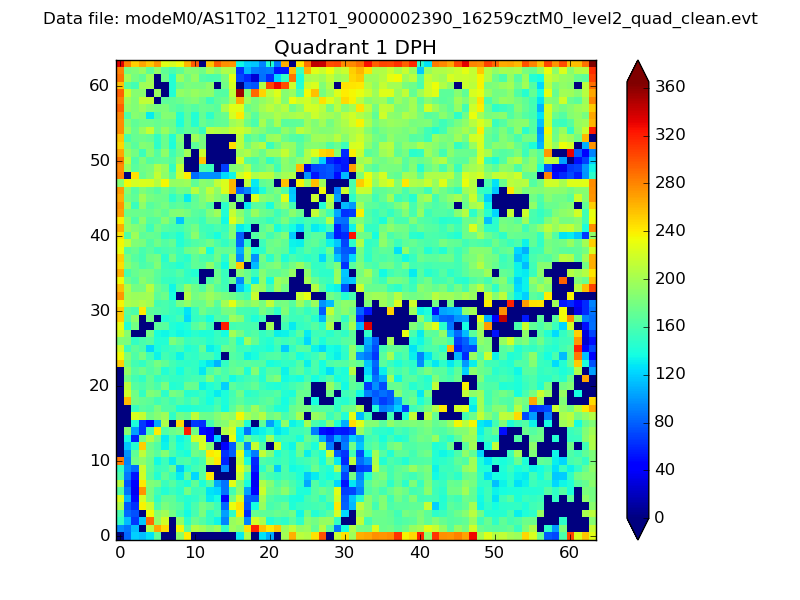 |
Quadrant B |
|---|---|---|---|
| Quadrant D | 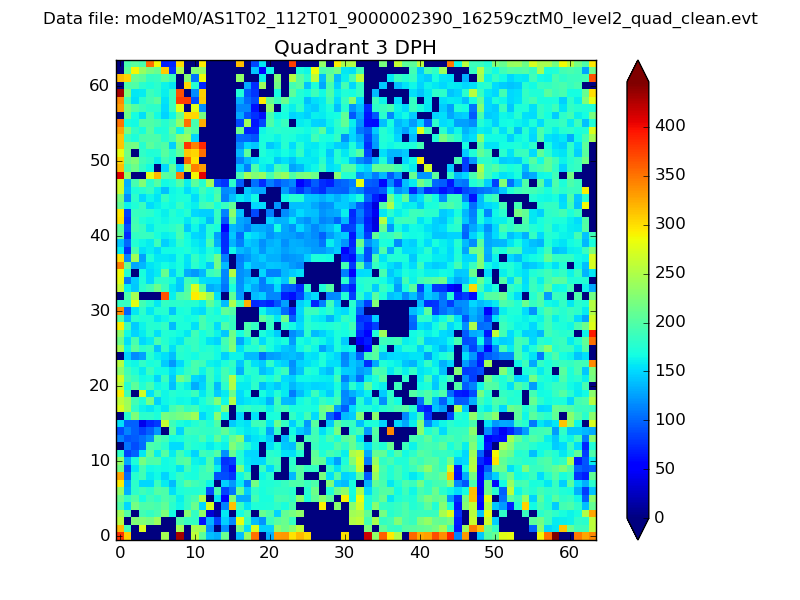 |
 |
Quadrant C |
| Plot type | Count rate plots | Images |
|---|---|---|
| Comparison with Poisson distribution Blue bars denote a histogram of data divided into 1 sec bins. Red curve is a Poisson curve with rate = median count rate of data. |
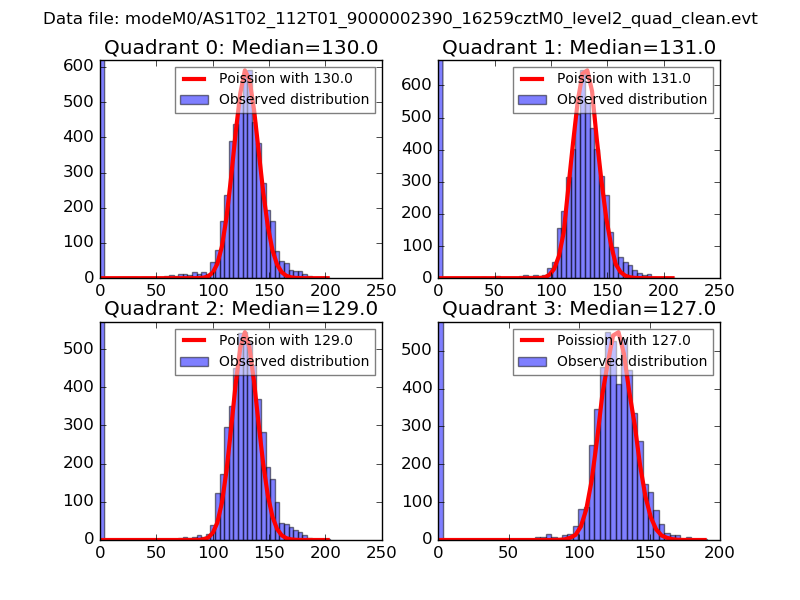 |
 |
| Quadrant-wise count rates Data is divided into 100 sec bins |
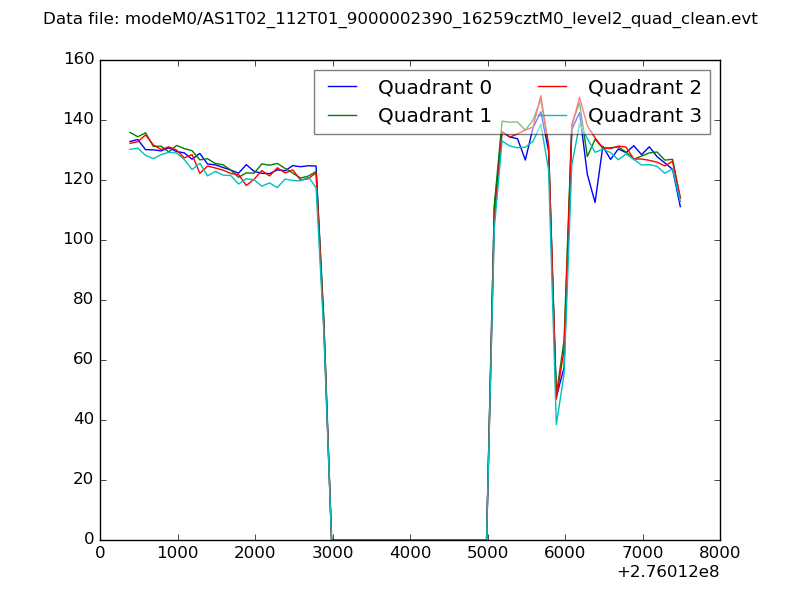 |
|
| Module-wise count rates for Quadrant A Data is divided into 100 sec bins |
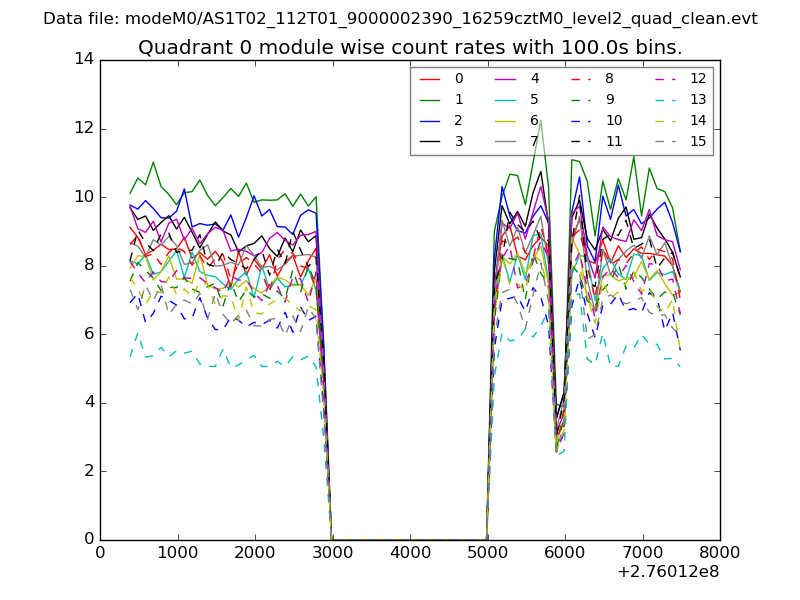 |
 |
| Module-wise count rates for Quadrant B Data is divided into 100 sec bins |
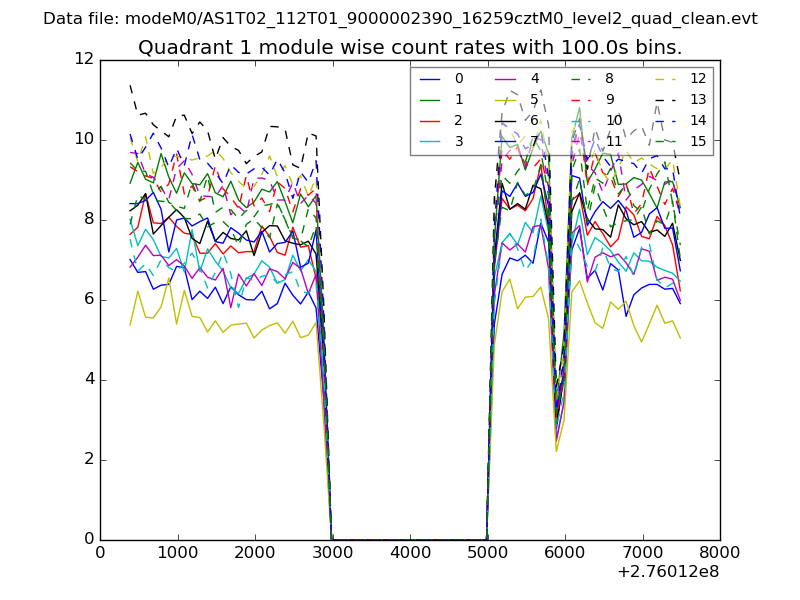 |
 |
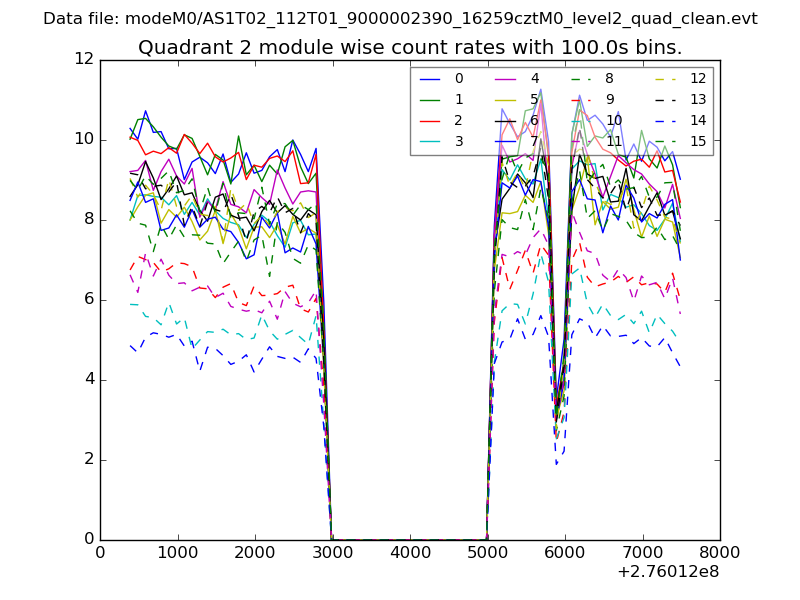
| Module-wise count rates for Quadrant C Data is divided into 100 sec bins |
 |
 |
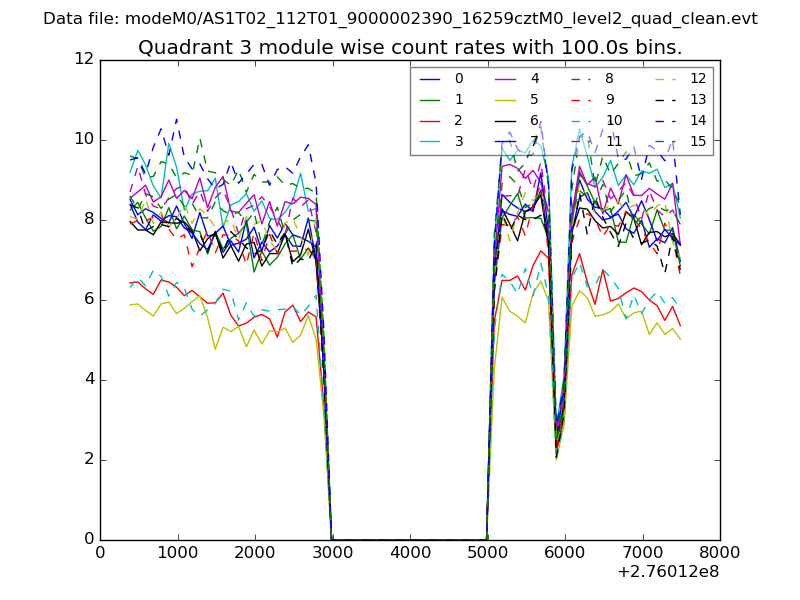
| Module-wise count rates for Quadrant D Data is divided into 100 sec bins |
 |
 |
| Parameter | Plot |
|---|---|
| CZT HV Monitor | 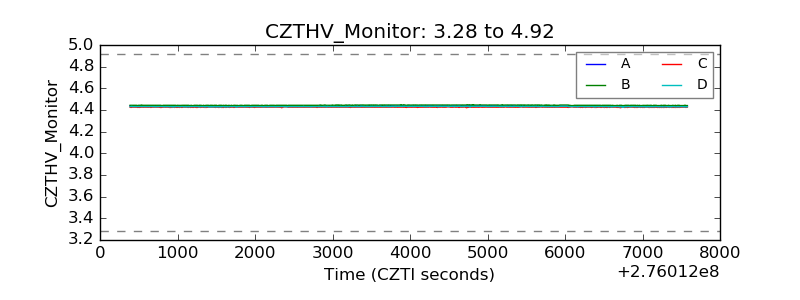 |
| D_VDD | 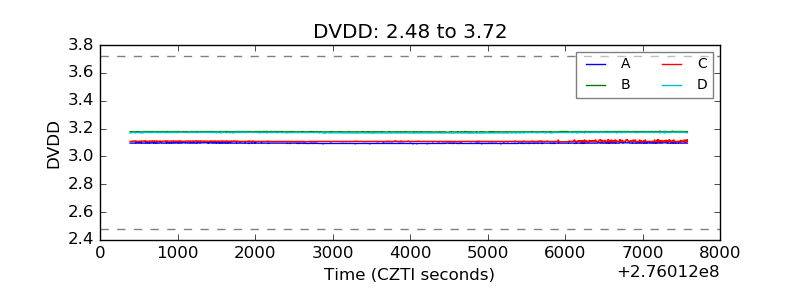 |
| Temperature 1 | 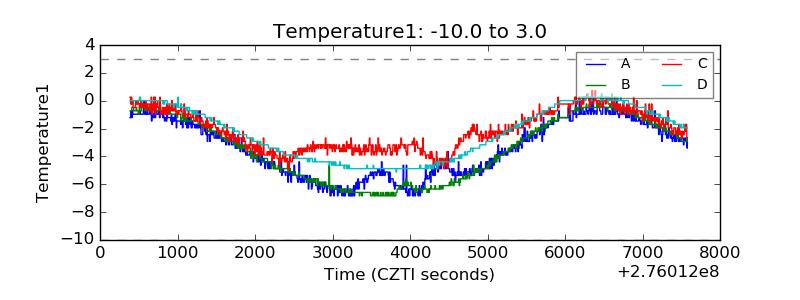 |
| Veto HV Monitor | 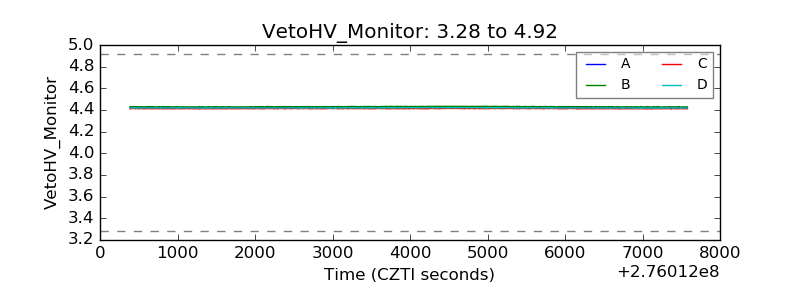 |
| Veto LLD | 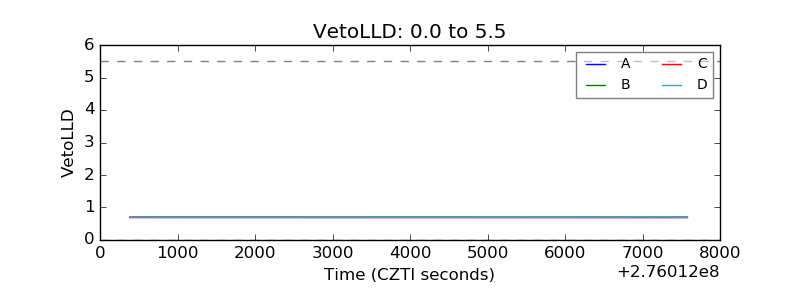 |
| Alpha Counter | 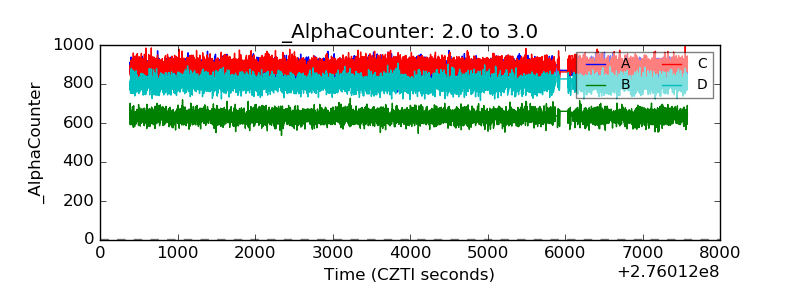 |
| _CPM_Rate | 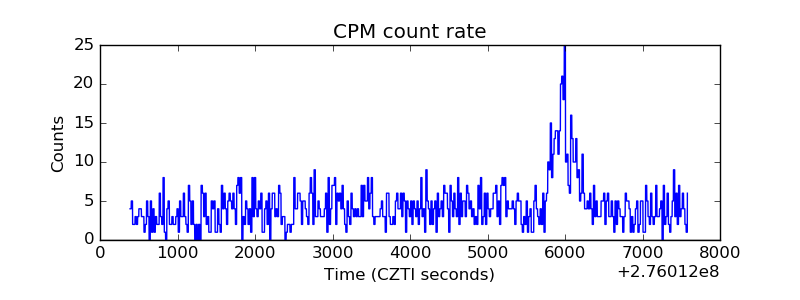 |
| CZT Counter | 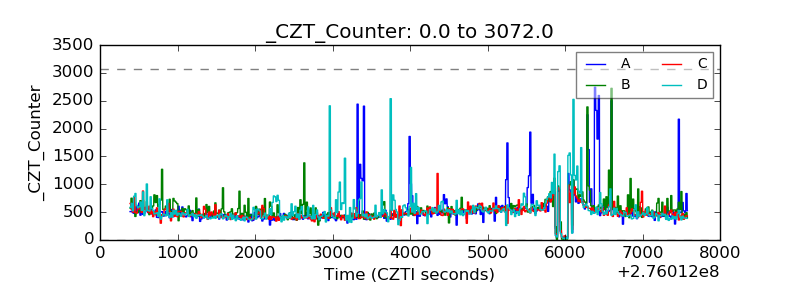 |
| +2.5 Volts monitor | 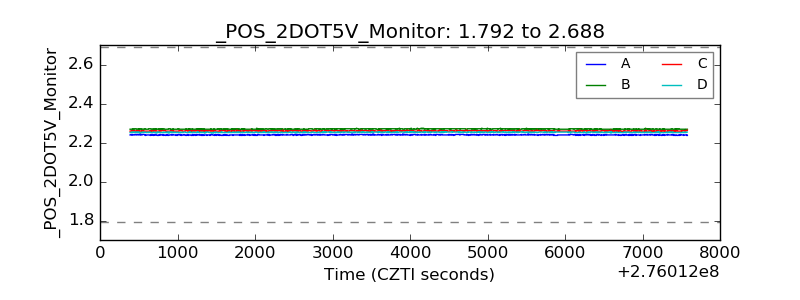 |
| +5 Volts monitor |  |
| _ROLL_ROT | 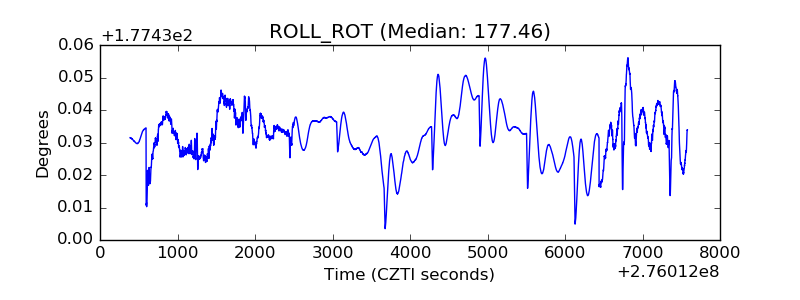 |
| _Roll_DEC | 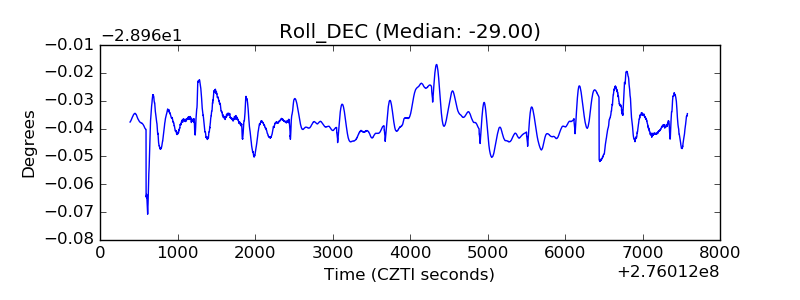 |
| _Roll_RA |  |
| Veto Counter | 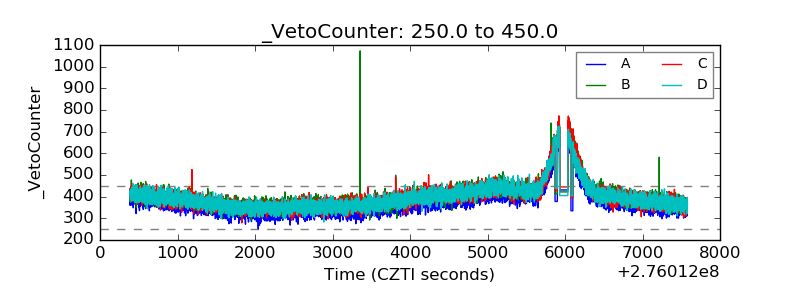 |