| Param | Original file | Final file |
|---|---|---|
| Filename | modeM0/AS1T02_112T01_9000002390_16263cztM0_level2.evt | modeM0/AS1T02_112T01_9000002390_16263cztM0_level2_quad_clean.evt |
| Size (bytes) | 1,528,920,000 | 230,578,560 |
| Size | 1.4 GB | 219.9 MB |
| Events in quadrant A | 11,272,525 | 1,436,553 |
| Events in quadrant B | 15,134,582 | 1,415,875 |
| Events in quadrant C | 8,976,440 | 1,453,759 |
| Events in quadrant D | 9,686,863 | 1,417,508 |
| Mode SS | |||
|---|---|---|---|
| Quadrant | BADHDUFLAG | Total packets | Discarded packets |
| A | 0 | 370 | 0 |
| B | 0 | 370 | 0 |
| C | 0 | 370 | 0 |
| D | 0 | 370 | 0 |
| Mode M9 | |||
|---|---|---|---|
| Quadrant | BADHDUFLAG | Total packets | Discarded packets |
| A | 0 | 23 | 0 |
| B | 0 | 23 | 0 |
| C | 0 | 23 | 0 |
| D | 0 | 23 | 0 |
| Mode M0 | |||
|---|---|---|---|
| Quadrant | BADHDUFLAG | Total packets | Discarded packets |
| A | 0 | 45579 | 5 |
| B | 0 | 57348 | 4 |
| C | 0 | 38393 | 4 |
| D | 0 | 41479 | 4 |
| Quadrant | Total seconds | Saturated seconds | Saturation percentage |
|---|---|---|---|
| A | 18278 | 741 | 4.054054% |
| B | 18278 | 1886 | 10.318416% |
| C | 18278 | 144 | 0.787832% |
| D | 18278 | 391 | 2.139184% |
Noise dominated data is calculated using 1-second bins in cleaned event files. If a bin has >2000 counts, and if more than 50% of those come from <1% of pixels, then it is considered to be noise-dominated and hence unusable.
| Quadrant | # 1 sec bins | Bins with >0 counts | Bins with >2000 counts | High rate bins dominated by noise | Noise dominated (total time) | Noise dominated (detector-on time) | Marked lightcurve |
|---|---|---|---|---|---|---|---|
| A | 20364 | 18282 | 529 | 529 | 2.60% | 2.89% | 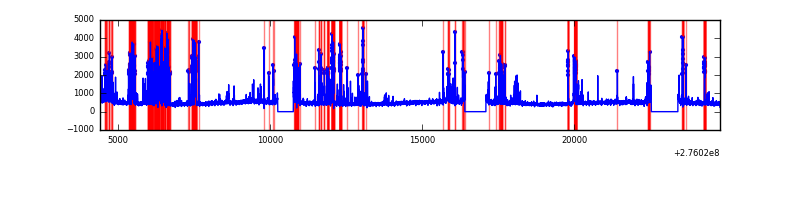 |
| B | 20364 | 18282 | 1200 | 1200 | 5.89% | 6.56% | 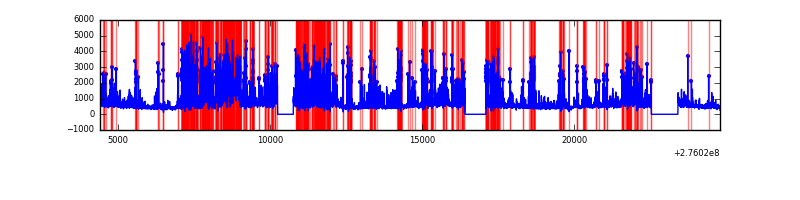 |
| C | 20364 | 18282 | 4 | 4 | 0.02% | 0.02% | 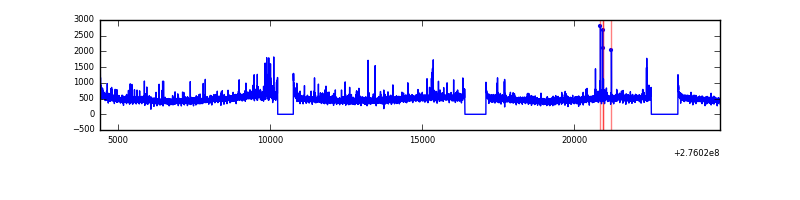 |
| D | 20364 | 18282 | 306 | 306 | 1.50% | 1.67% | 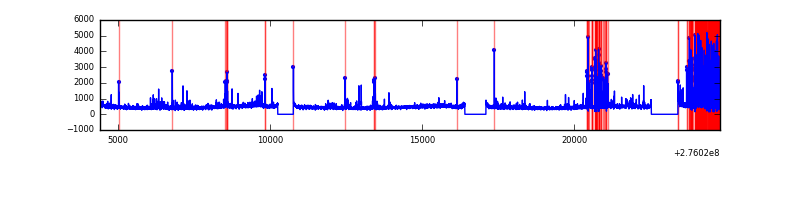 |
Top three noisy pixels from each quadrant. If the there are fewer than three noisy pixels in the level2.evt file, extra rows are filled as -1
| Pixel properties | Quadrant properties | ||||||
|---|---|---|---|---|---|---|---|
| Quadrant | DetID | PixID | Counts | Sigma | Mean | Median | Sigma |
| A | 15 | 174 | 2717518 | 6288.8 | 2149 | 2106 | 431.8 |
| A | 9 | 143 | 234458 | 538.12 | 2149 | 2106 | 431.8 |
| A | 0 | 226 | 19318 | 39.86 | 2149 | 2106 | 431.8 |
| B | 3 | 112 | 5507402 | 13894.15 | 2095 | 2043 | 396.2 |
| B | 7 | 220 | 543090 | 1365.47 | 2095 | 2043 | 396.2 |
| B | 0 | 189 | 163671 | 407.91 | 2095 | 2043 | 396.2 |
| C | 3 | 233 | 324875 | 659.62 | 2090 | 2108 | 489.3 |
| C | 14 | 238 | 322589 | 654.95 | 2090 | 2108 | 489.3 |
| C | 0 | 207 | 135050 | 271.68 | 2090 | 2108 | 489.3 |
| D | 1 | 52 | 1639227 | 3206.71 | 2100 | 2038 | 510.6 |
| D | 2 | 234 | 73936 | 140.82 | 2100 | 2038 | 510.6 |
| D | 10 | 70 | 47185 | 88.43 | 2100 | 2038 | 510.6 |
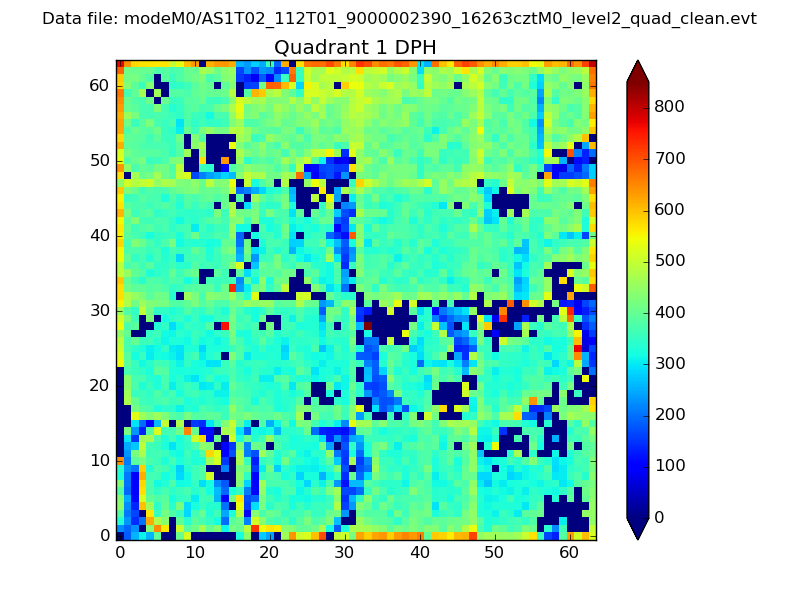
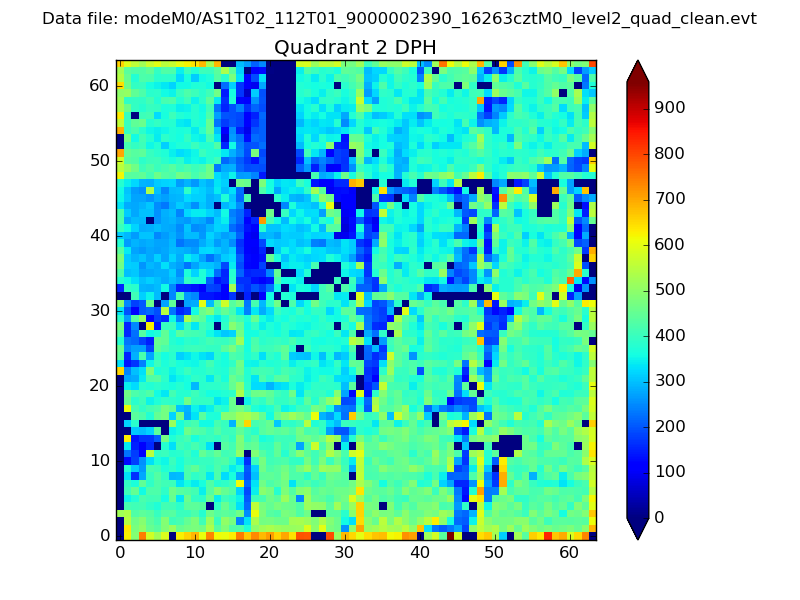
Histogram calculated using DETX and DETY for each event in the final _common_clean file
| Quadrant A |  |
 |
Quadrant B |
|---|---|---|---|
| Quadrant D | 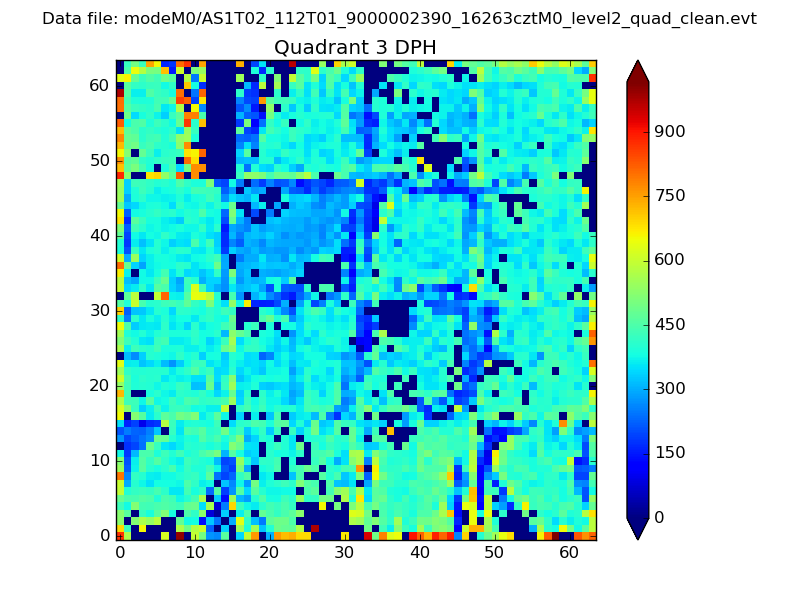 |
 |
Quadrant C |
| Plot type | Count rate plots | Images |
|---|---|---|
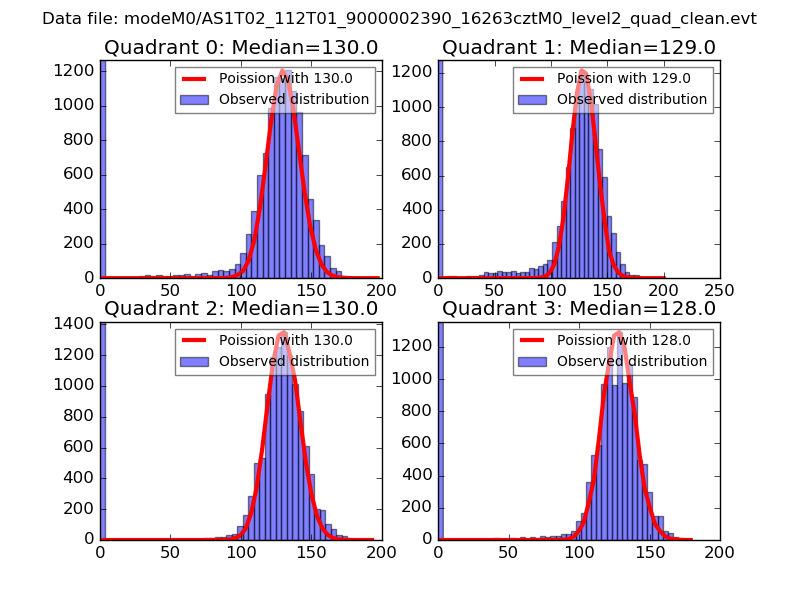
| Comparison with Poisson distribution Blue bars denote a histogram of data divided into 1 sec bins. Red curve is a Poisson curve with rate = median count rate of data. |
 |
 |
| Quadrant-wise count rates Data is divided into 100 sec bins |
 |
|
| Module-wise count rates for Quadrant A Data is divided into 100 sec bins |
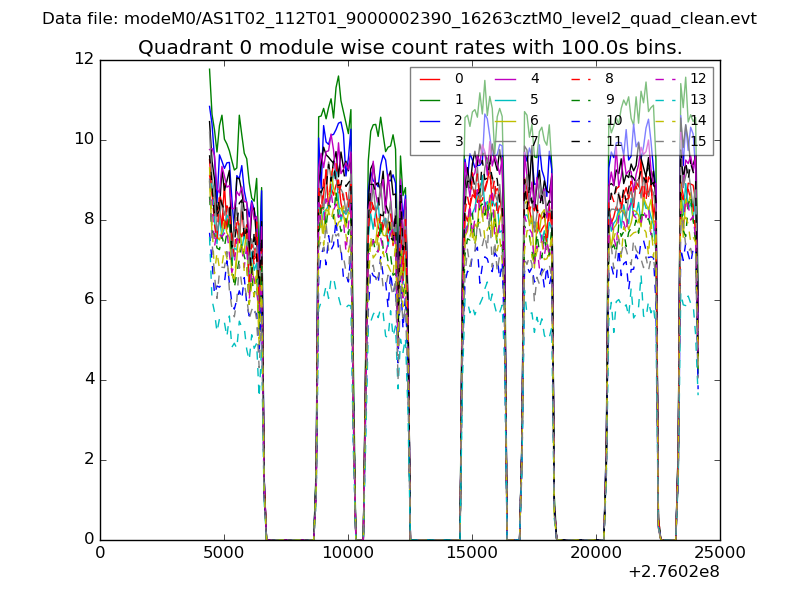 |
 |
| Module-wise count rates for Quadrant B Data is divided into 100 sec bins |
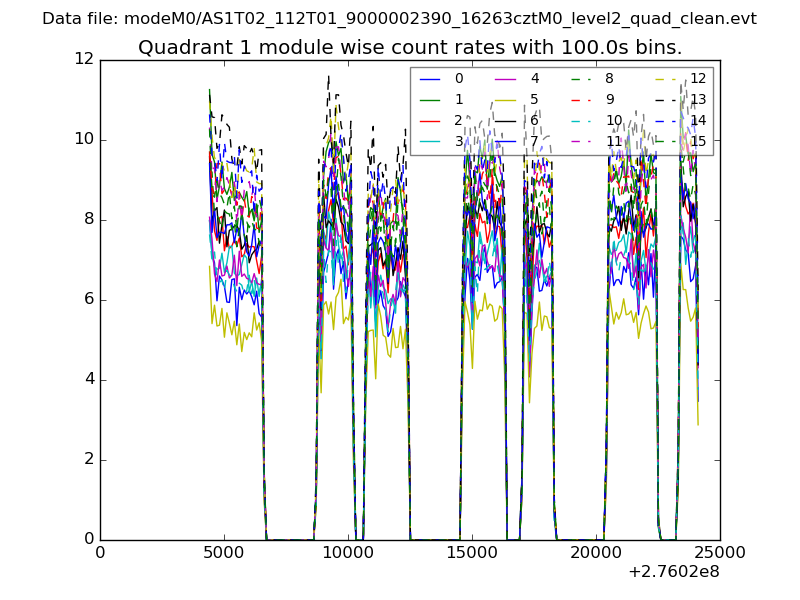 |
 |
| Module-wise count rates for Quadrant C Data is divided into 100 sec bins |
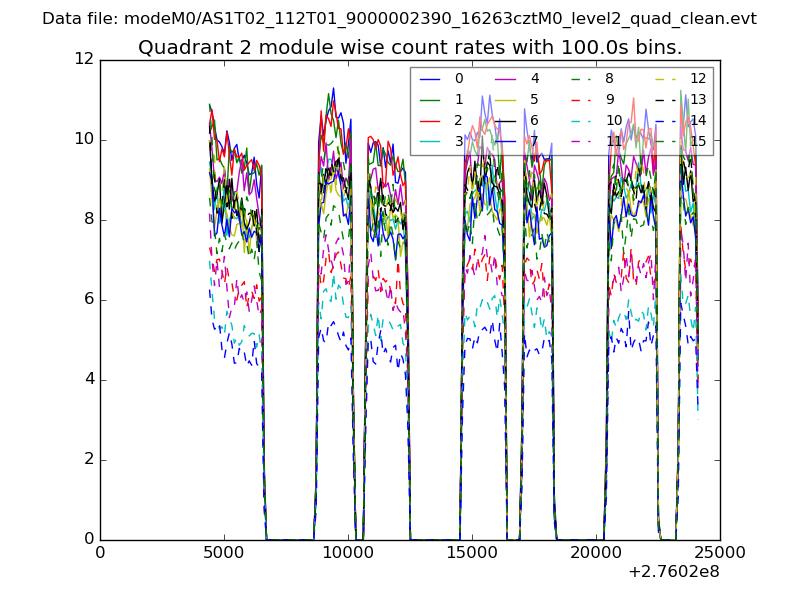 |
 |
| Module-wise count rates for Quadrant D Data is divided into 100 sec bins |
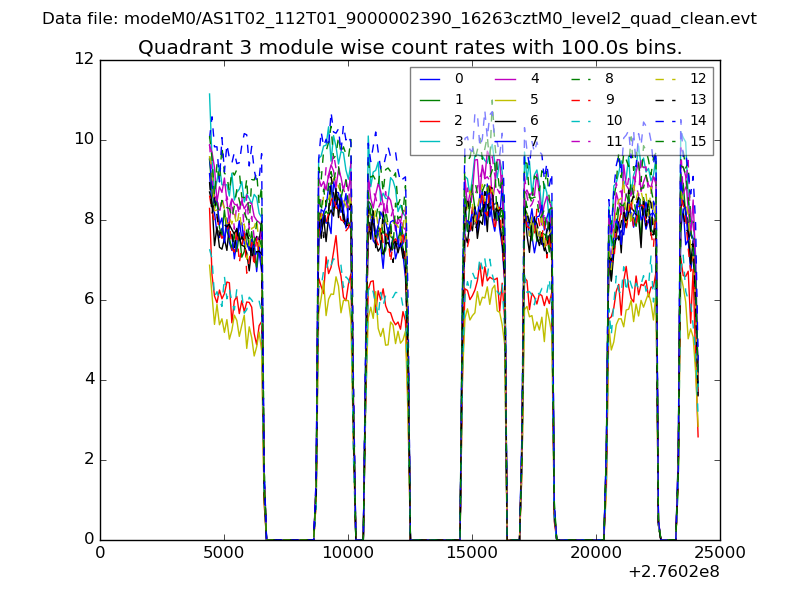 |
 |
| Parameter | Plot |
|---|---|
| CZT HV Monitor | 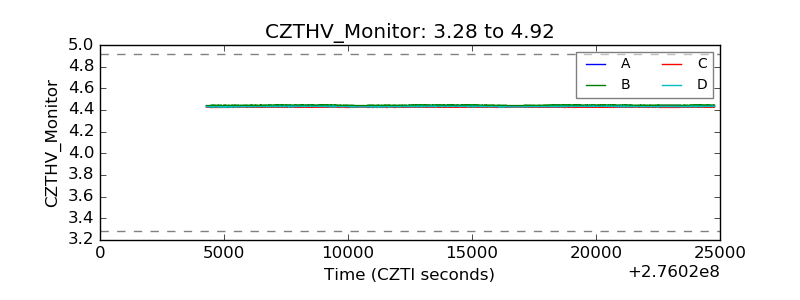 |
| D_VDD | 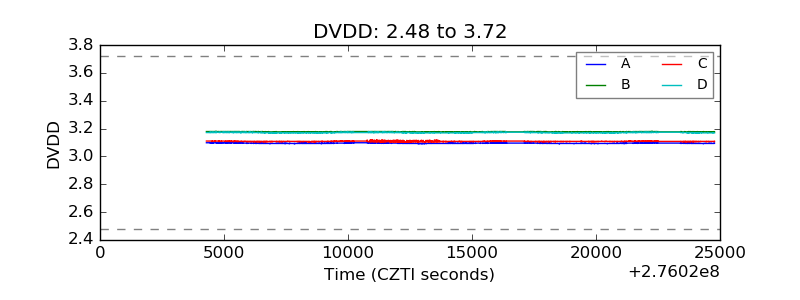 |
| Temperature 1 | 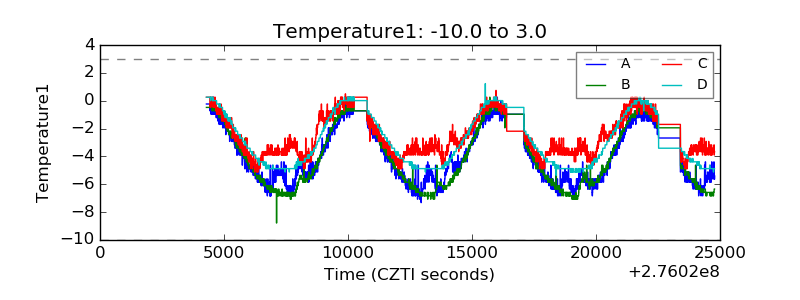 |
| Veto HV Monitor | 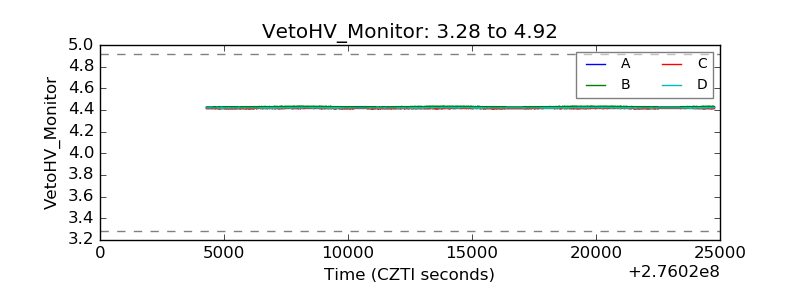 |
| Veto LLD | 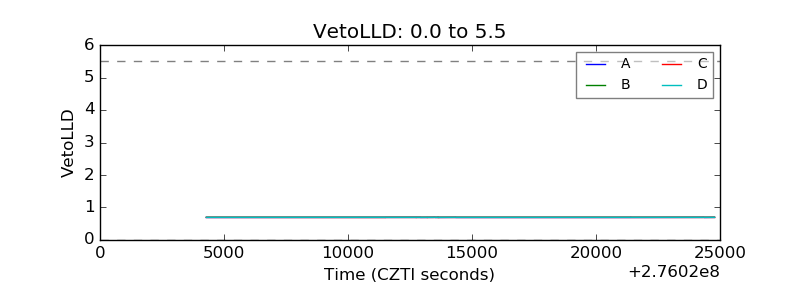 |
| Alpha Counter | 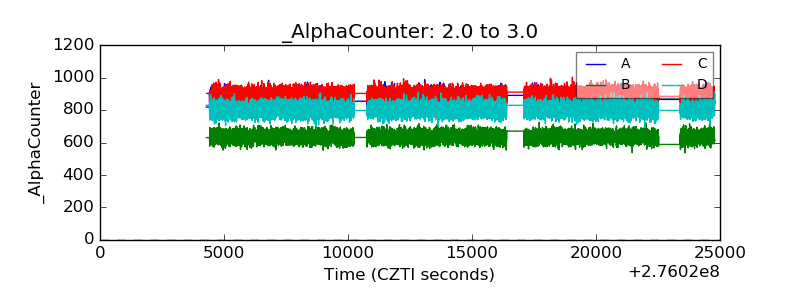 |
| _CPM_Rate | 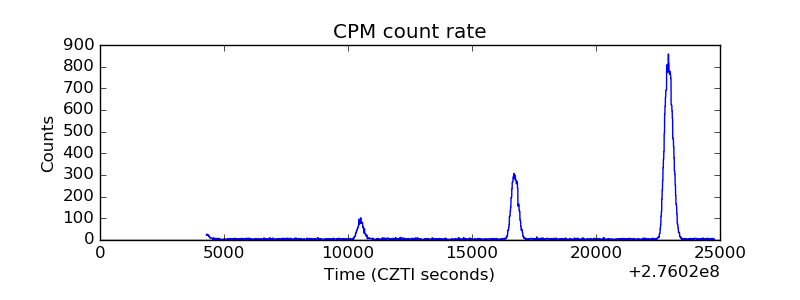 |
| CZT Counter | 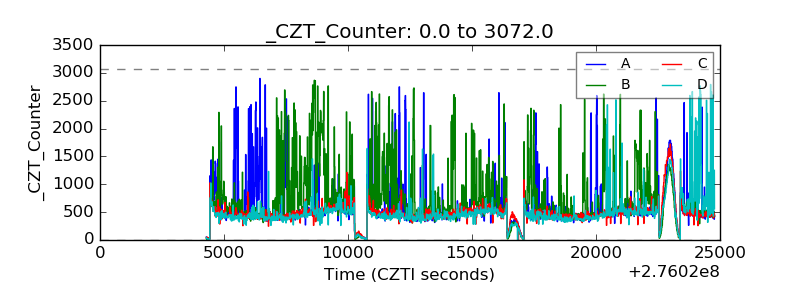 |
| +2.5 Volts monitor |  |
| +5 Volts monitor |  |
| _ROLL_ROT | 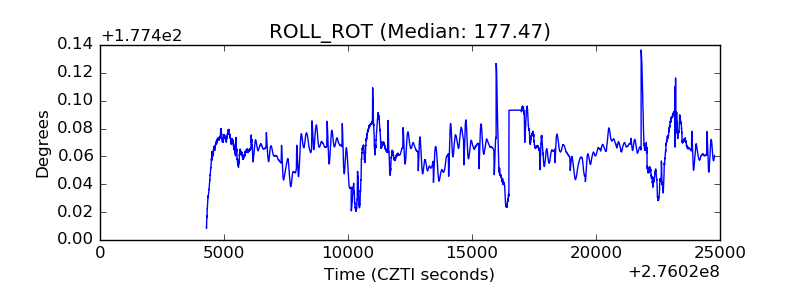 |
| _Roll_DEC | 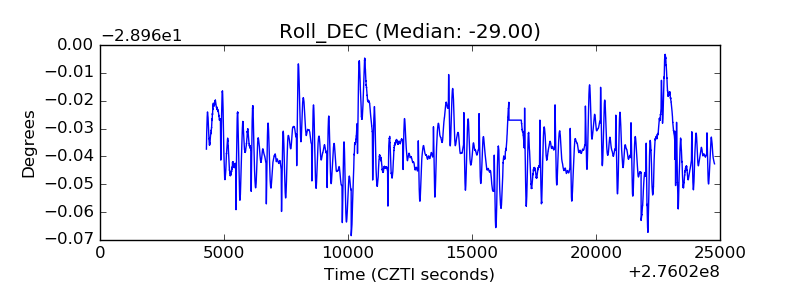 |
| _Roll_RA |  |
| Veto Counter | 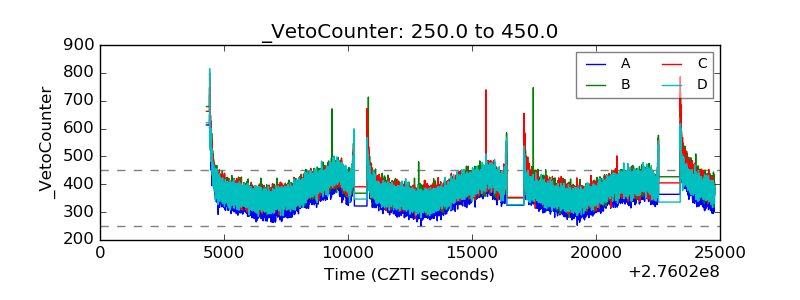 |