| Param | Original file | Final file |
|---|---|---|
| Filename | modeM0/AS1T02_112T01_9000002390_16266cztM0_level2.evt | modeM0/AS1T02_112T01_9000002390_16266cztM0_level2_quad_clean.evt |
| Size (bytes) | 585,259,200 | 66,640,320 |
| Size | 558.1 MB | 63.6 MB |
| Events in quadrant A | 4,196,435 | 392,860 |
| Events in quadrant B | 5,505,431 | 389,899 |
| Events in quadrant C | 3,315,756 | 400,686 |
| Events in quadrant D | 4,260,029 | 373,960 |
| Mode SS | |||
|---|---|---|---|
| Quadrant | BADHDUFLAG | Total packets | Discarded packets |
| A | 0 | 134 | 0 |
| B | 0 | 134 | 0 |
| C | 0 | 134 | 0 |
| D | 0 | 134 | 0 |
| Mode M9 | |||
|---|---|---|---|
| Quadrant | BADHDUFLAG | Total packets | Discarded packets |
| A | 0 | 13 | 0 |
| B | 0 | 13 | 0 |
| C | 0 | 13 | 0 |
| D | 0 | 14 | 0 |
| Mode M0 | |||
|---|---|---|---|
| Quadrant | BADHDUFLAG | Total packets | Discarded packets |
| A | 0 | 16644 | 3 |
| B | 0 | 20684 | 2 |
| C | 0 | 13839 | 2 |
| D | 0 | 17020 | 2 |
| Quadrant | Total seconds | Saturated seconds | Saturation percentage |
|---|---|---|---|
| A | 6597 | 251 | 3.804760% |
| B | 6597 | 550 | 8.337123% |
| C | 6597 | 82 | 1.242989% |
| D | 6597 | 325 | 4.926482% |
Noise dominated data is calculated using 1-second bins in cleaned event files. If a bin has >2000 counts, and if more than 50% of those come from <1% of pixels, then it is considered to be noise-dominated and hence unusable.
| Quadrant | # 1 sec bins | Bins with >0 counts | Bins with >2000 counts | High rate bins dominated by noise | Noise dominated (total time) | Noise dominated (detector-on time) | Marked lightcurve |
|---|---|---|---|---|---|---|---|
| A | 7733 | 6599 | 148 | 148 | 1.91% | 2.24% | 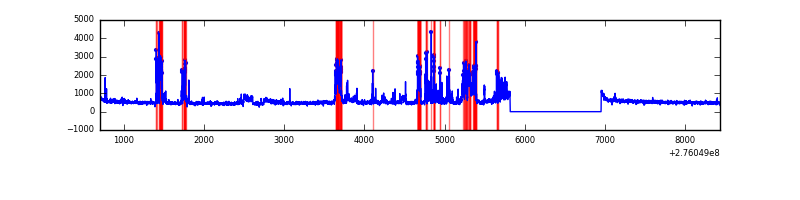 |
| B | 7733 | 6599 | 341 | 341 | 4.41% | 5.17% | 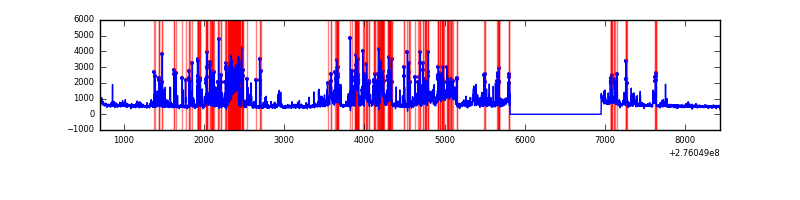 |
| C | 7733 | 6599 | 0 | 0 | 0.00% | 0.00% | 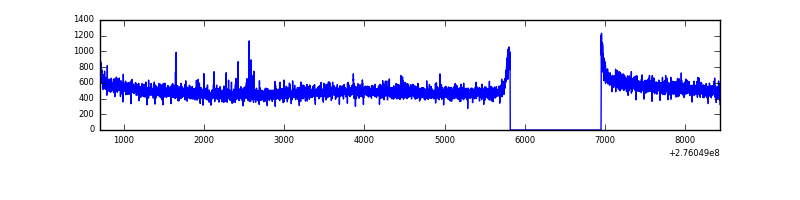 |
| D | 7733 | 6599 | 213 | 213 | 2.75% | 3.23% | 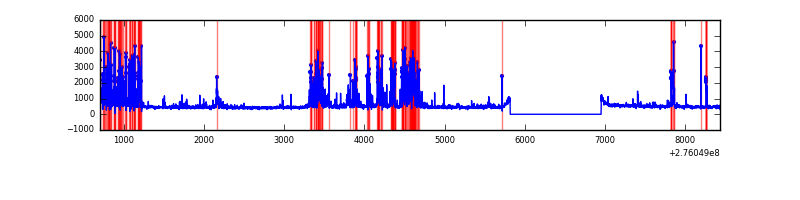 |
Top three noisy pixels from each quadrant. If the there are fewer than three noisy pixels in the level2.evt file, extra rows are filled as -1
| Pixel properties | Quadrant properties | ||||||
|---|---|---|---|---|---|---|---|
| Quadrant | DetID | PixID | Counts | Sigma | Mean | Median | Sigma |
| A | 15 | 174 | 850958 | 5140.16 | 830 | 814 | 165.4 |
| A | 14 | 4 | 100883 | 605.04 | 830 | 814 | 165.4 |
| A | 9 | 143 | 31111 | 183.18 | 830 | 814 | 165.4 |
| B | 3 | 112 | 1849584 | 11890.15 | 823 | 804 | 155.5 |
| B | 4 | 216 | 154024 | 985.41 | 823 | 804 | 155.5 |
| B | 7 | 220 | 102836 | 656.2 | 823 | 804 | 155.5 |
| C | 14 | 238 | 126689 | 669.81 | 808 | 815 | 187.9 |
| C | 3 | 233 | 30249 | 156.63 | 808 | 815 | 187.9 |
| C | 0 | 207 | 10265 | 50.29 | 808 | 815 | 187.9 |
| D | 1 | 52 | 948956 | 4926.61 | 797 | 776 | 192.5 |
| D | 10 | 70 | 233880 | 1211.17 | 797 | 776 | 192.5 |
| D | 13 | 112 | 49382 | 252.55 | 797 | 776 | 192.5 |
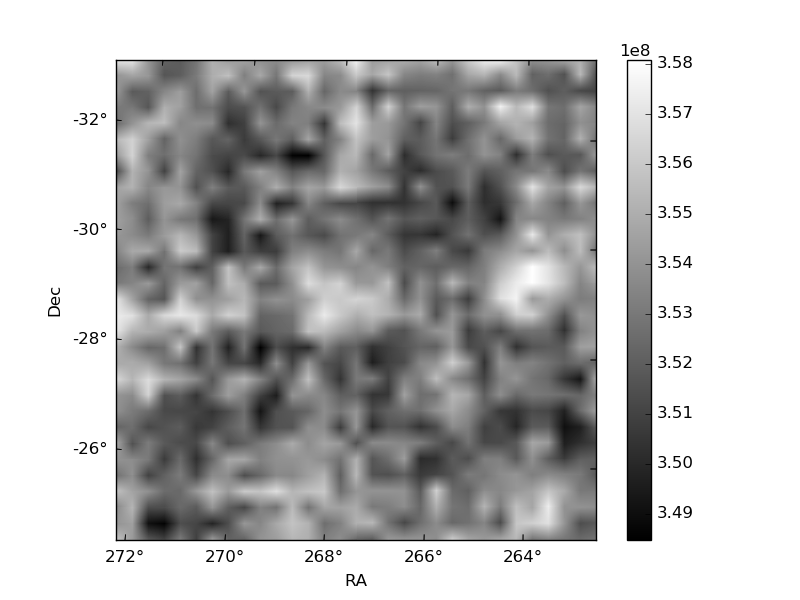
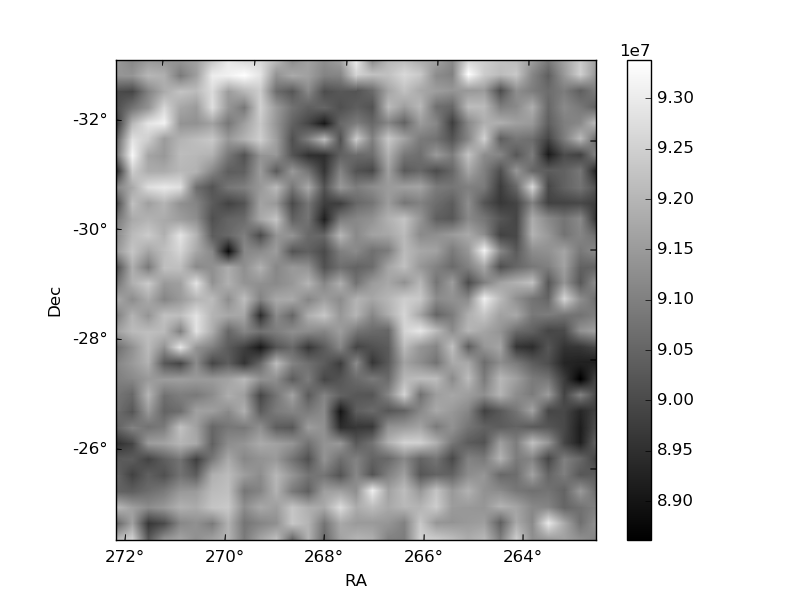
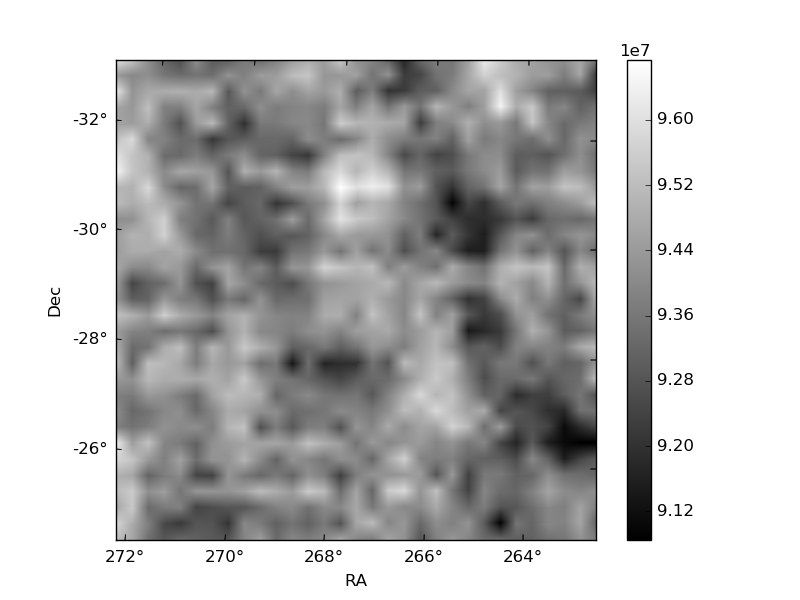
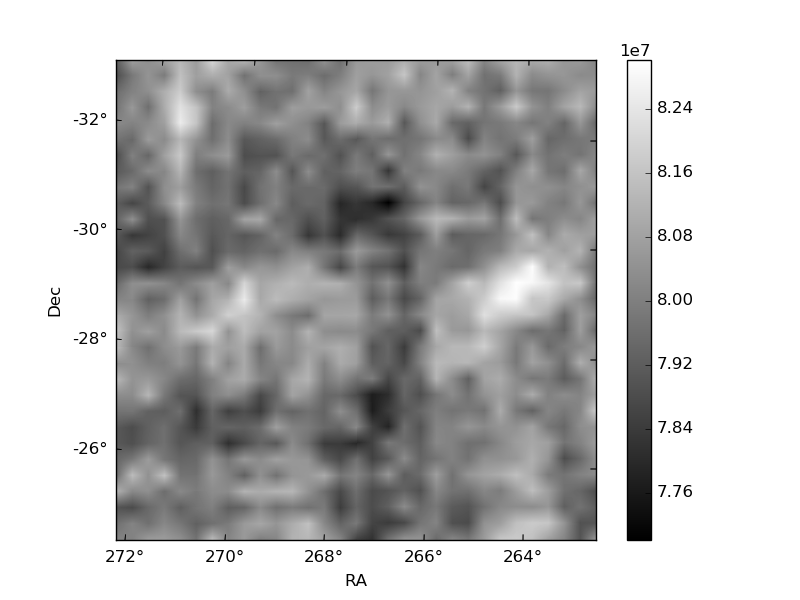
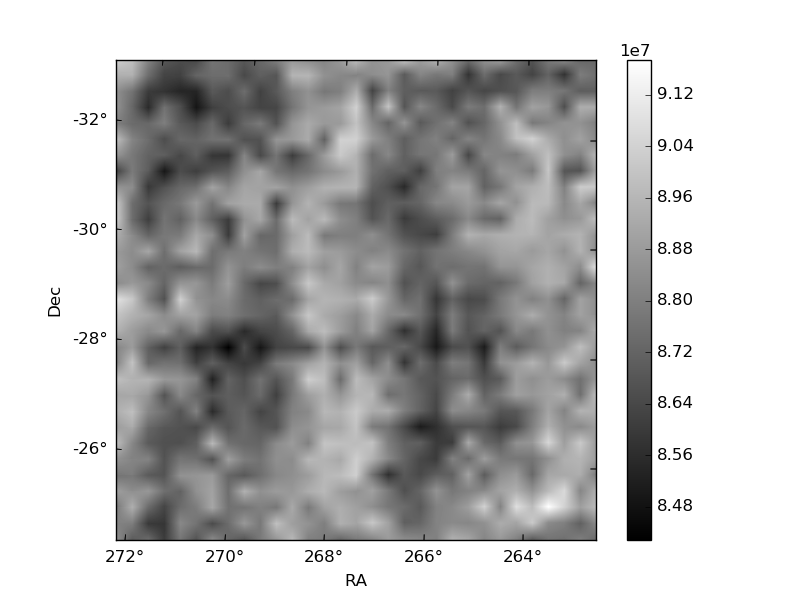
Histogram calculated using DETX and DETY for each event in the final _common_clean file
| Quadrant A | 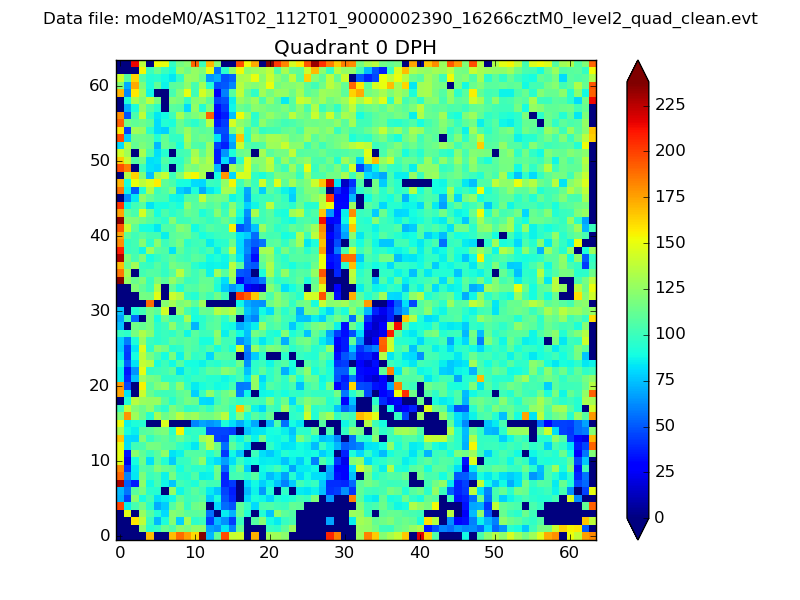 |
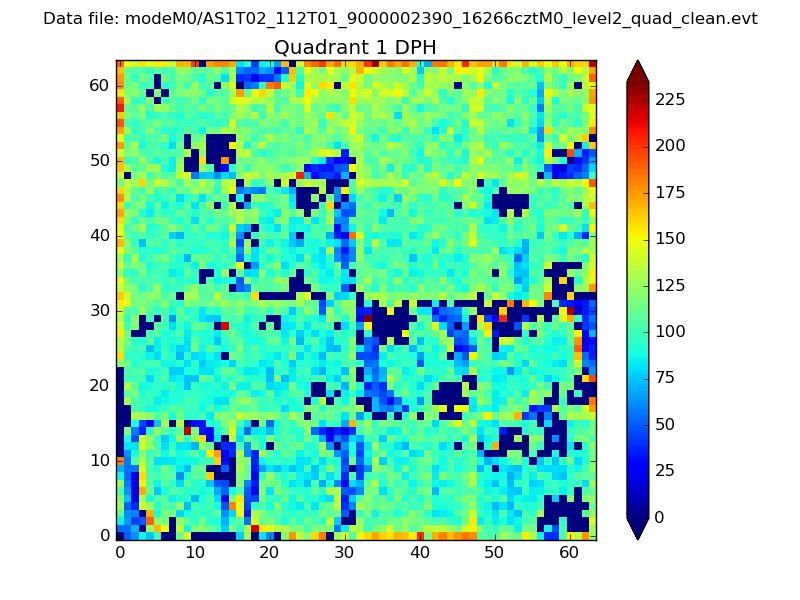 |
Quadrant B |
|---|---|---|---|
| Quadrant D | 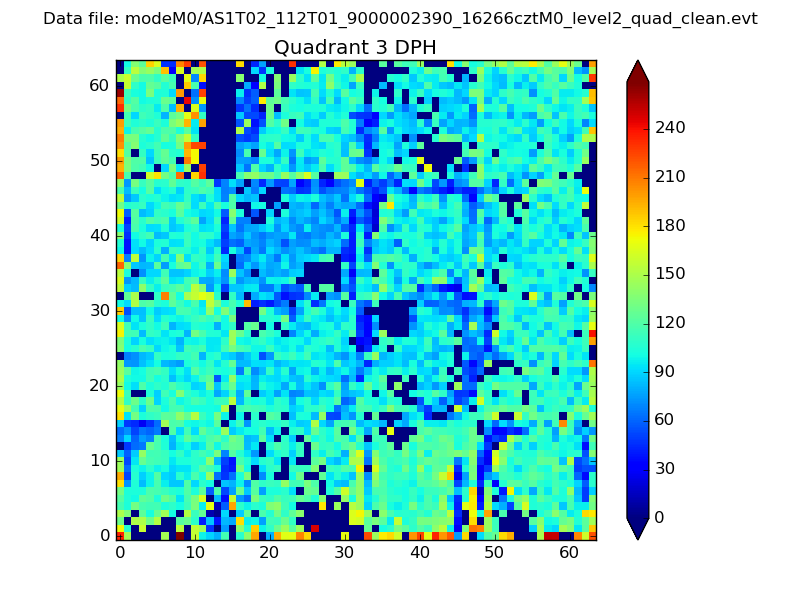 |
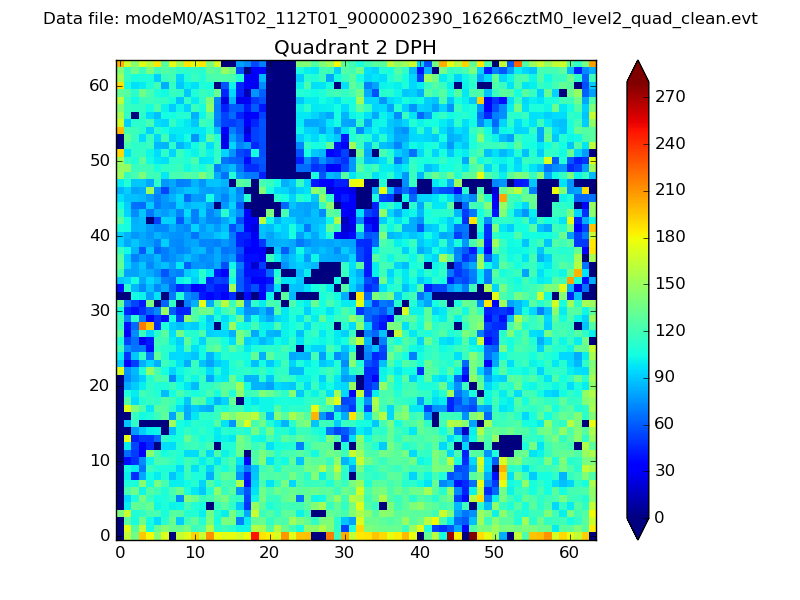 |
Quadrant C |
| Plot type | Count rate plots | Images |
|---|---|---|
| Comparison with Poisson distribution Blue bars denote a histogram of data divided into 1 sec bins. Red curve is a Poisson curve with rate = median count rate of data. |
 |
 |
| Quadrant-wise count rates Data is divided into 100 sec bins |
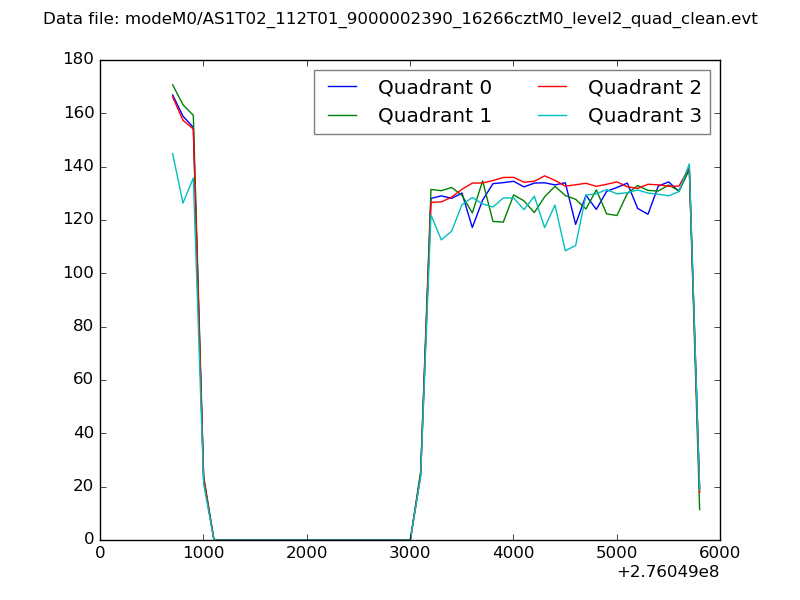 |
|
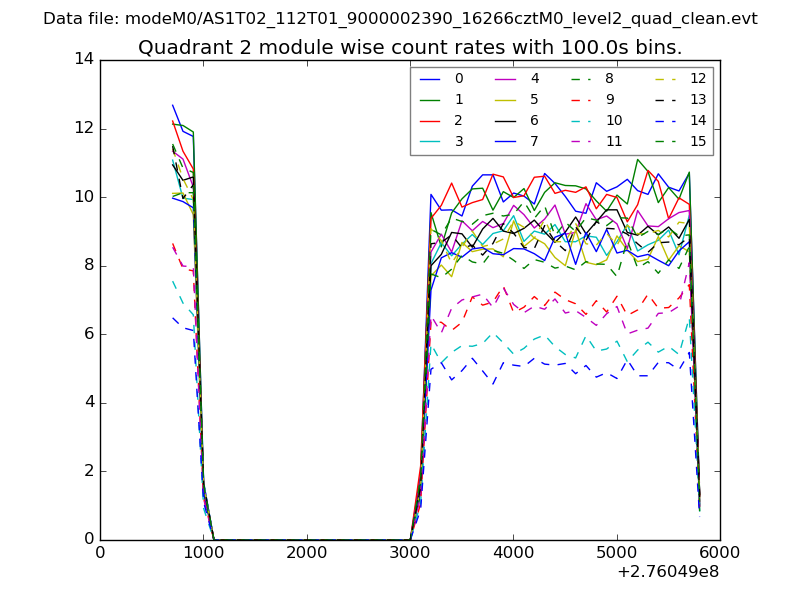
| Module-wise count rates for Quadrant A Data is divided into 100 sec bins |
 |
 |
| Module-wise count rates for Quadrant B Data is divided into 100 sec bins |
 |
 |
| Module-wise count rates for Quadrant C Data is divided into 100 sec bins |
 |
 |
| Module-wise count rates for Quadrant D Data is divided into 100 sec bins |
 |
 |
| Parameter | Plot |
|---|---|
| CZT HV Monitor | 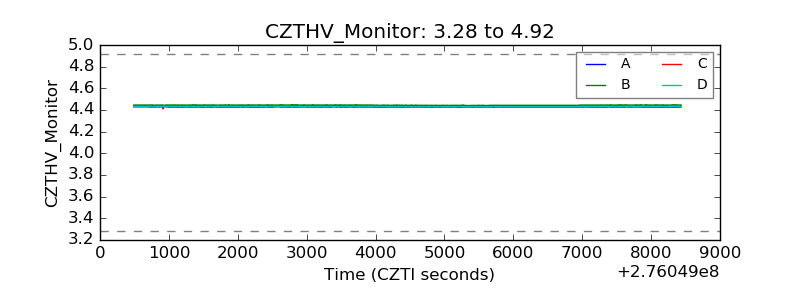 |
| D_VDD | 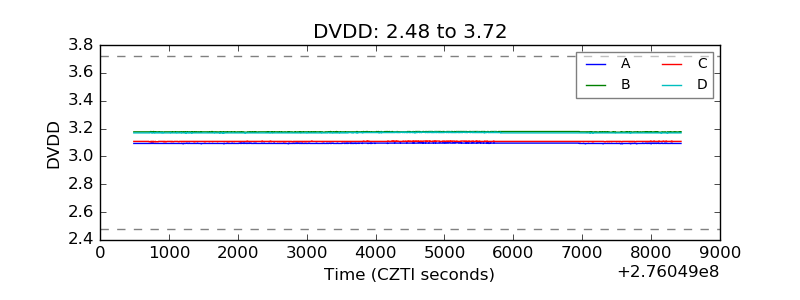 |
| Temperature 1 |  |
| Veto HV Monitor |  |
| Veto LLD | 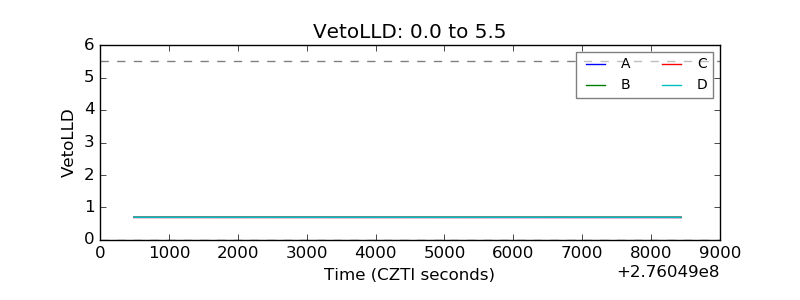 |
| Alpha Counter | 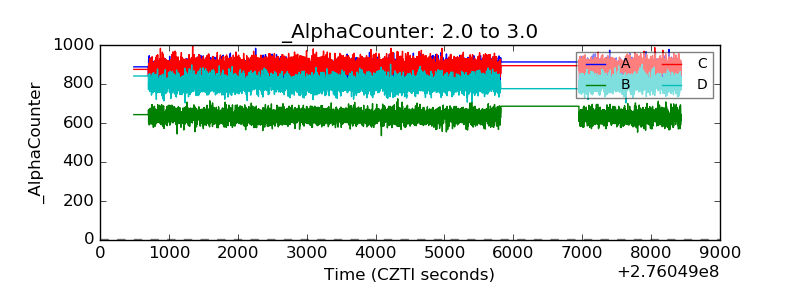 |
| _CPM_Rate | 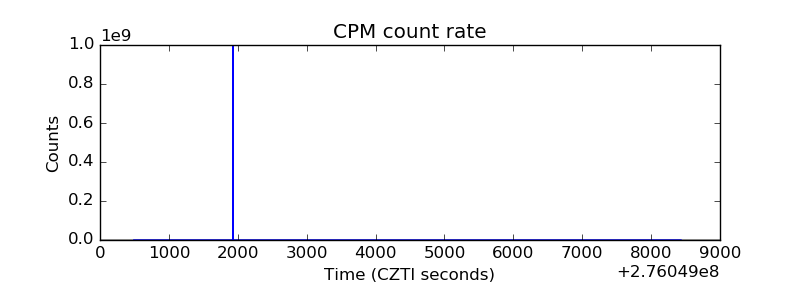 |
| CZT Counter | 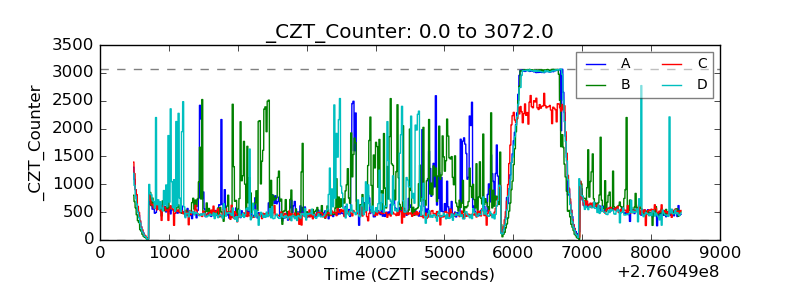 |
| +2.5 Volts monitor |  |
| +5 Volts monitor |  |
| _ROLL_ROT | 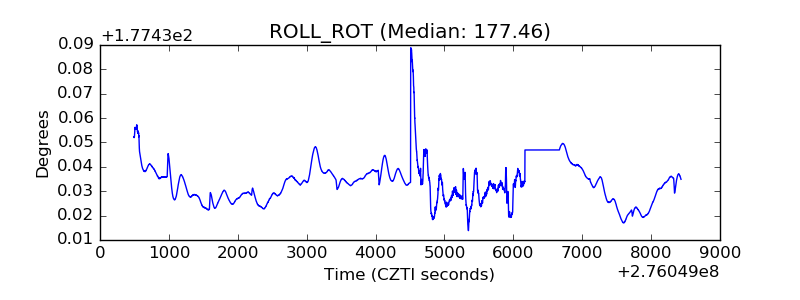 |
| _Roll_DEC |  |
| _Roll_RA | 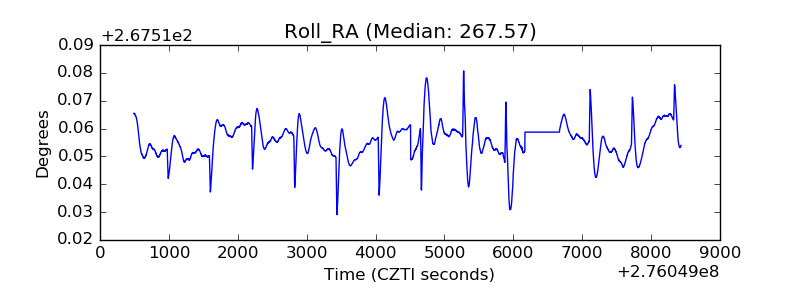 |
| Veto Counter |  |