| Param | Original file | Final file |
|---|---|---|
| Filename | modeM0/AS1T02_112T01_9000002390_16267cztM0_level2.evt | modeM0/AS1T02_112T01_9000002390_16267cztM0_level2_quad_clean.evt |
| Size (bytes) | 349,833,600 | 54,768,960 |
| Size | 333.6 MB | 52.2 MB |
| Events in quadrant A | 2,421,048 | 338,212 |
| Events in quadrant B | 3,186,435 | 331,750 |
| Events in quadrant C | 2,307,645 | 339,109 |
| Events in quadrant D | 2,370,995 | 330,478 |
| Mode SS | |||
|---|---|---|---|
| Quadrant | BADHDUFLAG | Total packets | Discarded packets |
| A | 0 | 90 | 0 |
| B | 0 | 90 | 0 |
| C | 0 | 90 | 0 |
| D | 0 | 90 | 0 |
| Mode M9 | |||
|---|---|---|---|
| Quadrant | BADHDUFLAG | Total packets | Discarded packets |
| A | 0 | 2 | 0 |
| B | 0 | 2 | 0 |
| C | 0 | 2 | 0 |
| D | 0 | 3 | 0 |
| Mode M0 | |||
|---|---|---|---|
| Quadrant | BADHDUFLAG | Total packets | Discarded packets |
| A | 0 | 9898 | 1 |
| B | 0 | 12271 | 1 |
| C | 0 | 9494 | 1 |
| D | 0 | 9822 | 1 |
| Quadrant | Total seconds | Saturated seconds | Saturation percentage |
|---|---|---|---|
| A | 4531 | 44 | 0.971088% |
| B | 4531 | 239 | 5.274774% |
| C | 4531 | 36 | 0.794527% |
| D | 4531 | 32 | 0.706246% |
Noise dominated data is calculated using 1-second bins in cleaned event files. If a bin has >2000 counts, and if more than 50% of those come from <1% of pixels, then it is considered to be noise-dominated and hence unusable.
| Quadrant | # 1 sec bins | Bins with >0 counts | Bins with >2000 counts | High rate bins dominated by noise | Noise dominated (total time) | Noise dominated (detector-on time) | Marked lightcurve |
|---|---|---|---|---|---|---|---|
| A | 4532 | 4532 | 16 | 16 | 0.35% | 0.35% | 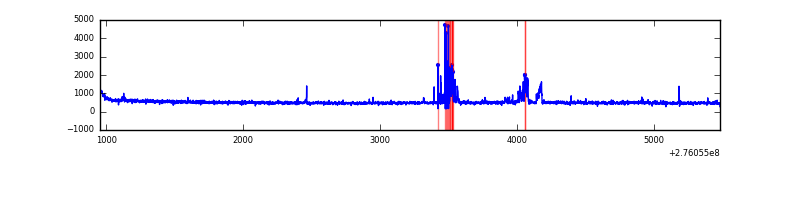 |
| B | 4532 | 4532 | 142 | 142 | 3.13% | 3.13% | 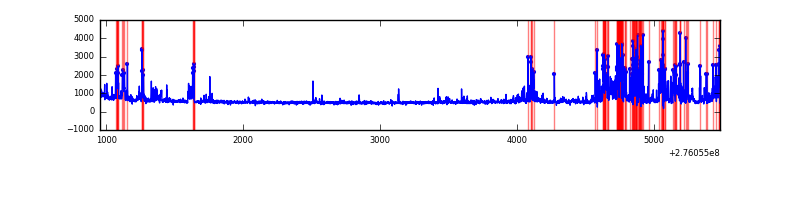 |
| C | 4532 | 4532 | 0 | 0 | 0.00% | 0.00% | 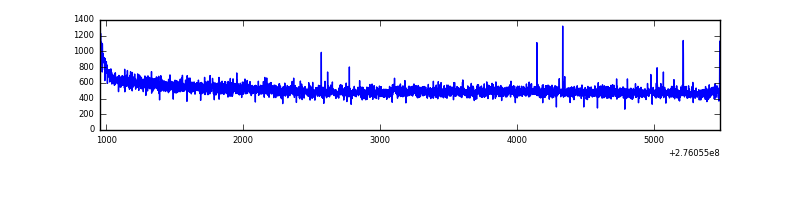 |
| D | 4532 | 4532 | 22 | 22 | 0.49% | 0.49% | 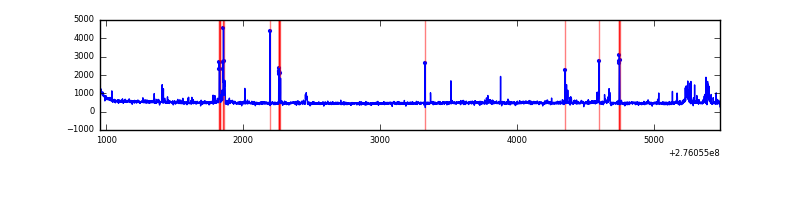 |
Top three noisy pixels from each quadrant. If the there are fewer than three noisy pixels in the level2.evt file, extra rows are filled as -1
| Pixel properties | Quadrant properties | ||||||
|---|---|---|---|---|---|---|---|
| Quadrant | DetID | PixID | Counts | Sigma | Mean | Median | Sigma |
| A | 15 | 174 | 156236 | 1335.09 | 582 | 572 | 116.6 |
| A | 9 | 143 | 12933 | 106.02 | 582 | 572 | 116.6 |
| A | 14 | 4 | 12392 | 101.38 | 582 | 572 | 116.6 |
| B | 3 | 112 | 601447 | 5536.32 | 574 | 561 | 108.5 |
| B | 7 | 220 | 140641 | 1290.64 | 574 | 561 | 108.5 |
| B | 0 | 198 | 38664 | 351.07 | 574 | 561 | 108.5 |
| C | 14 | 238 | 88504 | 674.47 | 561 | 566 | 130.4 |
| C | 3 | 233 | 19583 | 145.86 | 561 | 566 | 130.4 |
| C | 0 | 207 | 10919 | 79.41 | 561 | 566 | 130.4 |
| D | 1 | 52 | 158336 | 1158.3 | 567 | 553 | 136.2 |
| D | 13 | 112 | 49681 | 360.65 | 567 | 553 | 136.2 |
| D | 2 | 234 | 18079 | 128.66 | 567 | 553 | 136.2 |
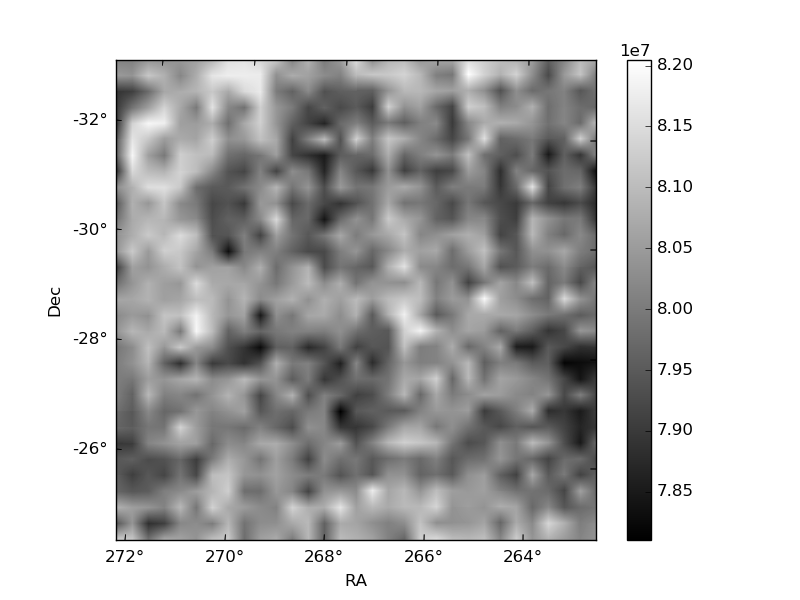
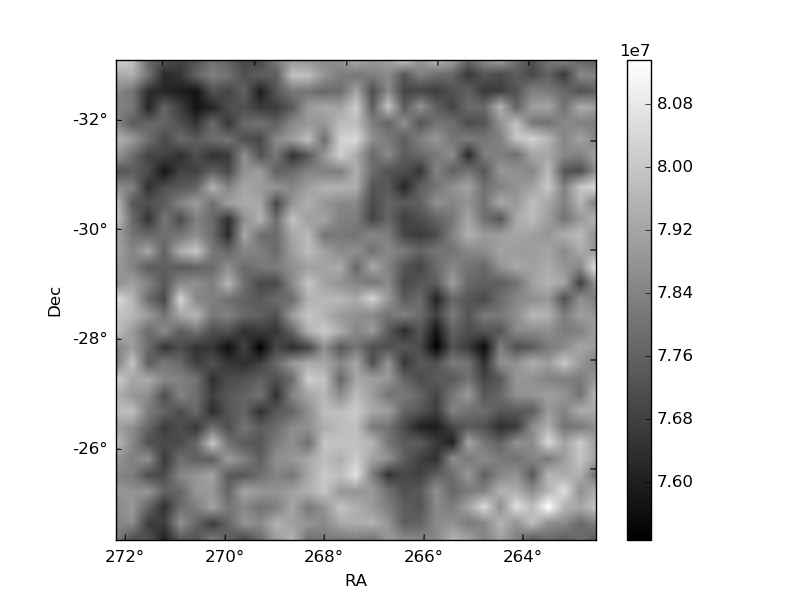
Histogram calculated using DETX and DETY for each event in the final _common_clean file
| Quadrant A | 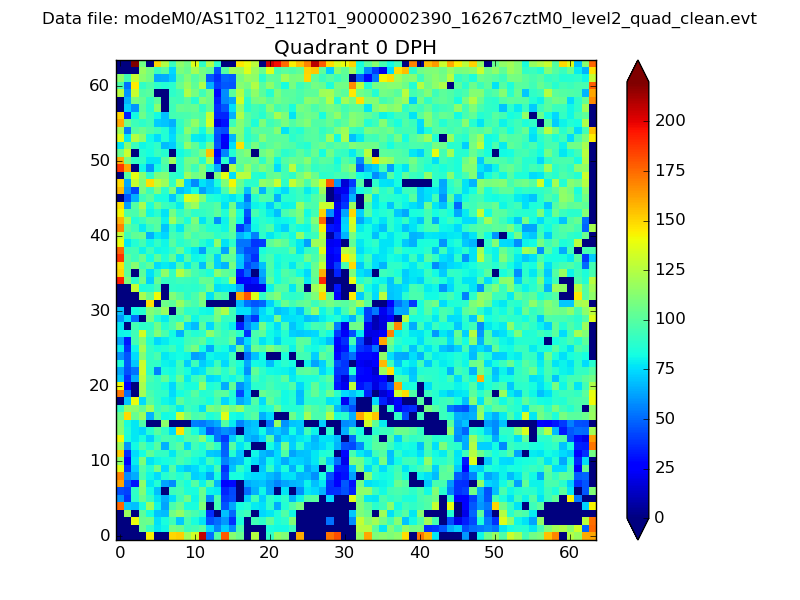 |
 |
Quadrant B |
|---|---|---|---|
| Quadrant D |  |
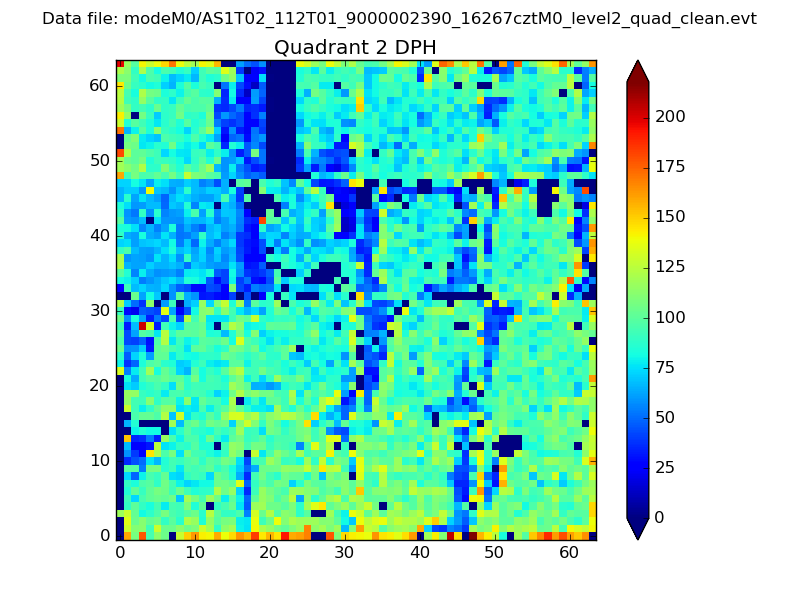 |
Quadrant C |
| Plot type | Count rate plots | Images |
|---|---|---|
| Comparison with Poisson distribution Blue bars denote a histogram of data divided into 1 sec bins. Red curve is a Poisson curve with rate = median count rate of data. |
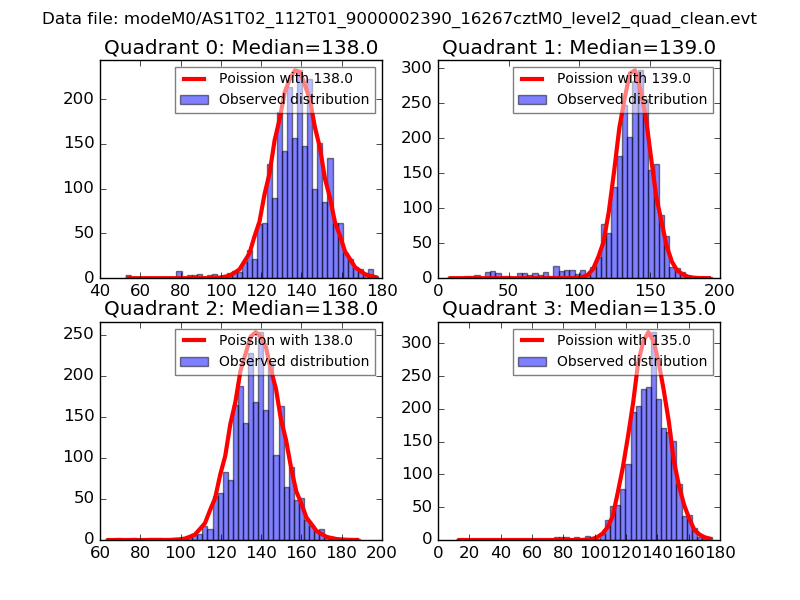 |
 |
| Quadrant-wise count rates Data is divided into 100 sec bins |
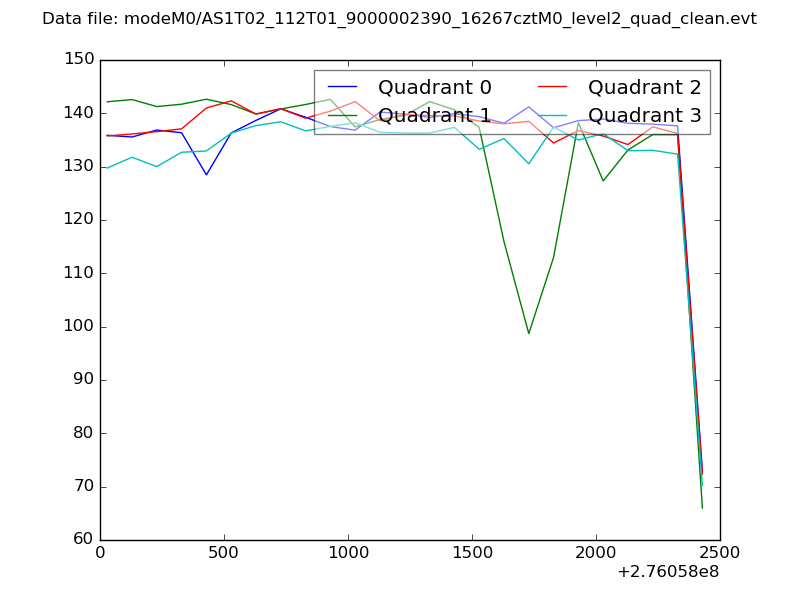 |
|
| Module-wise count rates for Quadrant A Data is divided into 100 sec bins |
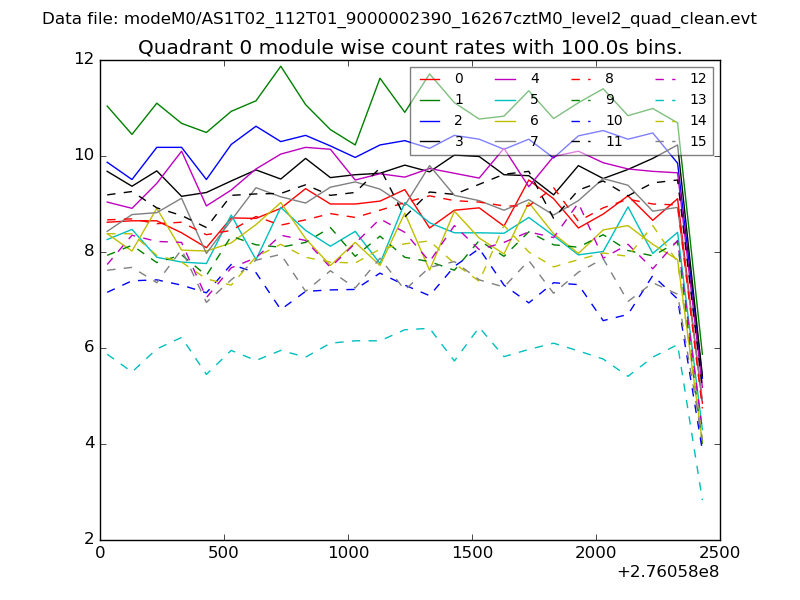 |
 |
| Module-wise count rates for Quadrant B Data is divided into 100 sec bins |
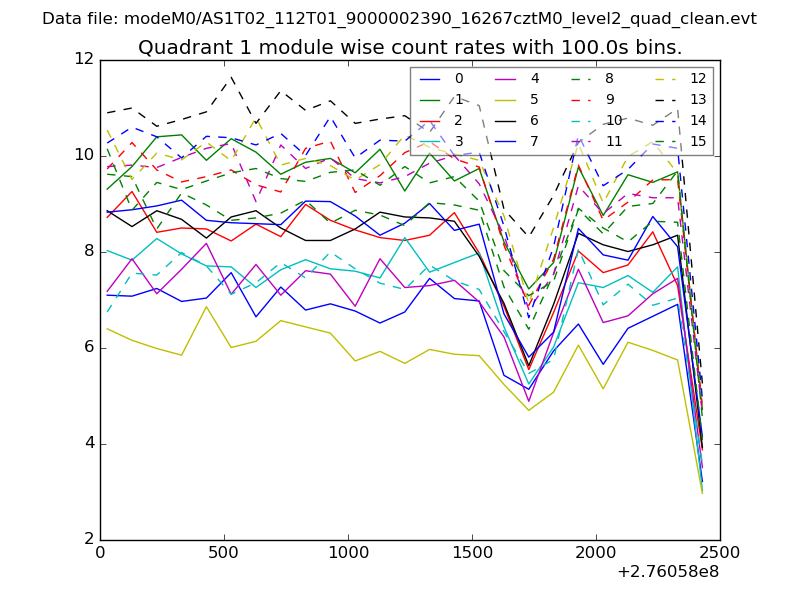 |
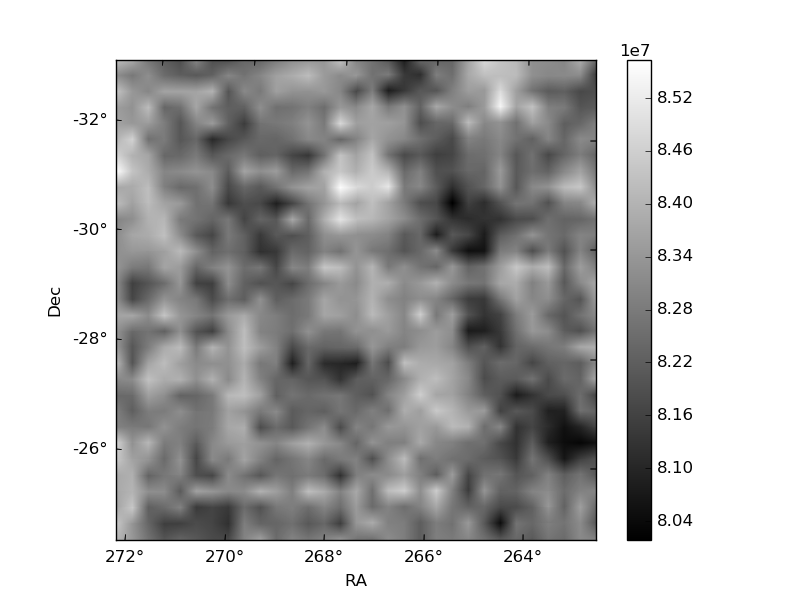 |
| Module-wise count rates for Quadrant C Data is divided into 100 sec bins |
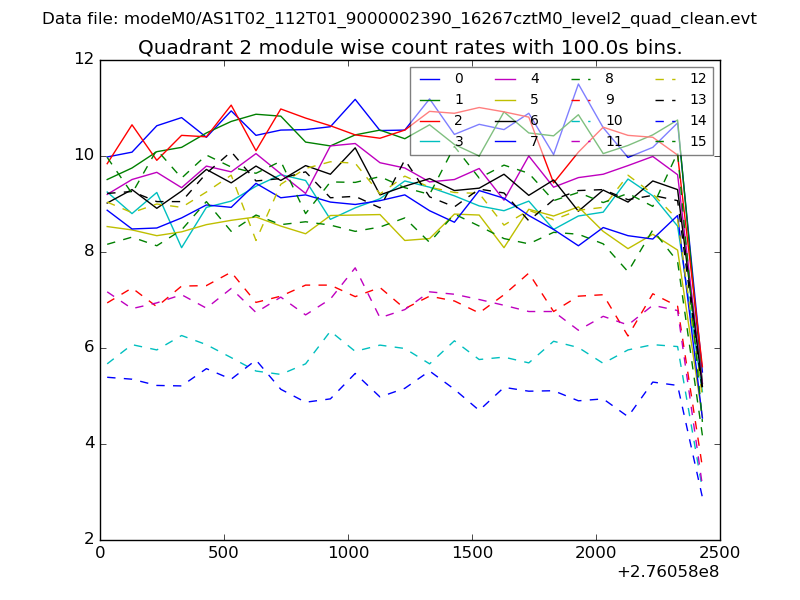 |
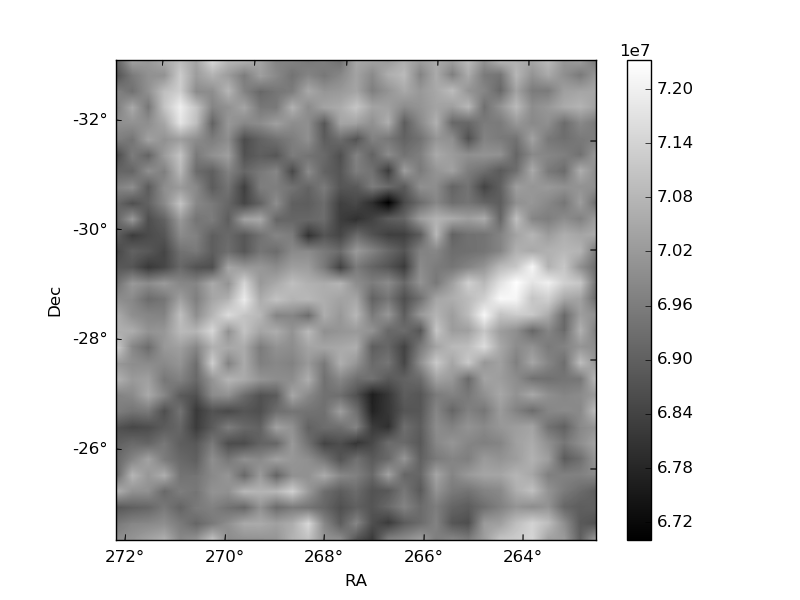 |
| Module-wise count rates for Quadrant D Data is divided into 100 sec bins |
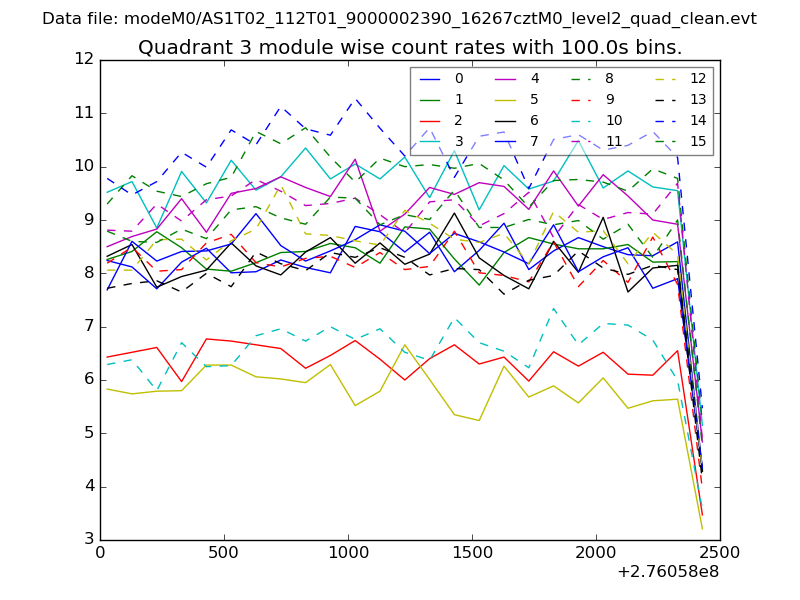 |
 |
| Parameter | Plot |
|---|---|
| CZT HV Monitor | 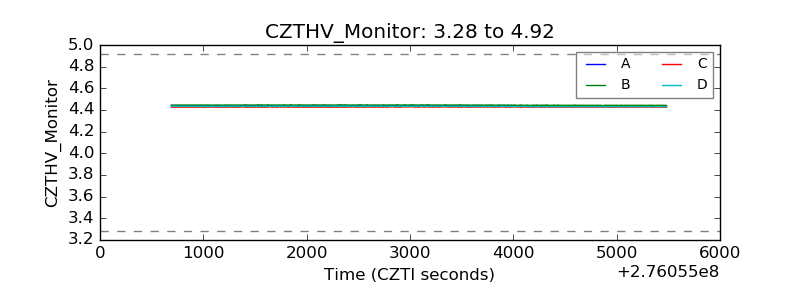 |
| D_VDD | 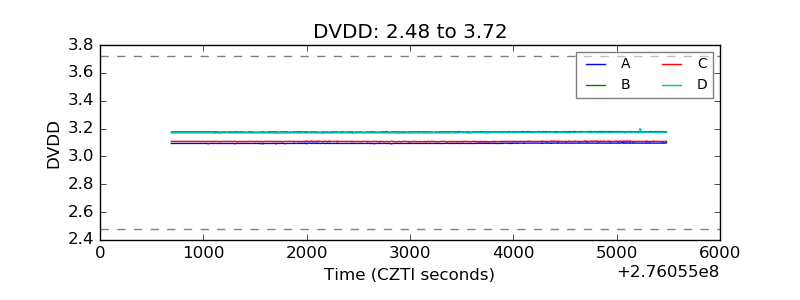 |
| Temperature 1 | 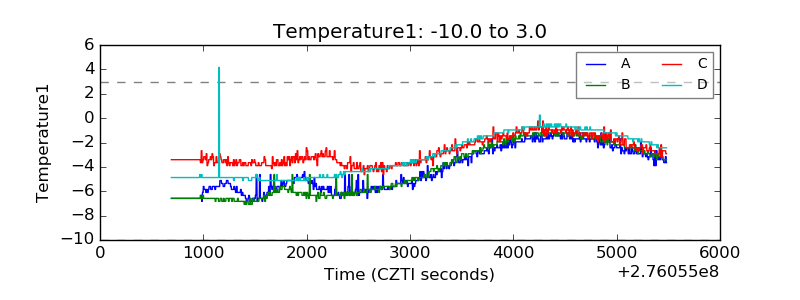 |
| Veto HV Monitor | 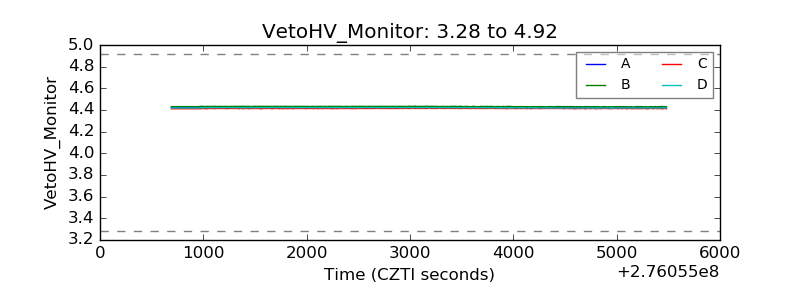 |
| Veto LLD | 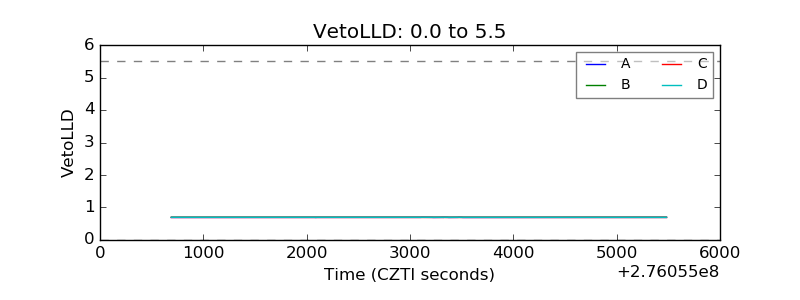 |
| Alpha Counter | 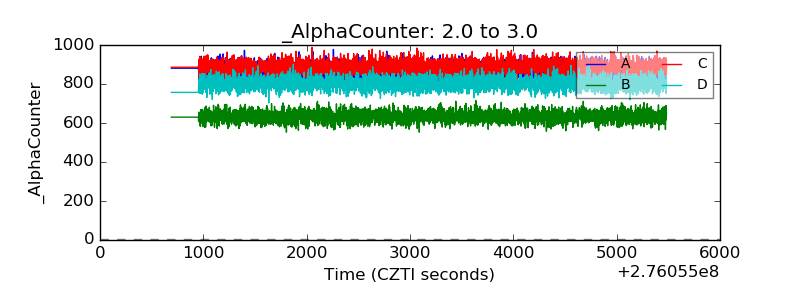 |
| _CPM_Rate | 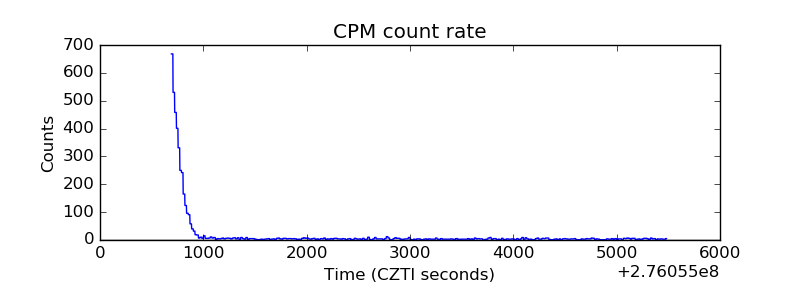 |
| CZT Counter | 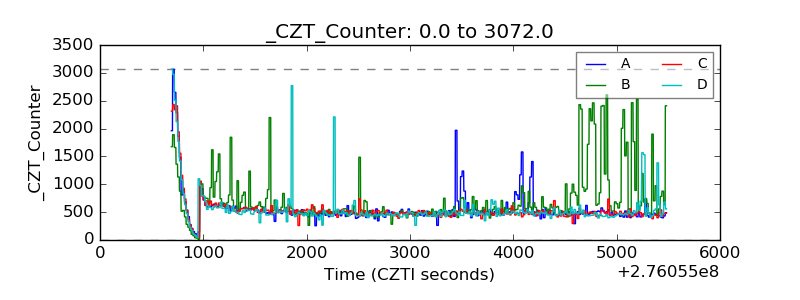 |
| +2.5 Volts monitor |  |
| +5 Volts monitor |  |
| _ROLL_ROT | 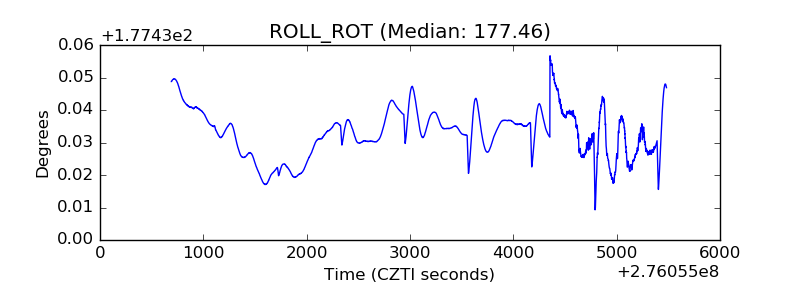 |
| _Roll_DEC | 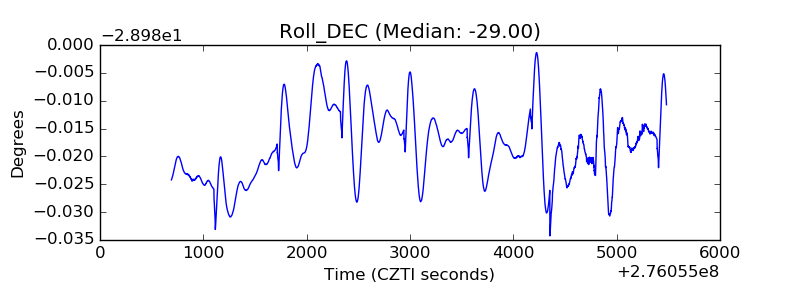 |
| _Roll_RA | 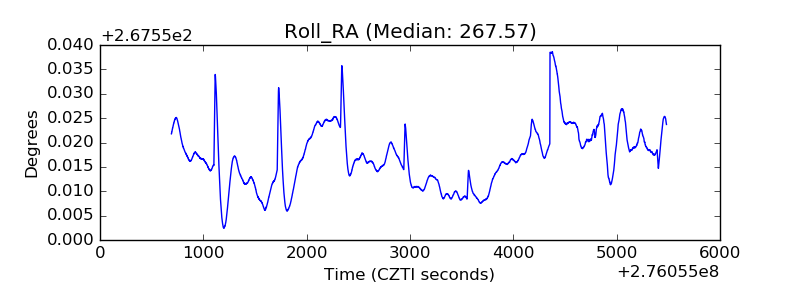 |
| Veto Counter | 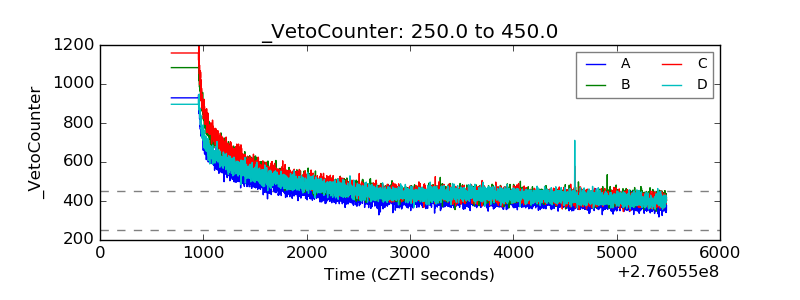 |