| Param | Original file | Final file |
|---|---|---|
| Filename | modeM0/AS1A05_072T05_9000002394cztM0_level2.fits | modeM0/AS1A05_072T05_9000002394cztM0_level2_quad_clean.evt |
| Size (bytes) | 751,328,640 | 688,717,440 |
| Size | 716.5 MB | 656.8 MB |
| Events in quadrant A | 4,621,814 | 4,000,128 |
| Events in quadrant B | 4,406,910 | 4,021,304 |
| Events in quadrant C | 4,547,554 | 3,999,196 |
| Events in quadrant D | 3,994,002 | 3,653,324 |
| Mode SS | |||
|---|---|---|---|
| Quadrant | BADHDUFLAG | Total packets | Discarded packets |
| A | 0 | 1540 | 0 |
| B | 0 | 1540 | 0 |
| C | 0 | 1540 | 0 |
| D | 0 | 1540 | 0 |
| Mode M9 | |||
|---|---|---|---|
| Quadrant | BADHDUFLAG | Total packets | Discarded packets |
| A | 0 | 118 | 0 |
| B | 0 | 118 | 0 |
| C | 0 | 118 | 0 |
| D | 0 | 118 | 0 |
| Mode M0 | |||
|---|---|---|---|
| Quadrant | BADHDUFLAG | Total packets | Discarded packets |
| A | 0 | 167158 | 0 |
| B | 0 | 176197 | 0 |
| C | 0 | 160783 | 0 |
| D | 0 | 175002 | 0 |
| Quadrant | Total seconds | Saturated seconds | Saturation percentage |
|---|---|---|---|
| A | 75584 | 1543 | 2.041437% |
| B | 75584 | 2256 | 2.984759% |
| C | 75584 | 1405 | 1.858859% |
| D | 75584 | 1576 | 2.085097% |
Noise dominated data is calculated using 1-second bins in cleaned event files. If a bin has >2000 counts, and if more than 50% of those come from <1% of pixels, then it is considered to be noise-dominated and hence unusable.
| Quadrant | # 1 sec bins | Bins with >0 counts | Bins with >2000 counts | High rate bins dominated by noise | Noise dominated (total time) | Noise dominated (detector-on time) | Marked lightcurve |
|---|---|---|---|---|---|---|---|
| A | 87554 | 75582 | 0 | 0 | 0.00% | 0.00% |  |
| B | 87554 | 75569 | 0 | 0 | 0.00% | 0.00% |  |
| C | 87554 | 75578 | 0 | 0 | 0.00% | 0.00% |  |
| D | 87554 | 75565 | 0 | 0 | 0.00% | 0.00% | 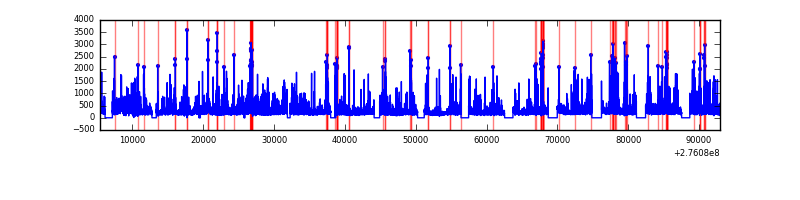 |
Top three noisy pixels from each quadrant. If the there are fewer than three noisy pixels in the level2.evt file, extra rows are filled as -1
| Pixel properties | Quadrant properties | ||||||
|---|---|---|---|---|---|---|---|
| Quadrant | DetID | PixID | Counts | Sigma | Mean | Median | Sigma |
| A | 0 | 29 | 4429 | 11.23 | 1200 | 1125 | 294.2 |
| A | 7 | 110 | 3694 | 8.73 | 1200 | 1125 | 294.2 |
| A | 0 | 30 | 3497 | 8.06 | 1200 | 1125 | 294.2 |
| B | 2 | 9 | 3583 | 10.8 | 1166 | 1113 | 228.7 |
| B | 2 | 8 | 2999 | 8.25 | 1166 | 1113 | 228.7 |
| B | 3 | 17 | 2878 | 7.72 | 1166 | 1113 | 228.7 |
| C | 1 | 80 | 3357 | 7.26 | 1200 | 1122 | 308.1 |
| C | 1 | 81 | 3347 | 7.22 | 1200 | 1122 | 308.1 |
| C | 12 | 241 | 3100 | 6.42 | 1200 | 1122 | 308.1 |
| D | 6 | 231 | 2915 | 6.18 | 1138 | 1038 | 303.8 |
| D | 3 | 14 | 2856 | 5.98 | 1138 | 1038 | 303.8 |
| D | 7 | 3 | 2799 | 5.8 | 1138 | 1038 | 303.8 |
Histogram calculated using DETX and DETY for each event in the final _common_clean file
| Quadrant A | 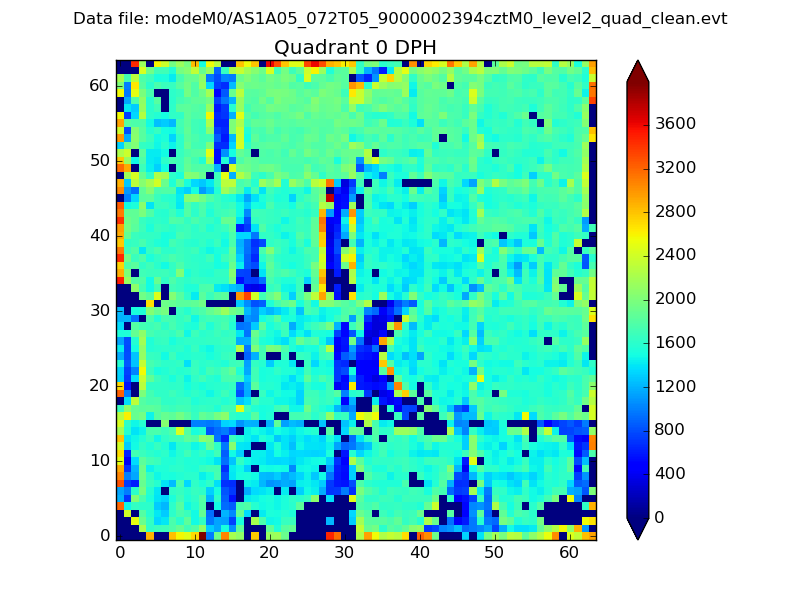 |
 |
Quadrant B |
|---|---|---|---|
| Quadrant D |  |
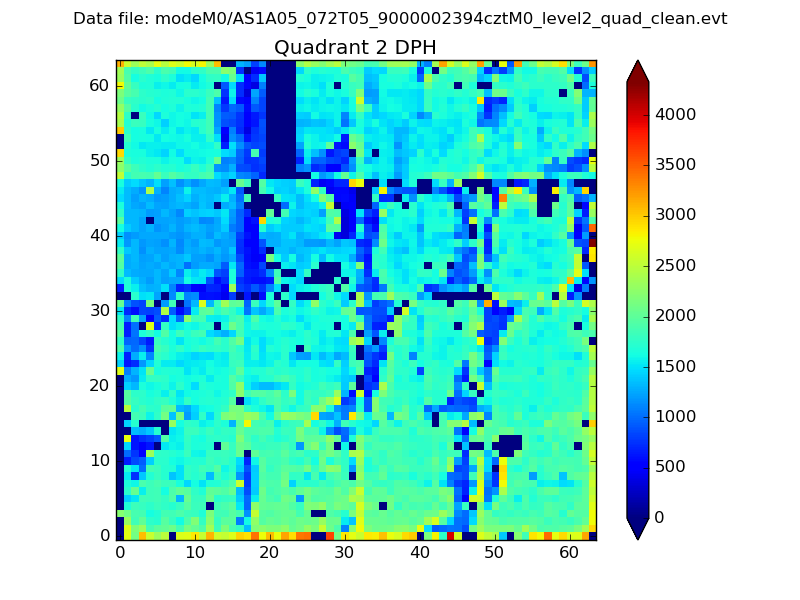 |
Quadrant C |
| Plot type | Count rate plots | Images |
|---|---|---|
| Comparison with Poisson distribution Blue bars denote a histogram of data divided into 1 sec bins. Red curve is a Poisson curve with rate = median count rate of data. |
 |
 |
| Quadrant-wise count rates Data is divided into 100 sec bins |
 |
|
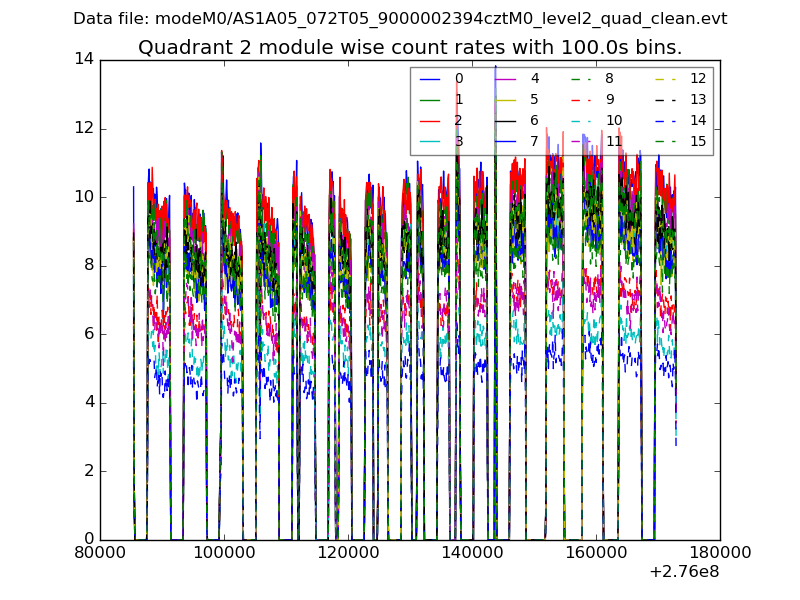
| Module-wise count rates for Quadrant A Data is divided into 100 sec bins |
 |
 |
| Module-wise count rates for Quadrant B Data is divided into 100 sec bins |
 |
 |
| Module-wise count rates for Quadrant C Data is divided into 100 sec bins |
 |
 |
| Module-wise count rates for Quadrant D Data is divided into 100 sec bins |
 |
 |
| Parameter | Plot |
|---|---|
| CZT HV Monitor | 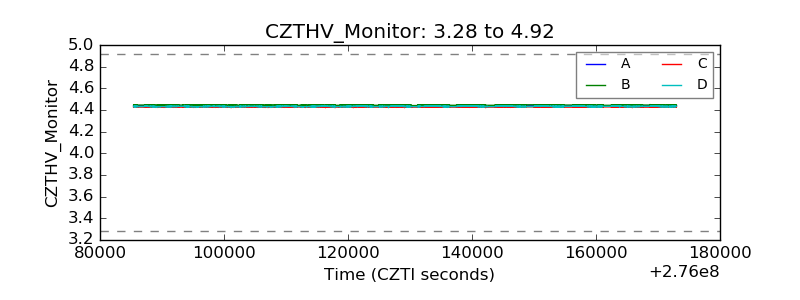 |
| D_VDD | 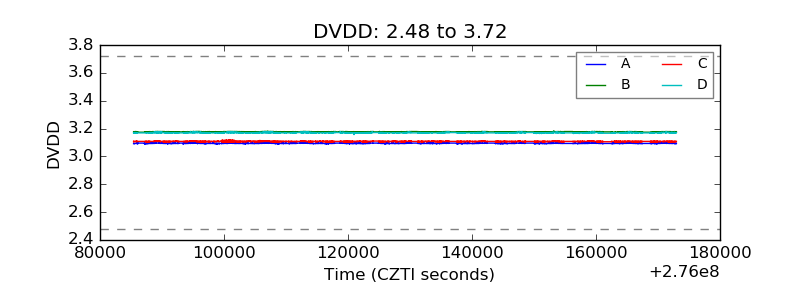 |
| Temperature 1 |  |
| Veto HV Monitor | 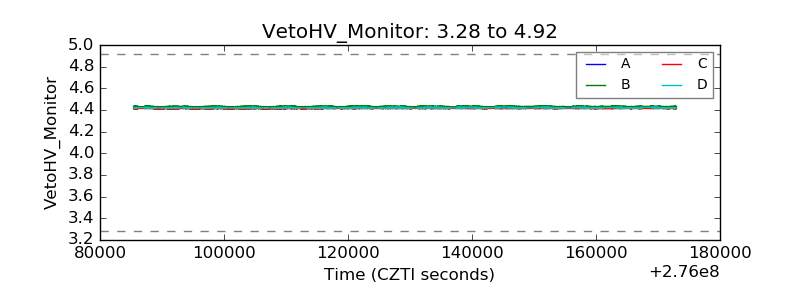 |
| Veto LLD |  |
| Alpha Counter | 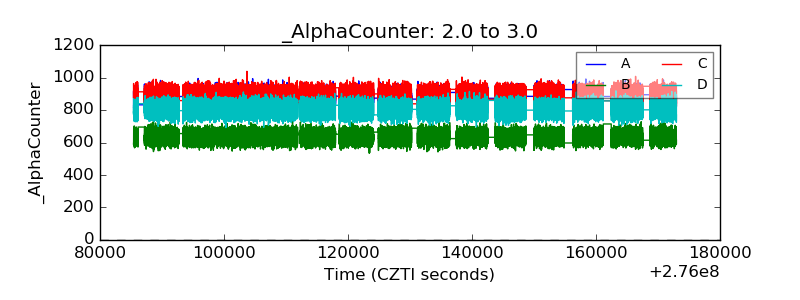 |
| _CPM_Rate |  |
| CZT Counter |  |
| +2.5 Volts monitor |  |
| +5 Volts monitor |  |
| _ROLL_ROT | 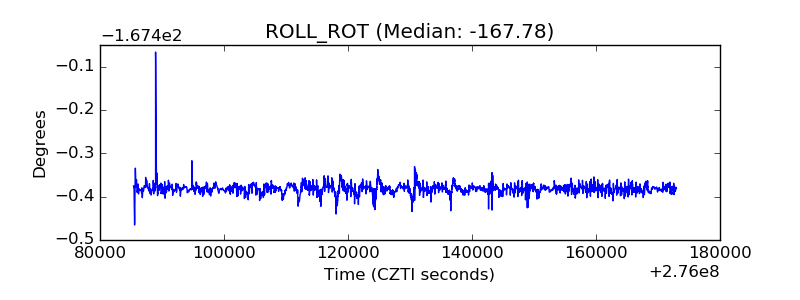 |
| _Roll_DEC | 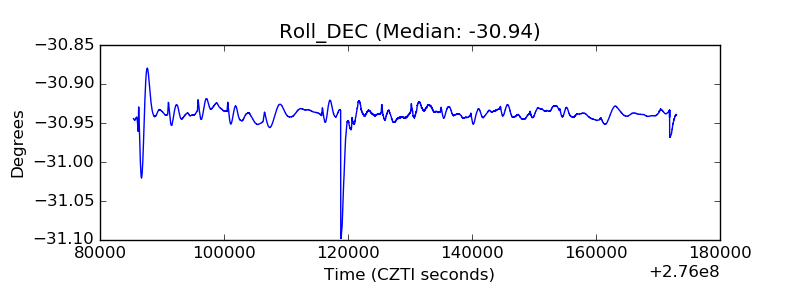 |
| _Roll_RA |  |
| Veto Counter |  |