| Param | Original file | Final file |
|---|---|---|
| Filename | modeM0/AS1A05_072T05_9000002394_16271cztM0_level2.evt | modeM0/AS1A05_072T05_9000002394_16271cztM0_level2_quad_clean.evt |
| Size (bytes) | 208,630,080 | 21,484,800 |
| Size | 199.0 MB | 20.5 MB |
| Events in quadrant A | 1,196,066 | 128,466 |
| Events in quadrant B | 2,390,630 | 113,510 |
| Events in quadrant C | 1,190,768 | 129,786 |
| Events in quadrant D | 1,396,232 | 125,808 |
| Mode SS | |||
|---|---|---|---|
| Quadrant | BADHDUFLAG | Total packets | Discarded packets |
| A | 0 | 44 | 0 |
| B | 0 | 44 | 0 |
| C | 0 | 44 | 0 |
| D | 0 | 44 | 0 |
| Mode M9 | |||
|---|---|---|---|
| Quadrant | BADHDUFLAG | Total packets | Discarded packets |
| A | 0 | 10 | 0 |
| B | 0 | 10 | 0 |
| C | 0 | 10 | 0 |
| D | 0 | 10 | 0 |
| Mode M0 | |||
|---|---|---|---|
| Quadrant | BADHDUFLAG | Total packets | Discarded packets |
| A | 0 | 4751 | 2 |
| B | 0 | 8535 | 1 |
| C | 0 | 4826 | 1 |
| D | 0 | 5582 | 1 |
| Quadrant | Total seconds | Saturated seconds | Saturation percentage |
|---|---|---|---|
| A | 2099 | 89 | 4.240114% |
| B | 2099 | 590 | 28.108623% |
| C | 2099 | 100 | 4.764173% |
| D | 2099 | 84 | 4.001906% |
Noise dominated data is calculated using 1-second bins in cleaned event files. If a bin has >2000 counts, and if more than 50% of those come from <1% of pixels, then it is considered to be noise-dominated and hence unusable.
| Quadrant | # 1 sec bins | Bins with >0 counts | Bins with >2000 counts | High rate bins dominated by noise | Noise dominated (total time) | Noise dominated (detector-on time) | Marked lightcurve |
|---|---|---|---|---|---|---|---|
| A | 3140 | 2101 | 5 | 5 | 0.16% | 0.24% | 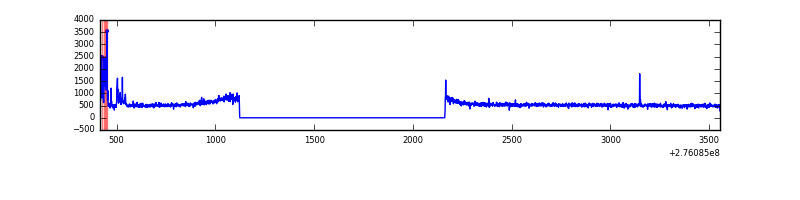 |
| B | 3140 | 2101 | 266 | 266 | 8.47% | 12.66% | 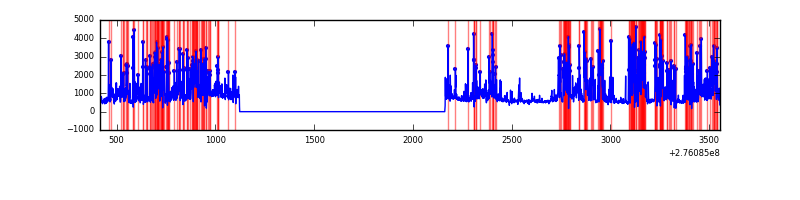 |
| C | 3140 | 2101 | 0 | 0 | 0.00% | 0.00% | 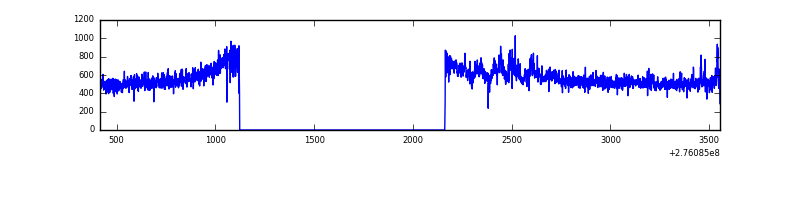 |
| D | 3140 | 2101 | 13 | 13 | 0.41% | 0.62% | 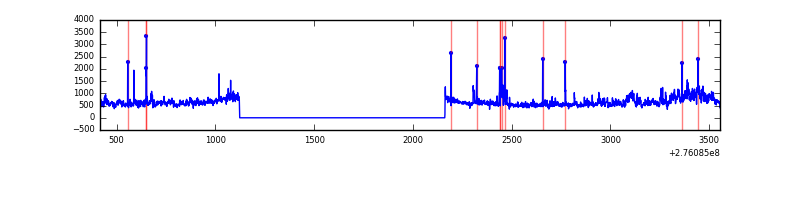 |
Top three noisy pixels from each quadrant. If the there are fewer than three noisy pixels in the level2.evt file, extra rows are filled as -1
| Pixel properties | Quadrant properties | ||||||
|---|---|---|---|---|---|---|---|
| Quadrant | DetID | PixID | Counts | Sigma | Mean | Median | Sigma |
| A | 15 | 174 | 65448 | 1074.75 | 292 | 285 | 60.6 |
| A | 9 | 143 | 6963 | 110.14 | 292 | 285 | 60.6 |
| A | 0 | 226 | 2551 | 37.37 | 292 | 285 | 60.6 |
| B | 3 | 112 | 1269399 | 24068.83 | 262 | 256 | 52.7 |
| B | 3 | 64 | 41402 | 780.32 | 262 | 256 | 52.7 |
| B | 15 | 35 | 18995 | 355.38 | 262 | 256 | 52.7 |
| C | 3 | 233 | 52863 | 783.17 | 280 | 281 | 67.1 |
| C | 14 | 238 | 42575 | 629.94 | 280 | 281 | 67.1 |
| C | 13 | 61 | 1973 | 25.2 | 280 | 281 | 67.1 |
| D | 1 | 52 | 268328 | 3741.24 | 286 | 277 | 71.6 |
| D | 10 | 70 | 31436 | 434.89 | 286 | 277 | 71.6 |
| D | 15 | 0 | 7312 | 98.19 | 286 | 277 | 71.6 |
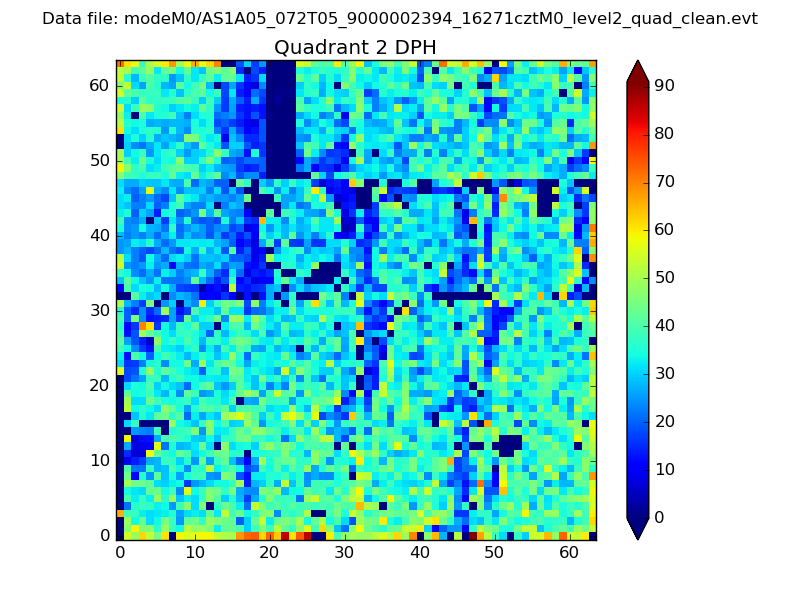
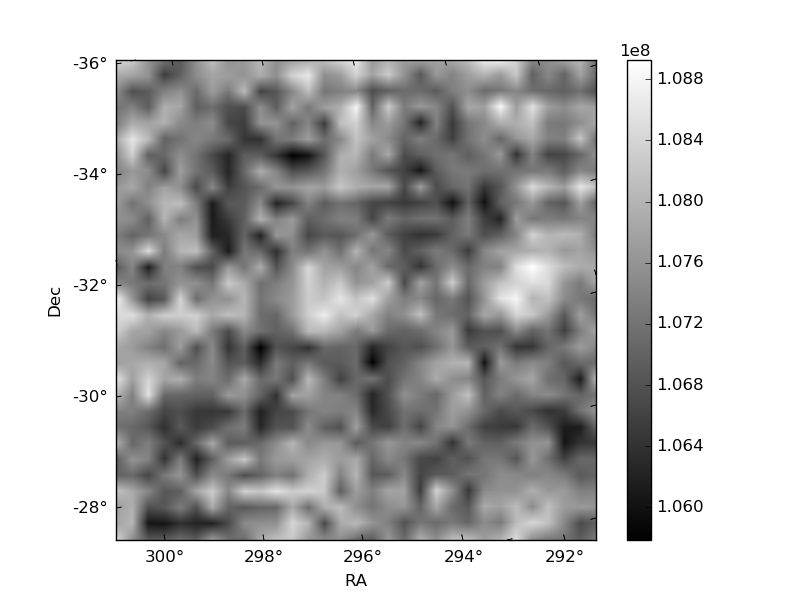
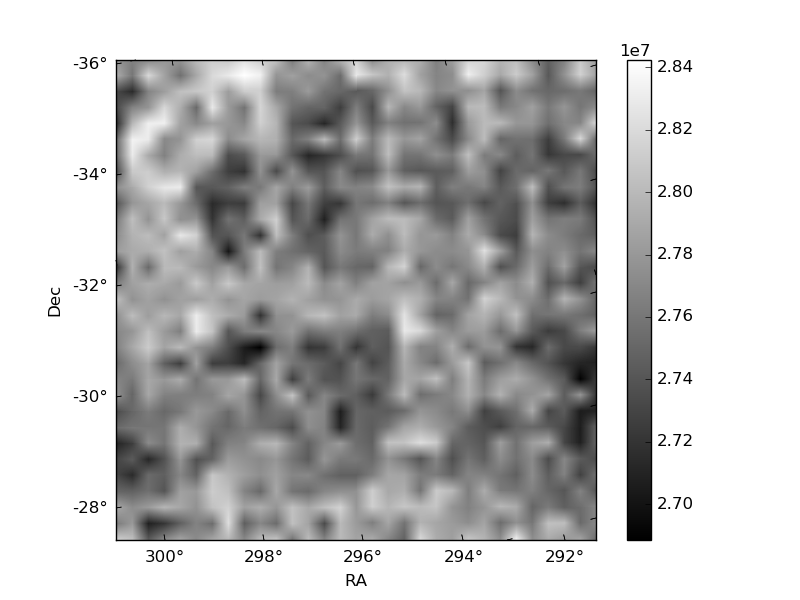
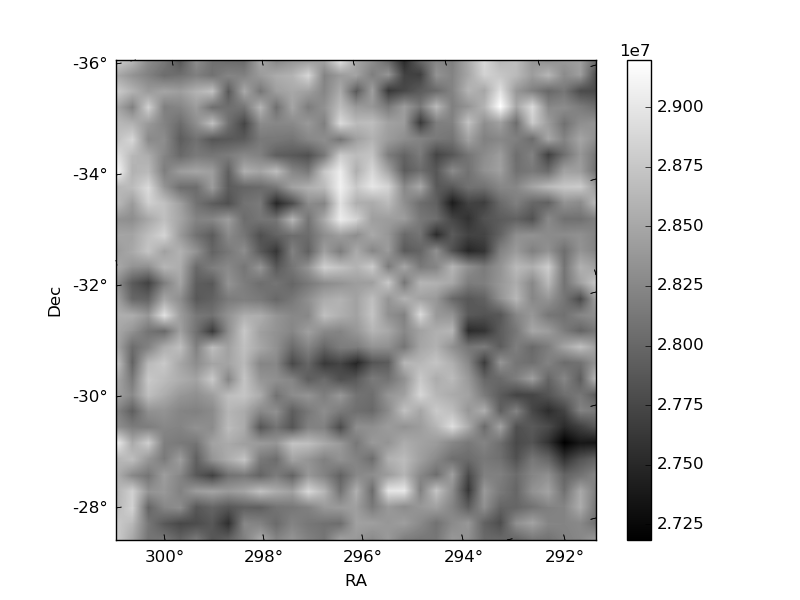
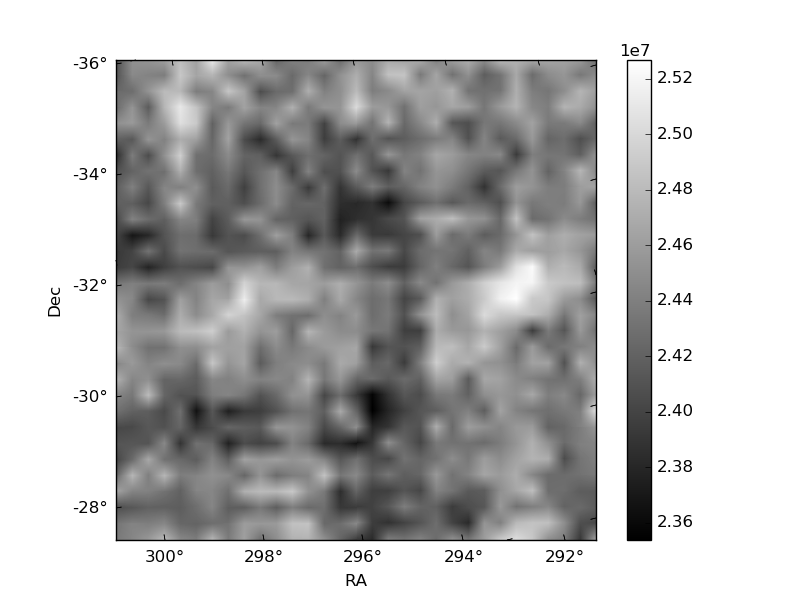
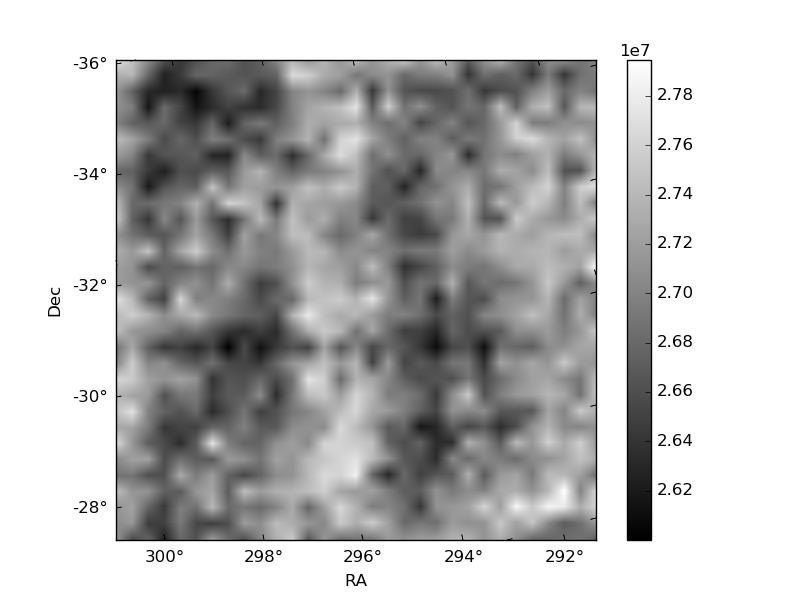
Histogram calculated using DETX and DETY for each event in the final _common_clean file
| Quadrant A | 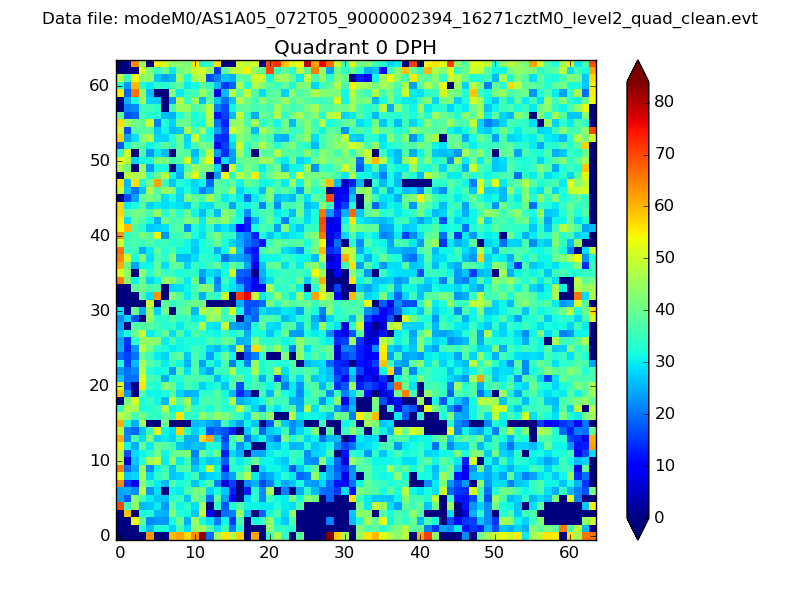 |
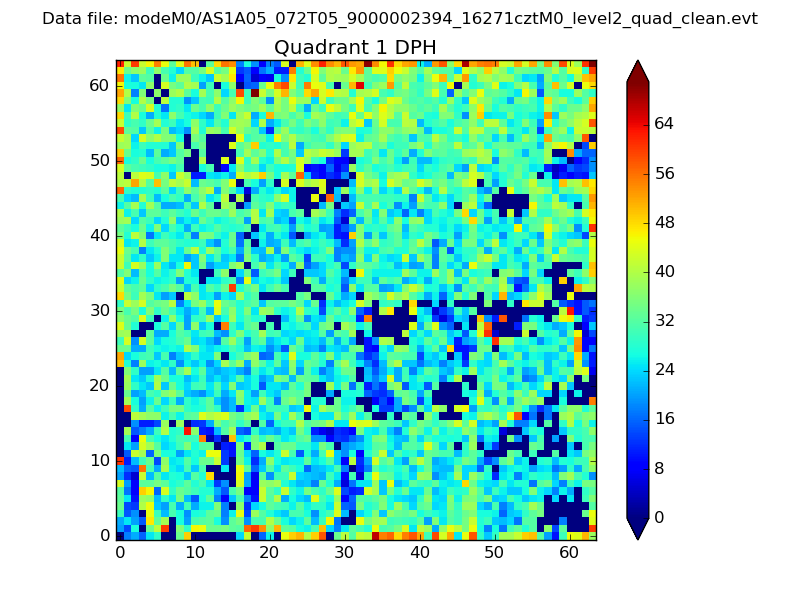 |
Quadrant B |
|---|---|---|---|
| Quadrant D | 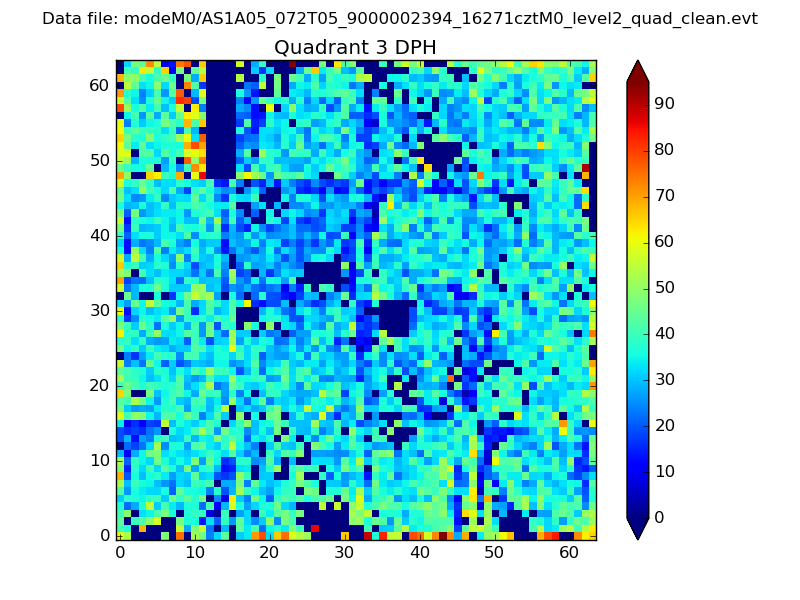 |
 |
Quadrant C |
| Plot type | Count rate plots | Images |
|---|---|---|
| Comparison with Poisson distribution Blue bars denote a histogram of data divided into 1 sec bins. Red curve is a Poisson curve with rate = median count rate of data. |
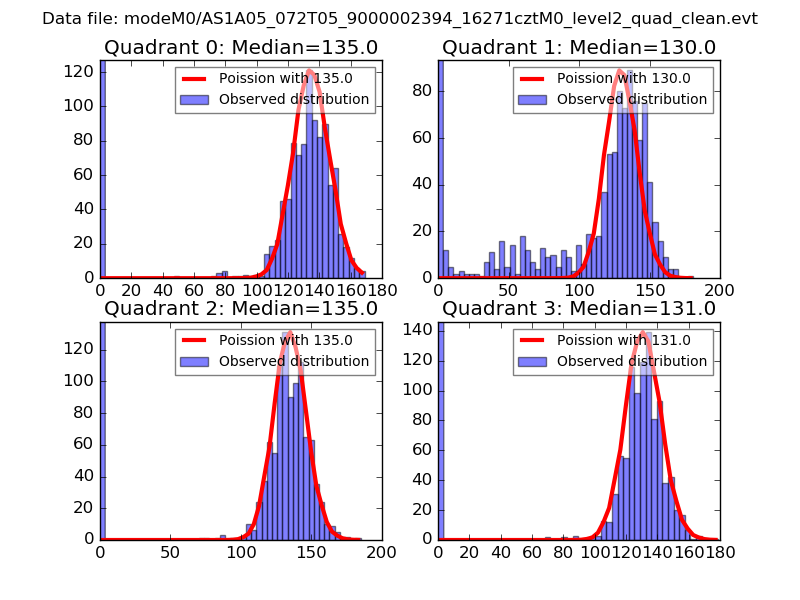 |
 |
| Quadrant-wise count rates Data is divided into 100 sec bins |
 |
|
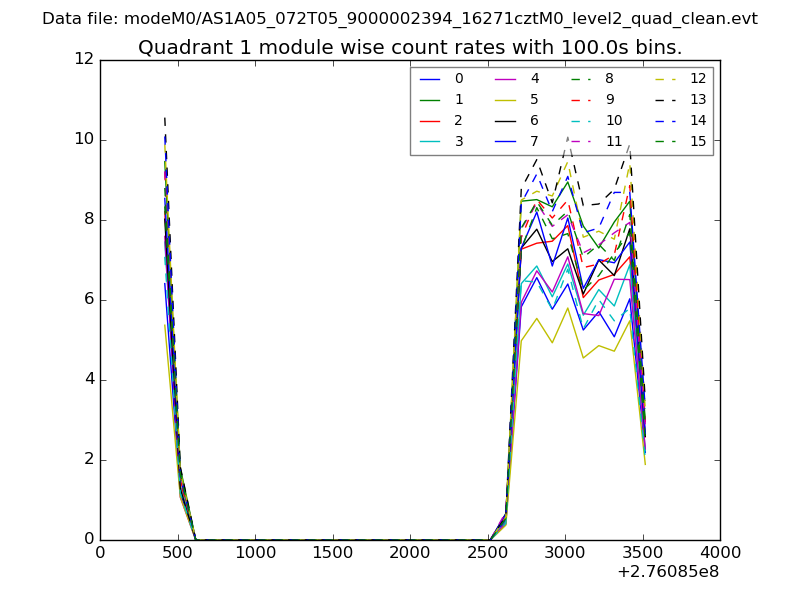
| Module-wise count rates for Quadrant A Data is divided into 100 sec bins |
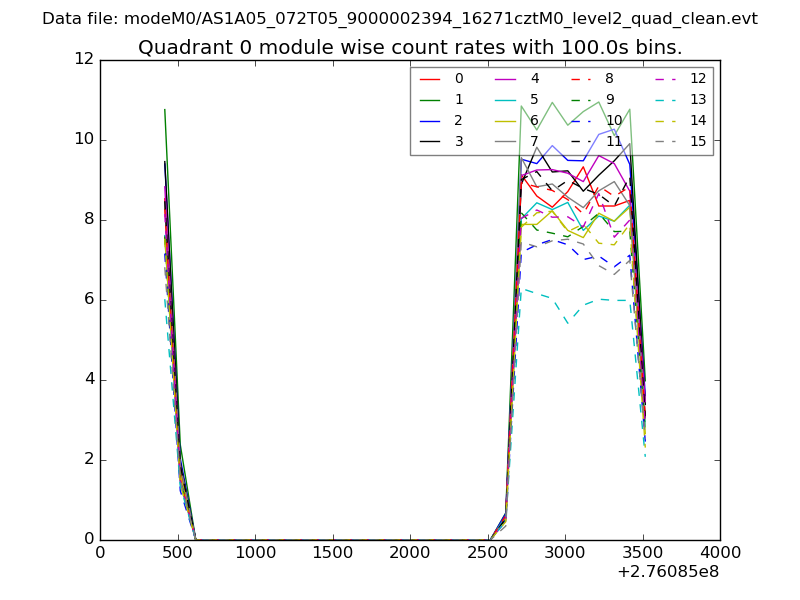 |
 |
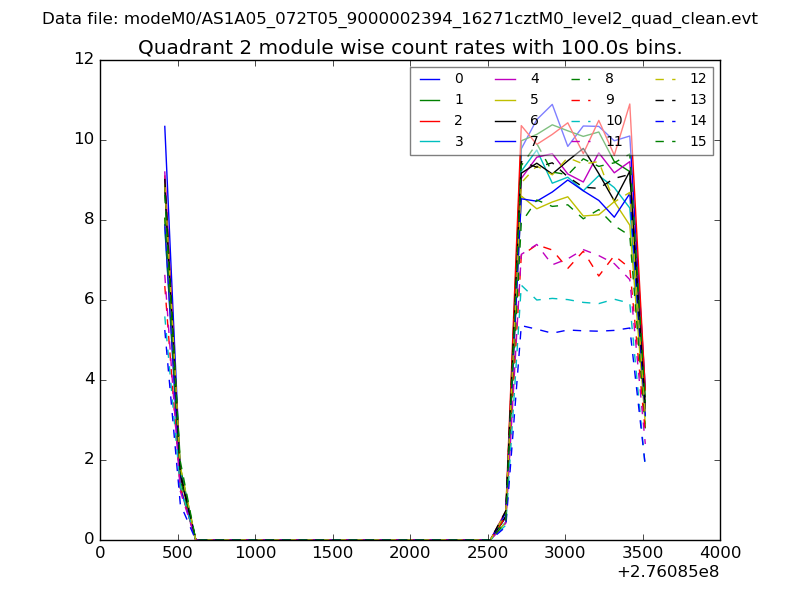
| Module-wise count rates for Quadrant B Data is divided into 100 sec bins |
 |
 |
| Module-wise count rates for Quadrant C Data is divided into 100 sec bins |
 |
 |
| Module-wise count rates for Quadrant D Data is divided into 100 sec bins |
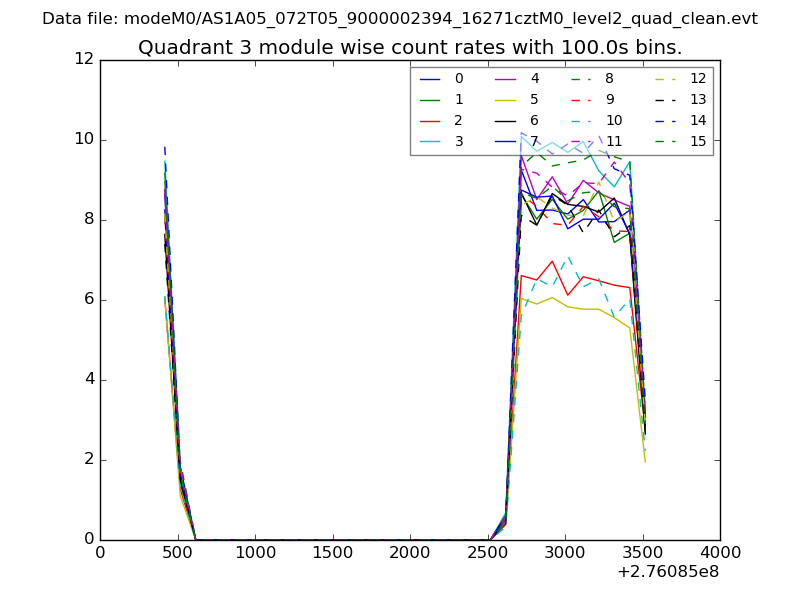 |
 |
| Parameter | Plot |
|---|---|
| CZT HV Monitor | 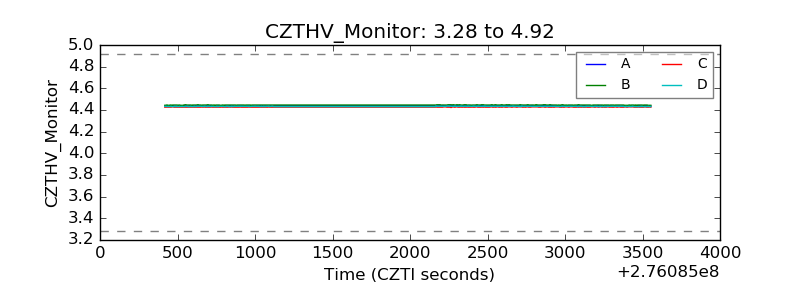 |
| D_VDD | 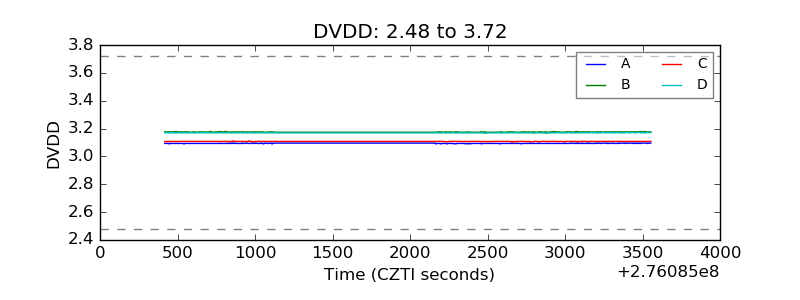 |
| Temperature 1 | 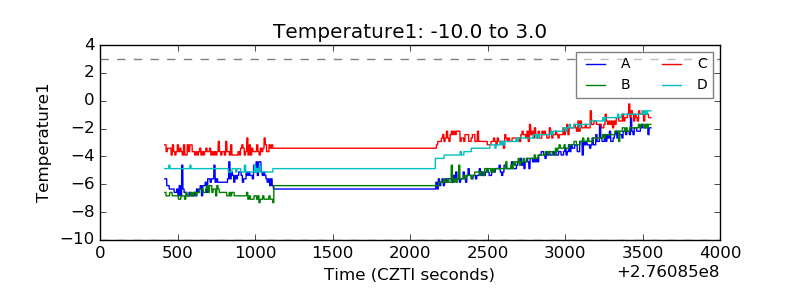 |
| Veto HV Monitor | 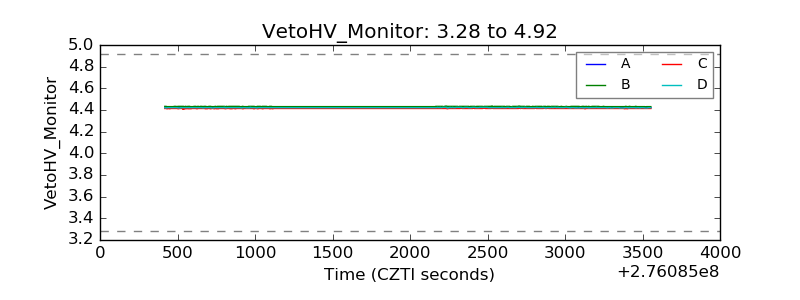 |
| Veto LLD | 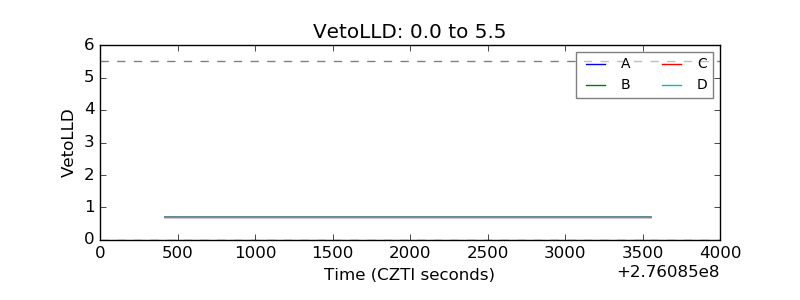 |
| Alpha Counter |  |
| _CPM_Rate | 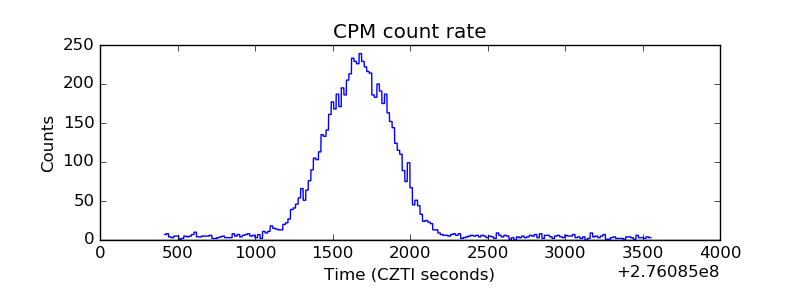 |
| CZT Counter | 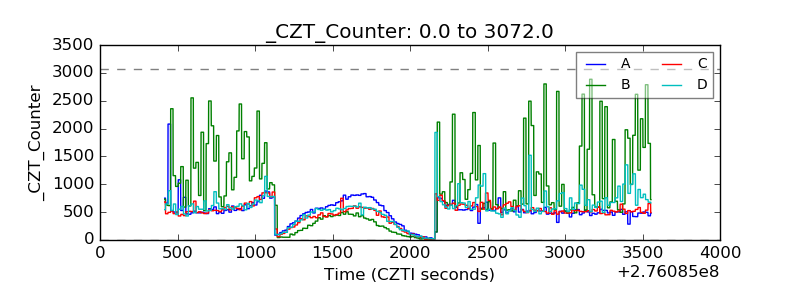 |
| +2.5 Volts monitor | 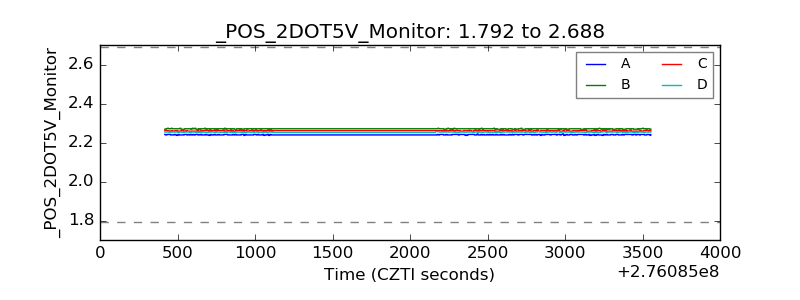 |
| +5 Volts monitor |  |
| _ROLL_ROT | 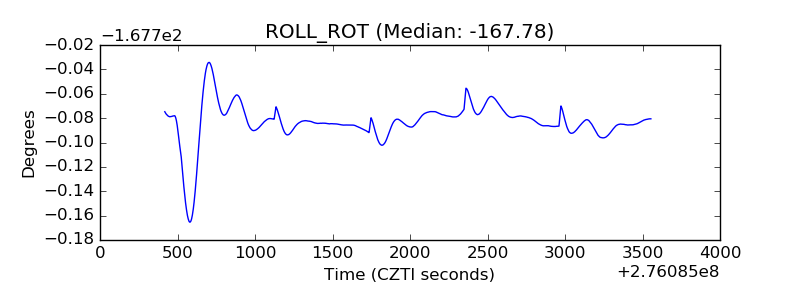 |
| _Roll_DEC | 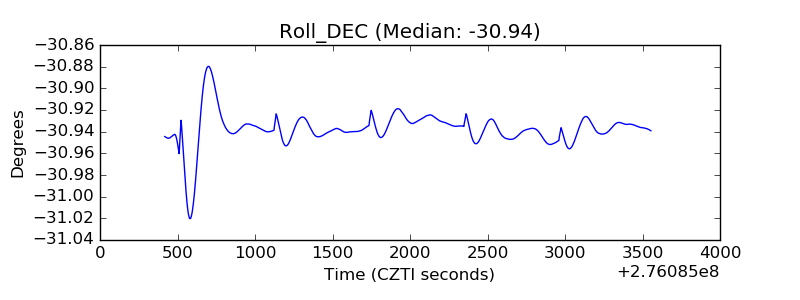 |
| _Roll_RA | 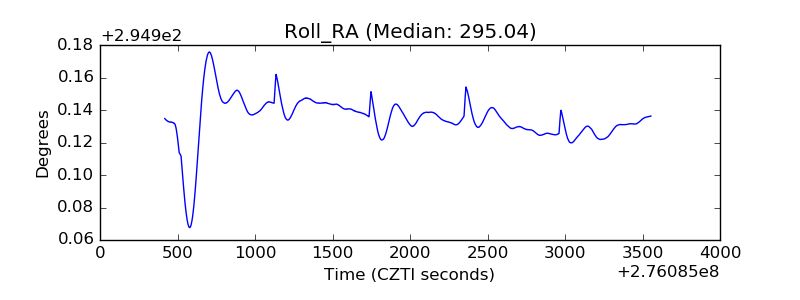 |
| Veto Counter | 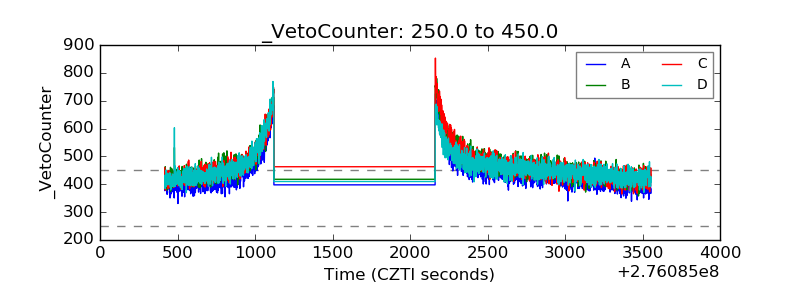 |