| Param | Original file | Final file |
|---|---|---|
| Filename | modeM0/AS1A05_072T05_9000002394_16272cztM0_level2.evt | modeM0/AS1A05_072T05_9000002394_16272cztM0_level2_quad_clean.evt |
| Size (bytes) | 530,614,080 | 94,737,600 |
| Size | 506.0 MB | 90.3 MB |
| Events in quadrant A | 3,510,148 | 613,540 |
| Events in quadrant B | 5,325,422 | 587,213 |
| Events in quadrant C | 3,171,654 | 616,926 |
| Events in quadrant D | 3,628,826 | 605,374 |
| Mode SS | |||
|---|---|---|---|
| Quadrant | BADHDUFLAG | Total packets | Discarded packets |
| A | 0 | 130 | 0 |
| B | 0 | 130 | 0 |
| C | 0 | 130 | 0 |
| D | 0 | 130 | 0 |
| Mode M9 | |||
|---|---|---|---|
| Quadrant | BADHDUFLAG | Total packets | Discarded packets |
| A | 0 | 6 | 0 |
| B | 0 | 6 | 0 |
| C | 0 | 6 | 0 |
| D | 0 | 6 | 0 |
| Mode M0 | |||
|---|---|---|---|
| Quadrant | BADHDUFLAG | Total packets | Discarded packets |
| A | 0 | 14496 | 2 |
| B | 0 | 19976 | 1 |
| C | 0 | 13398 | 1 |
| D | 0 | 15061 | 1 |
| Quadrant | Total seconds | Saturated seconds | Saturation percentage |
|---|---|---|---|
| A | 6388 | 181 | 2.833438% |
| B | 6388 | 724 | 11.333751% |
| C | 6388 | 143 | 2.238572% |
| D | 6388 | 152 | 2.379461% |
Noise dominated data is calculated using 1-second bins in cleaned event files. If a bin has >2000 counts, and if more than 50% of those come from <1% of pixels, then it is considered to be noise-dominated and hence unusable.
| Quadrant | # 1 sec bins | Bins with >0 counts | Bins with >2000 counts | High rate bins dominated by noise | Noise dominated (total time) | Noise dominated (detector-on time) | Marked lightcurve |
|---|---|---|---|---|---|---|---|
| A | 7004 | 6390 | 53 | 53 | 0.76% | 0.83% | 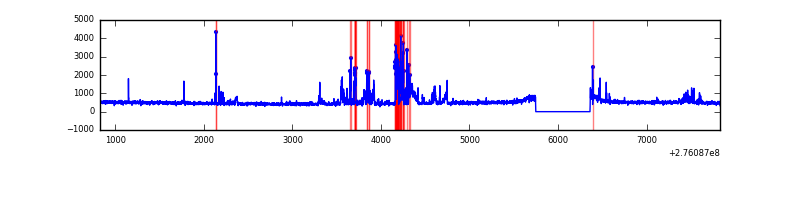 |
| B | 7004 | 6390 | 415 | 415 | 5.93% | 6.49% | 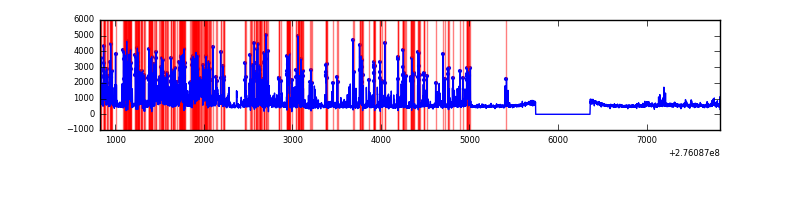 |
| C | 7004 | 6390 | 0 | 0 | 0.00% | 0.00% | 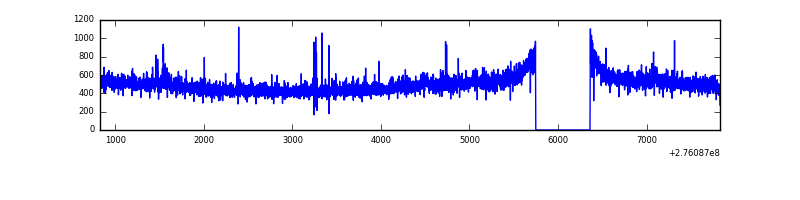 |
| D | 7004 | 6390 | 53 | 53 | 0.76% | 0.83% |  |
Top three noisy pixels from each quadrant. If the there are fewer than three noisy pixels in the level2.evt file, extra rows are filled as -1
| Pixel properties | Quadrant properties | ||||||
|---|---|---|---|---|---|---|---|
| Quadrant | DetID | PixID | Counts | Sigma | Mean | Median | Sigma |
| A | 9 | 143 | 327063 | 2046.45 | 784 | 768 | 159.4 |
| A | 15 | 174 | 151750 | 946.93 | 784 | 768 | 159.4 |
| A | 13 | 248 | 10752 | 62.61 | 784 | 768 | 159.4 |
| B | 3 | 112 | 1992384 | 13627.32 | 752 | 730 | 146.2 |
| B | 0 | 189 | 101807 | 691.59 | 752 | 730 | 146.2 |
| B | 0 | 219 | 93012 | 631.41 | 752 | 730 | 146.2 |
| C | 14 | 238 | 121978 | 692.9 | 750 | 755 | 174.9 |
| C | 3 | 233 | 108590 | 616.38 | 750 | 755 | 174.9 |
| C | 0 | 207 | 11294 | 60.24 | 750 | 755 | 174.9 |
| D | 1 | 52 | 589613 | 2924.88 | 758 | 743 | 201.3 |
| D | 15 | 0 | 105958 | 522.6 | 758 | 743 | 201.3 |
| D | 10 | 70 | 24705 | 119.02 | 758 | 743 | 201.3 |
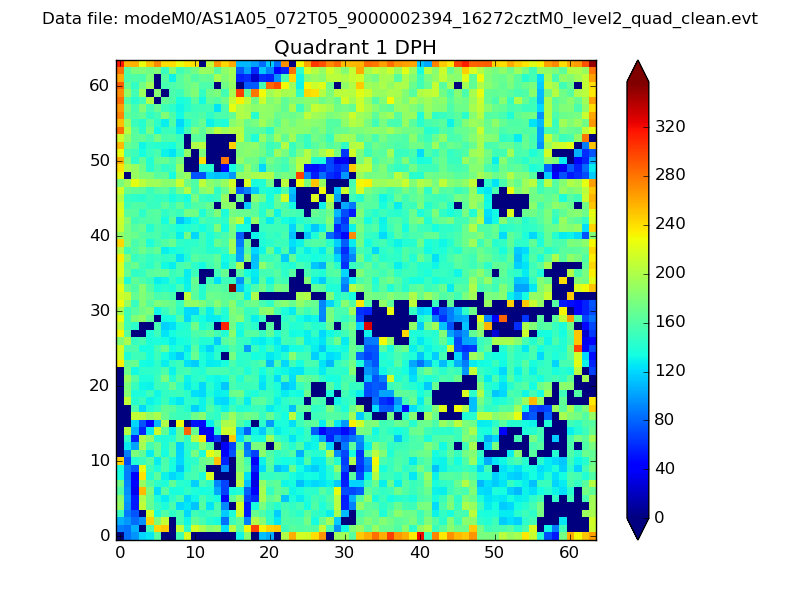
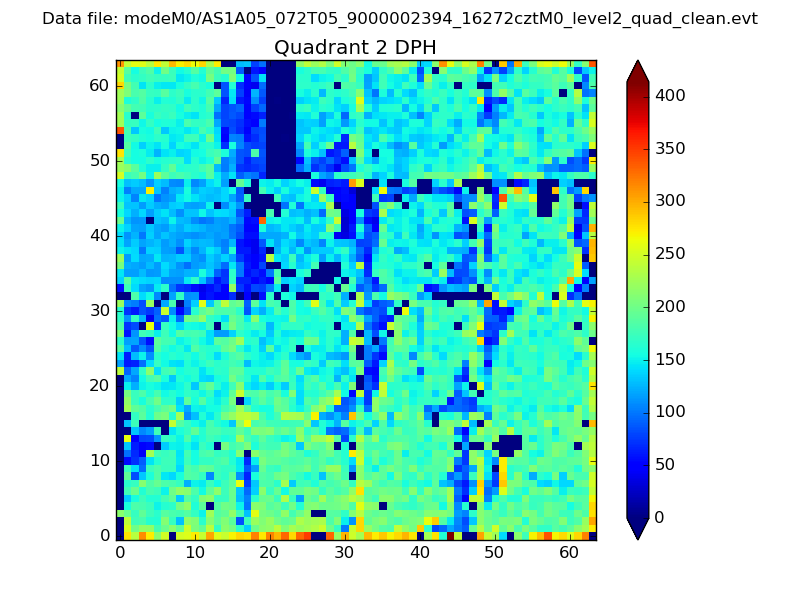
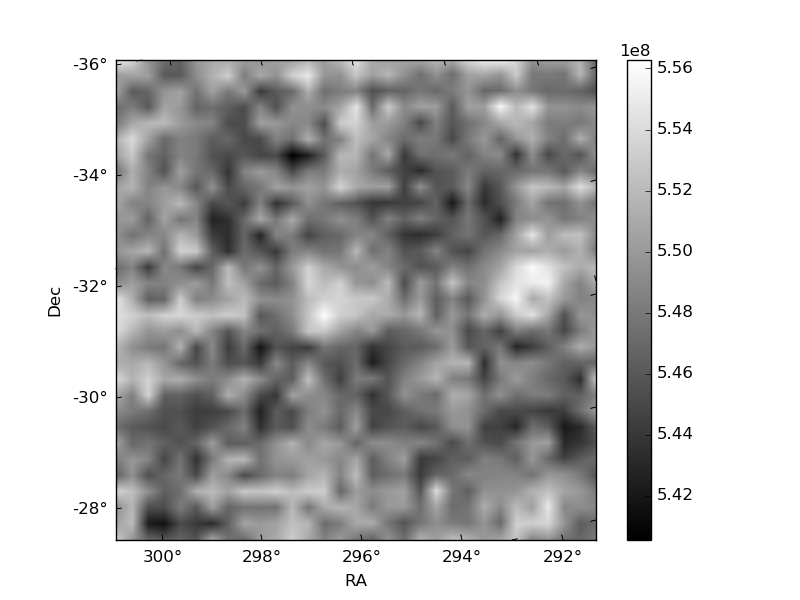
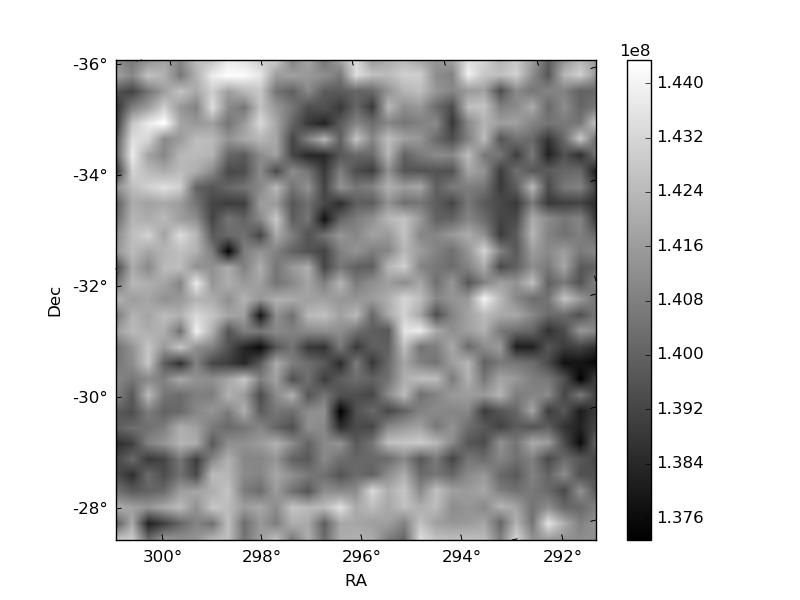
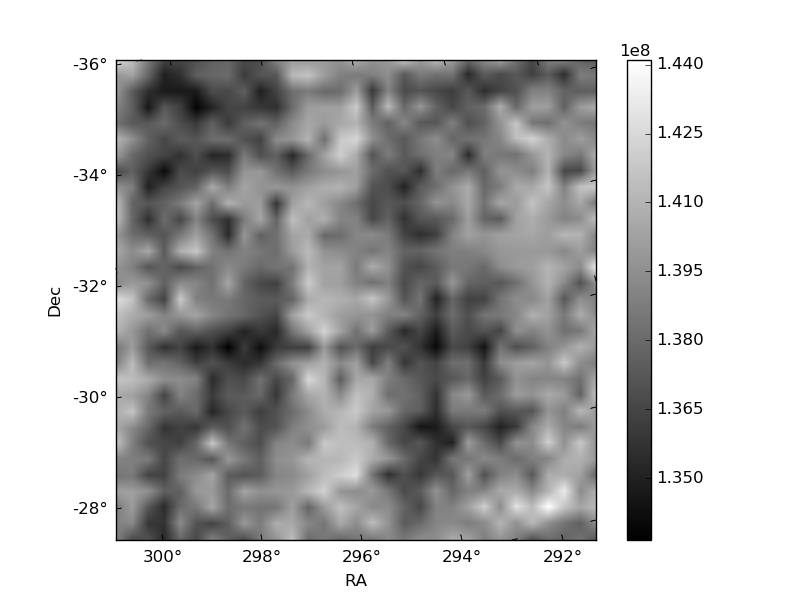
Histogram calculated using DETX and DETY for each event in the final _common_clean file
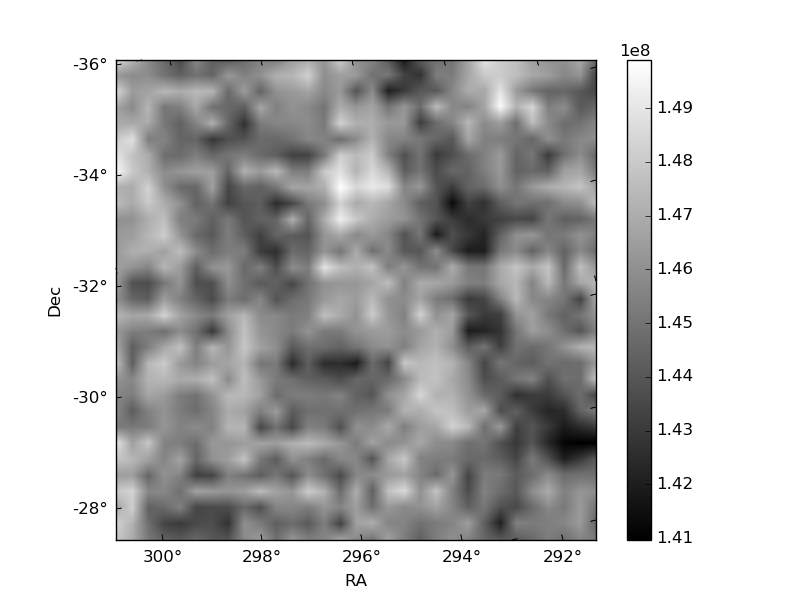
| Quadrant A | 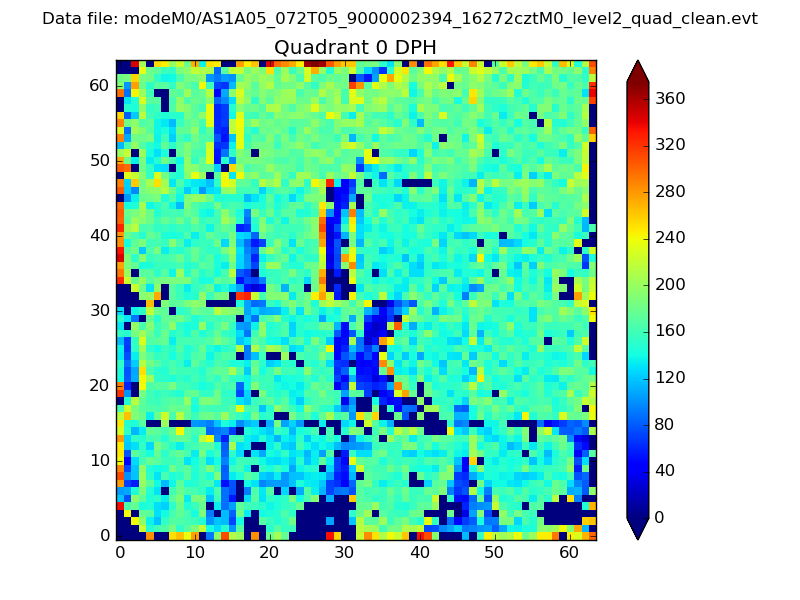 |
 |
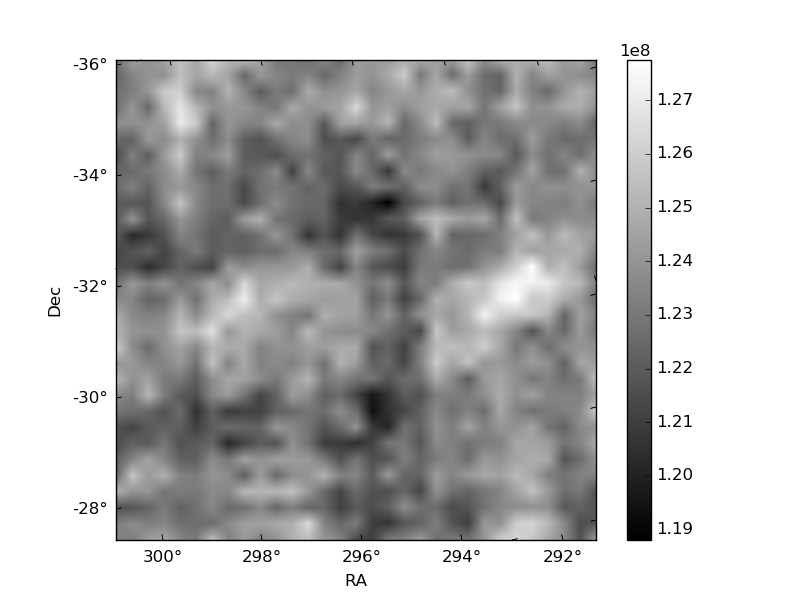
Quadrant B |
|---|---|---|---|
| Quadrant D | 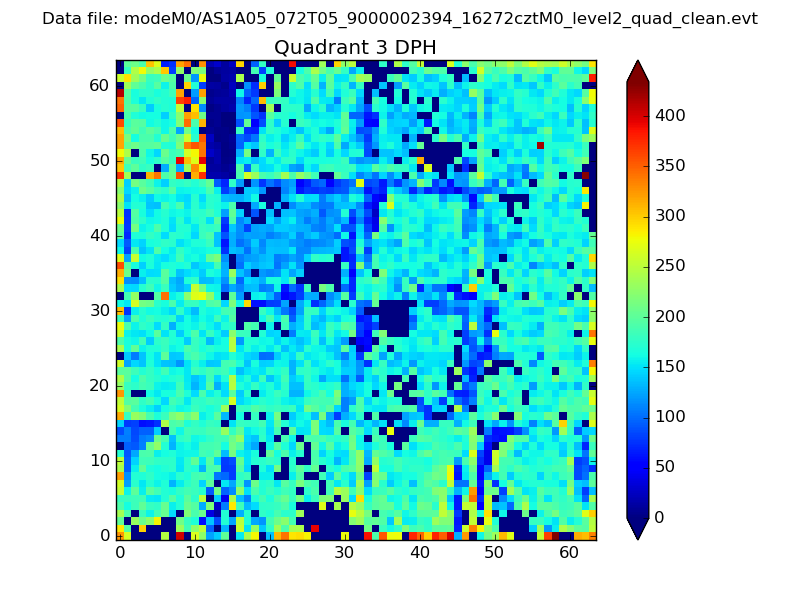 |
 |
Quadrant C |
| Plot type | Count rate plots | Images |
|---|---|---|
| Comparison with Poisson distribution Blue bars denote a histogram of data divided into 1 sec bins. Red curve is a Poisson curve with rate = median count rate of data. |
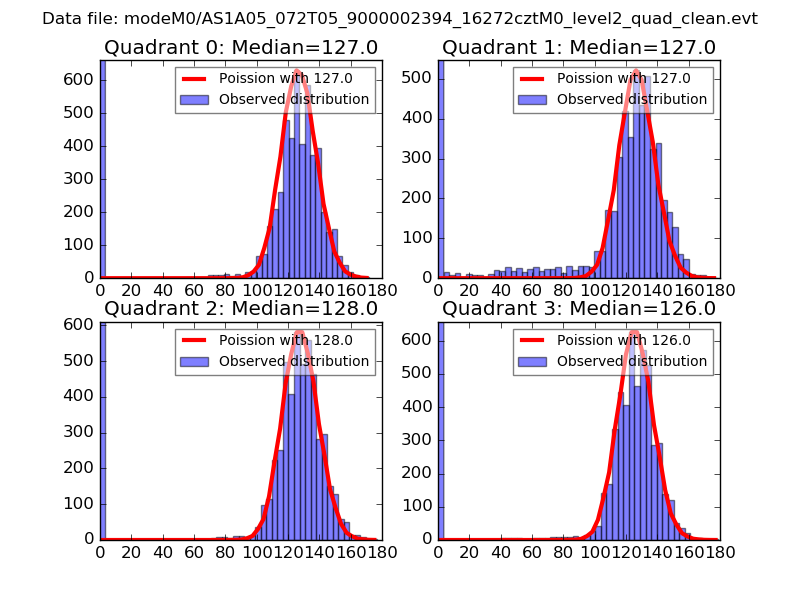 |
 |
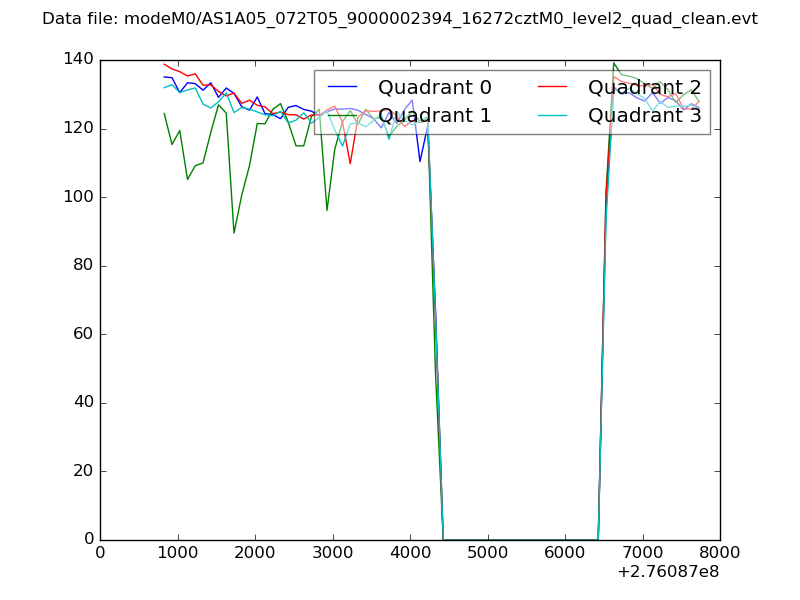
| Quadrant-wise count rates Data is divided into 100 sec bins |
 |
|
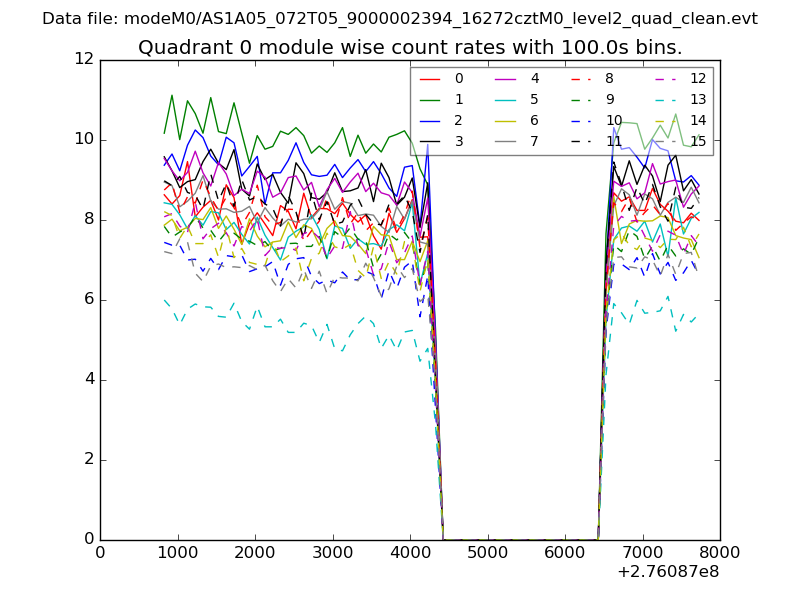
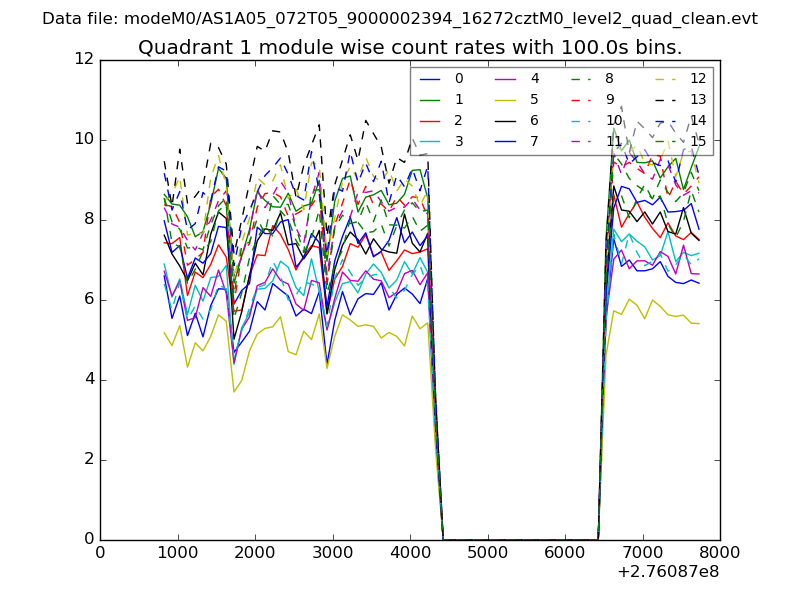
| Module-wise count rates for Quadrant A Data is divided into 100 sec bins |
 |
 |
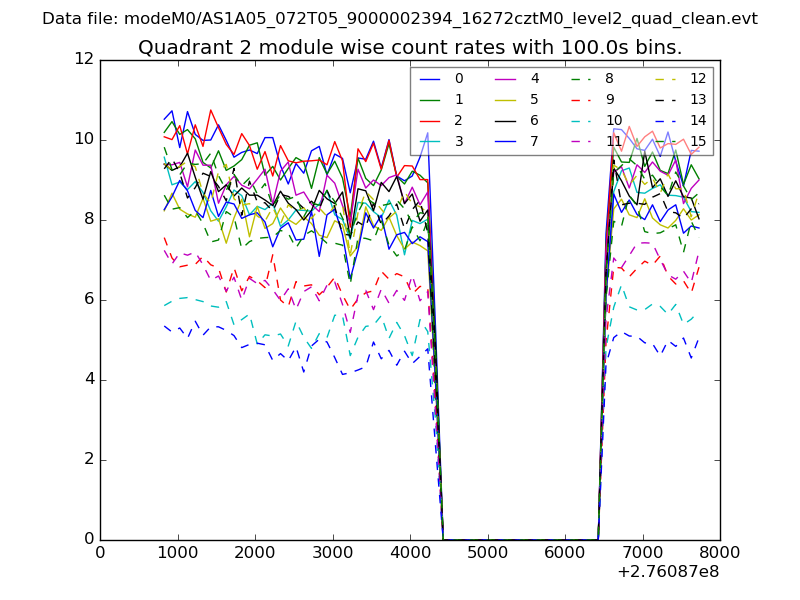
| Module-wise count rates for Quadrant B Data is divided into 100 sec bins |
 |
 |
| Module-wise count rates for Quadrant C Data is divided into 100 sec bins |
 |
 |
| Module-wise count rates for Quadrant D Data is divided into 100 sec bins |
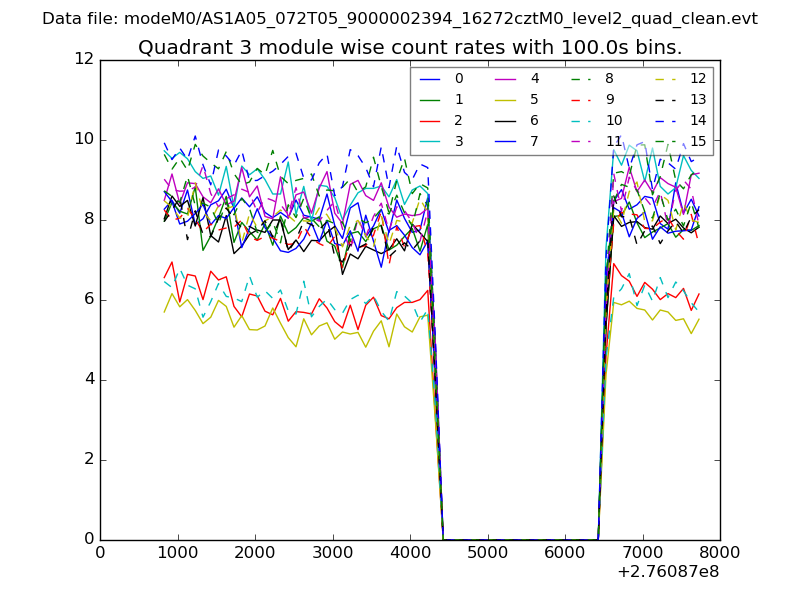 |
 |
| Parameter | Plot |
|---|---|
| CZT HV Monitor | 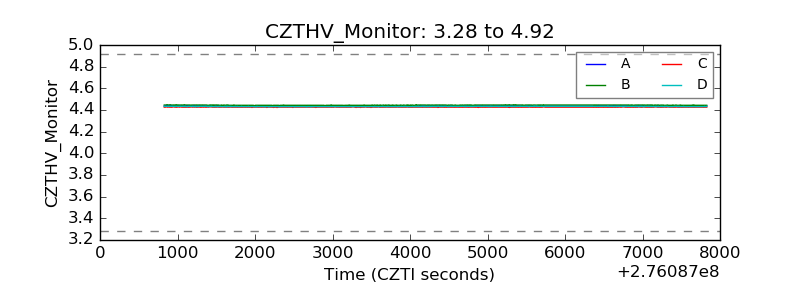 |
| D_VDD | 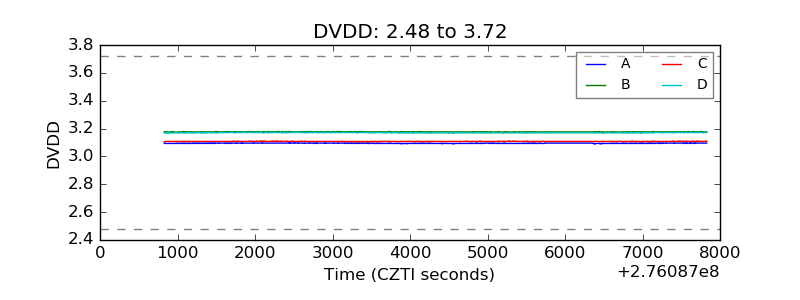 |
| Temperature 1 | 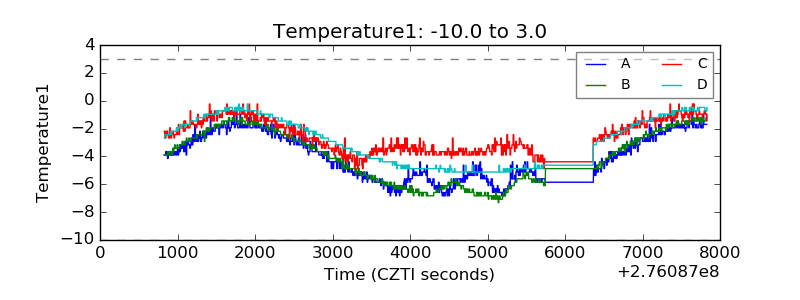 |
| Veto HV Monitor | 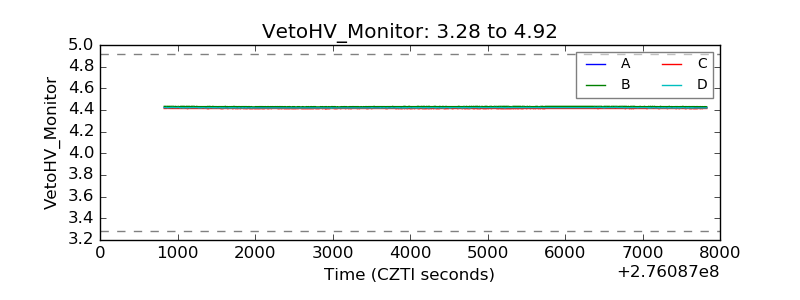 |
| Veto LLD | 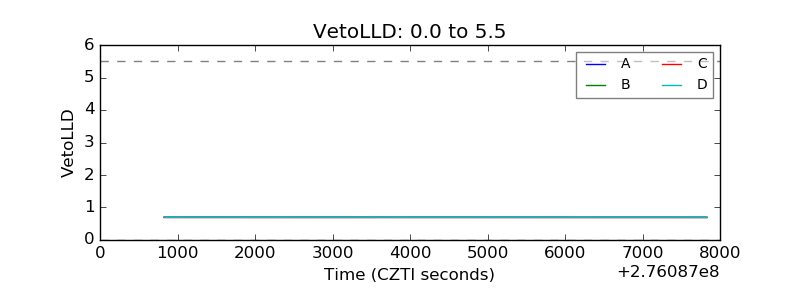 |
| Alpha Counter | 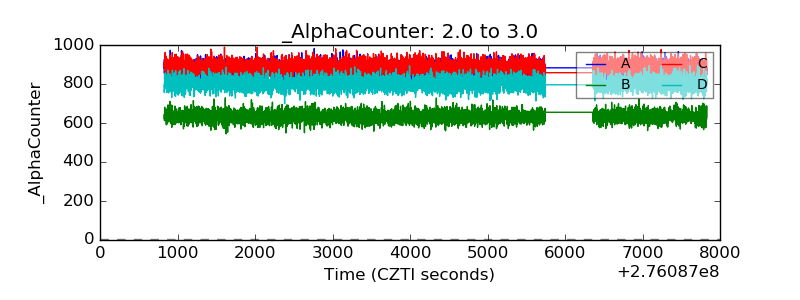 |
| _CPM_Rate | 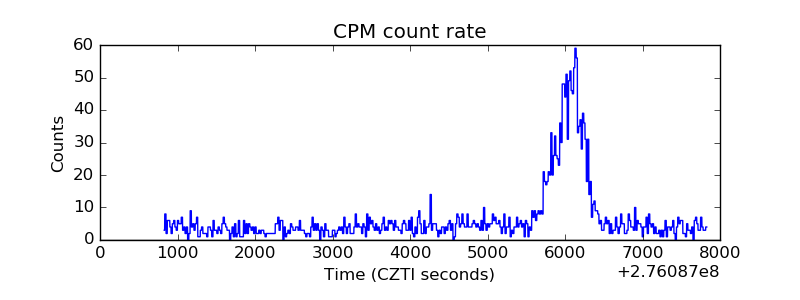 |
| CZT Counter | 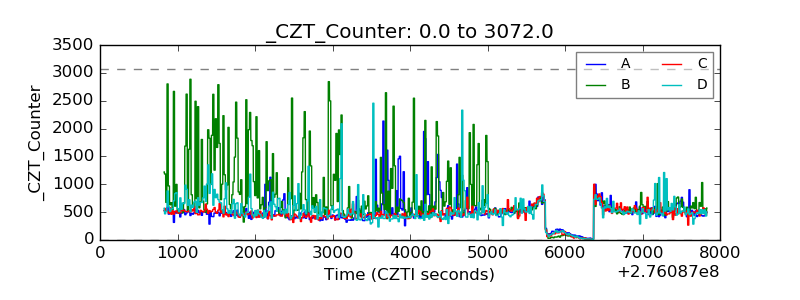 |
| +2.5 Volts monitor | 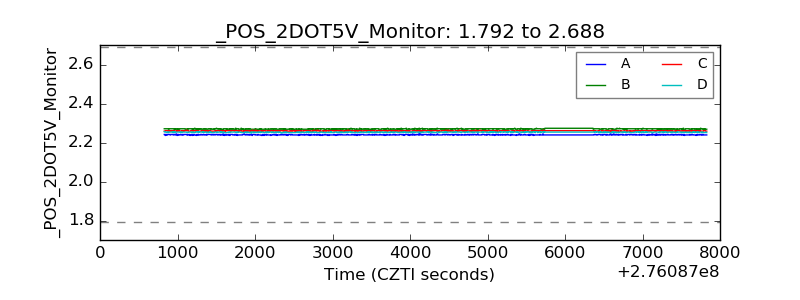 |
| +5 Volts monitor | 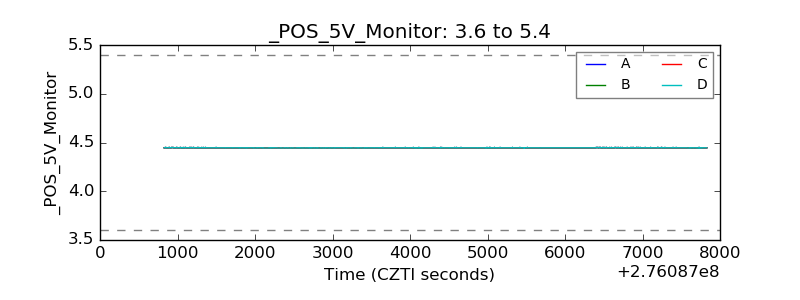 |
| _ROLL_ROT |  |
| _Roll_DEC | 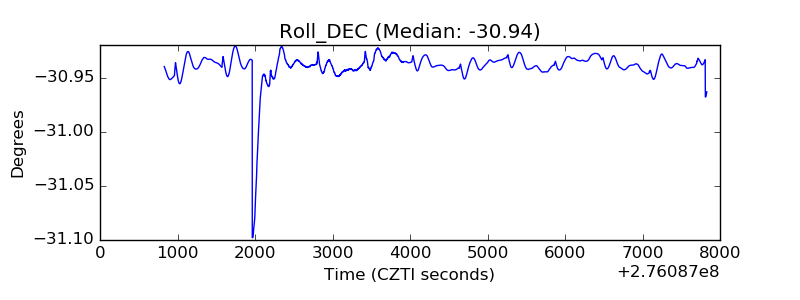 |
| _Roll_RA | 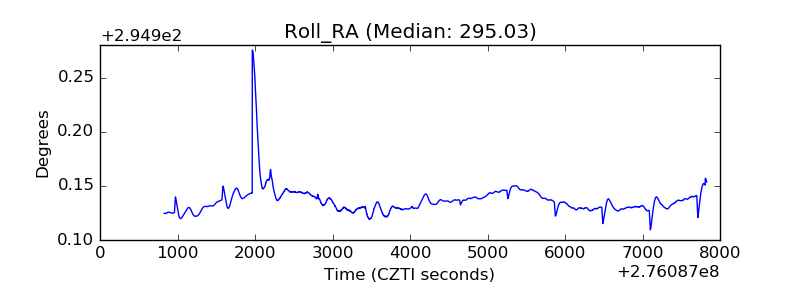 |
| Veto Counter | 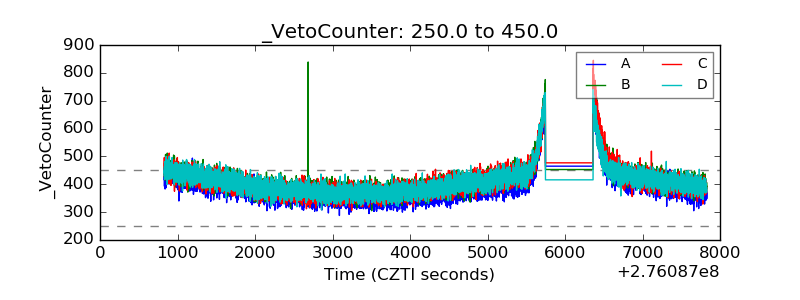 |