| Param | Original file | Final file |
|---|---|---|
| Filename | modeM0/AS1A05_072T05_9000002394_16273cztM0_level2.evt | modeM0/AS1A05_072T05_9000002394_16273cztM0_level2_quad_clean.evt |
| Size (bytes) | 534,556,800 | 99,786,240 |
| Size | 509.8 MB | 95.2 MB |
| Events in quadrant A | 3,629,093 | 632,615 |
| Events in quadrant B | 4,331,247 | 638,488 |
| Events in quadrant C | 3,628,085 | 629,379 |
| Events in quadrant D | 4,111,086 | 619,130 |
| Mode SS | |||
|---|---|---|---|
| Quadrant | BADHDUFLAG | Total packets | Discarded packets |
| A | 0 | 148 | 0 |
| B | 0 | 148 | 0 |
| C | 0 | 148 | 0 |
| D | 0 | 148 | 0 |
| Mode M9 | |||
|---|---|---|---|
| Quadrant | BADHDUFLAG | Total packets | Discarded packets |
| A | 0 | 1 | 0 |
| B | 0 | 1 | 0 |
| C | 0 | 1 | 0 |
| D | 0 | 1 | 0 |
| Mode M0 | |||
|---|---|---|---|
| Quadrant | BADHDUFLAG | Total packets | Discarded packets |
| A | 0 | 15497 | 2 |
| B | 0 | 17444 | 1 |
| C | 0 | 15317 | 1 |
| D | 0 | 17060 | 1 |
| Quadrant | Total seconds | Saturated seconds | Saturation percentage |
|---|---|---|---|
| A | 7207 | 195 | 2.705703% |
| B | 7207 | 267 | 3.704732% |
| C | 7207 | 194 | 2.691827% |
| D | 7207 | 152 | 2.109061% |
Noise dominated data is calculated using 1-second bins in cleaned event files. If a bin has >2000 counts, and if more than 50% of those come from <1% of pixels, then it is considered to be noise-dominated and hence unusable.
| Quadrant | # 1 sec bins | Bins with >0 counts | Bins with >2000 counts | High rate bins dominated by noise | Noise dominated (total time) | Noise dominated (detector-on time) | Marked lightcurve |
|---|---|---|---|---|---|---|---|
| A | 7348 | 7209 | 11 | 11 | 0.15% | 0.15% | 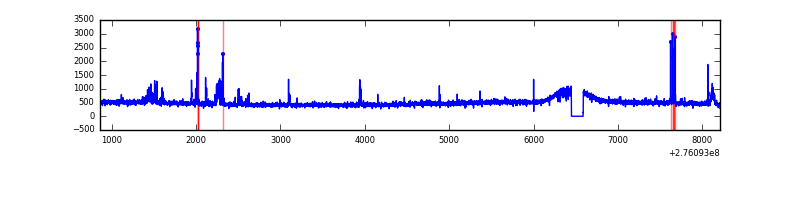 |
| B | 7348 | 7209 | 33 | 33 | 0.45% | 0.46% | 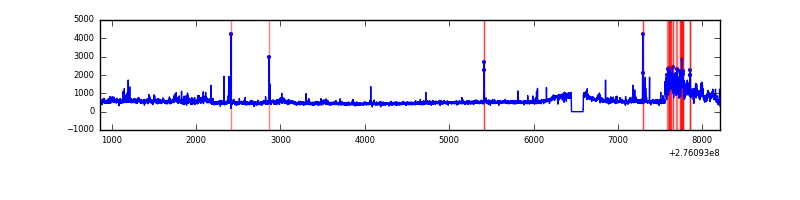 |
| C | 7348 | 7209 | 1 | 1 | 0.01% | 0.01% | 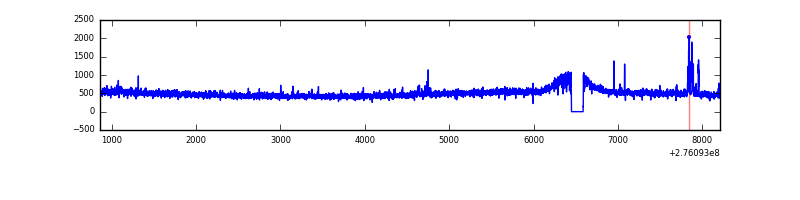 |
| D | 7348 | 7208 | 54 | 54 | 0.73% | 0.75% | 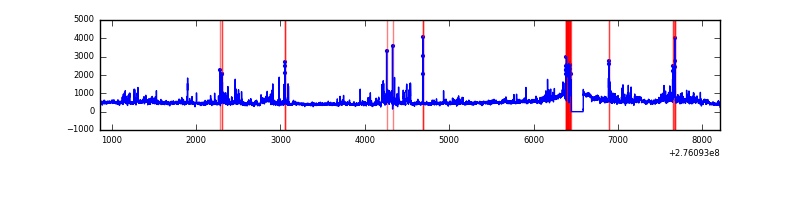 |
Top three noisy pixels from each quadrant. If the there are fewer than three noisy pixels in the level2.evt file, extra rows are filled as -1
| Pixel properties | Quadrant properties | ||||||
|---|---|---|---|---|---|---|---|
| Quadrant | DetID | PixID | Counts | Sigma | Mean | Median | Sigma |
| A | 9 | 143 | 95488 | 519.45 | 894 | 876 | 182.1 |
| A | 15 | 174 | 85489 | 464.55 | 894 | 876 | 182.1 |
| A | 13 | 248 | 9859 | 49.32 | 894 | 876 | 182.1 |
| B | 5 | 65 | 366143 | 2102.98 | 891 | 867 | 173.7 |
| B | 0 | 219 | 112723 | 643.98 | 891 | 867 | 173.7 |
| B | 4 | 216 | 81305 | 463.1 | 891 | 867 | 173.7 |
| C | 3 | 233 | 143736 | 713.11 | 853 | 859 | 200.4 |
| C | 14 | 238 | 132461 | 656.84 | 853 | 859 | 200.4 |
| C | 0 | 207 | 20894 | 100.0 | 853 | 859 | 200.4 |
| D | 1 | 52 | 566745 | 2508.62 | 859 | 838 | 225.6 |
| D | 10 | 70 | 225309 | 995.06 | 859 | 838 | 225.6 |
| D | 15 | 0 | 39464 | 171.22 | 859 | 838 | 225.6 |
Histogram calculated using DETX and DETY for each event in the final _common_clean file
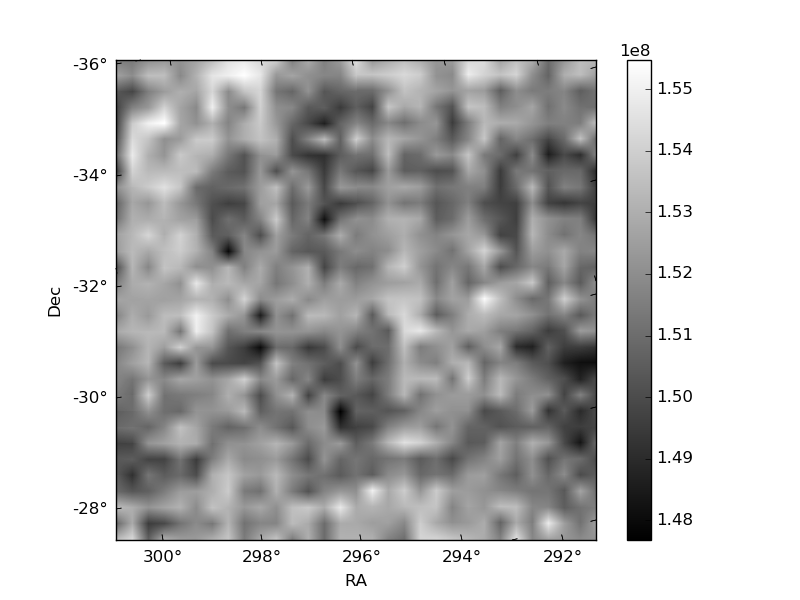
| Quadrant A |  |
 |
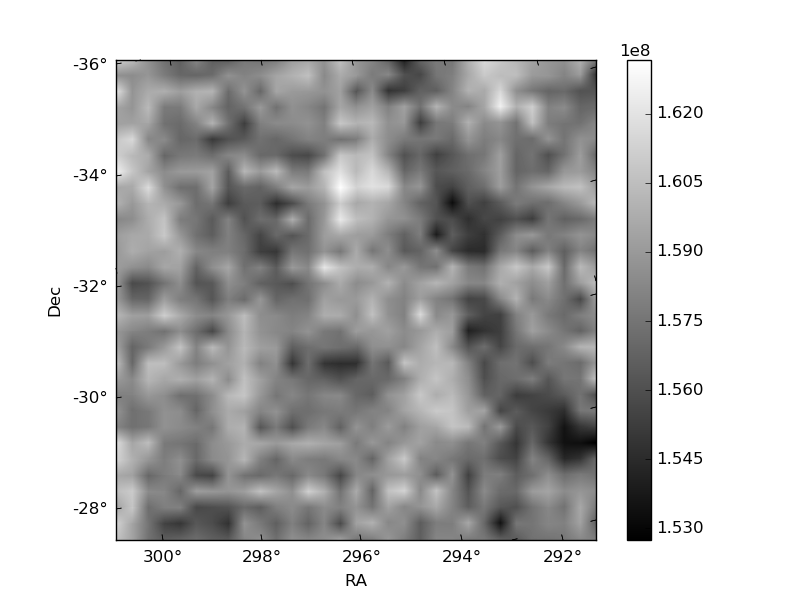
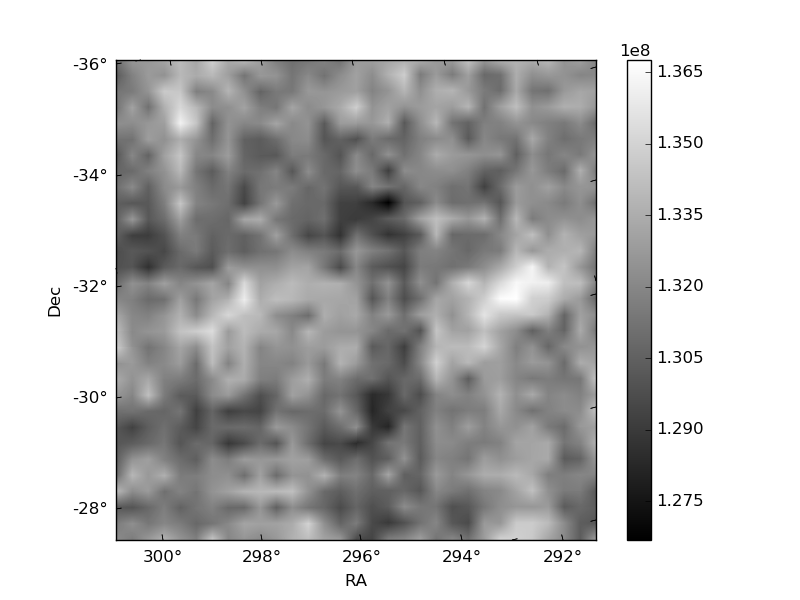
Quadrant B |
|---|---|---|---|
| Quadrant D |  |
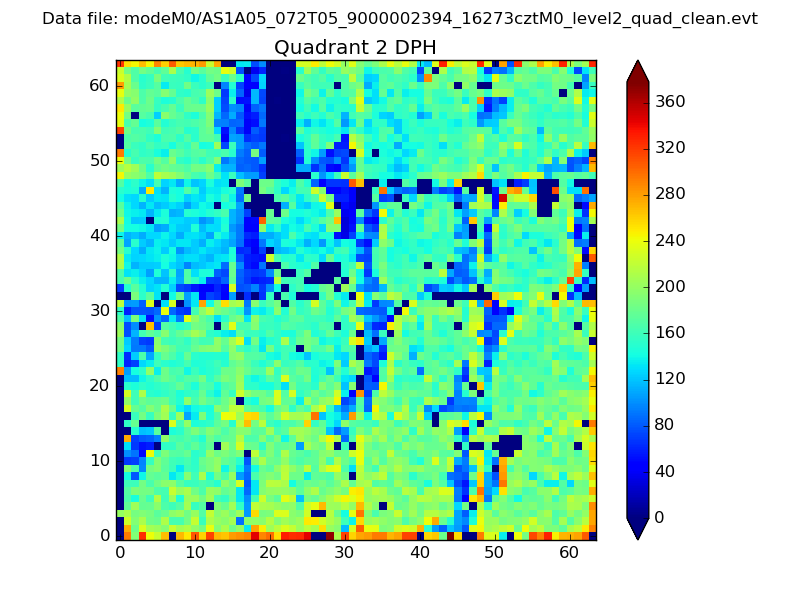 |
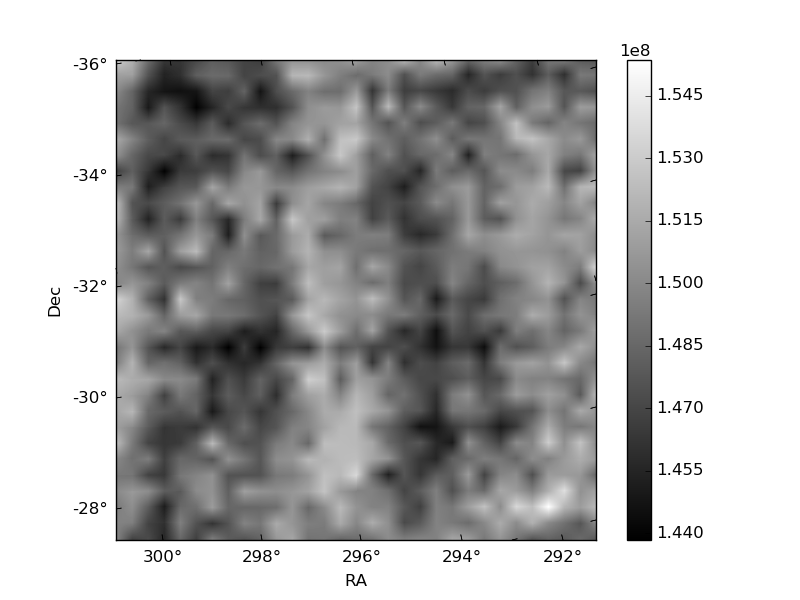
Quadrant C |
| Plot type | Count rate plots | Images |
|---|---|---|
| Comparison with Poisson distribution Blue bars denote a histogram of data divided into 1 sec bins. Red curve is a Poisson curve with rate = median count rate of data. |
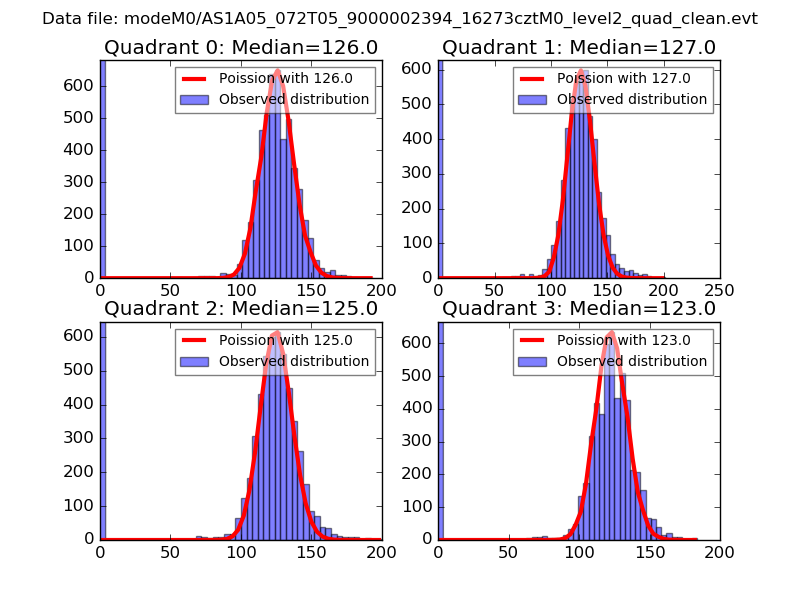 |
 |
| Quadrant-wise count rates Data is divided into 100 sec bins |
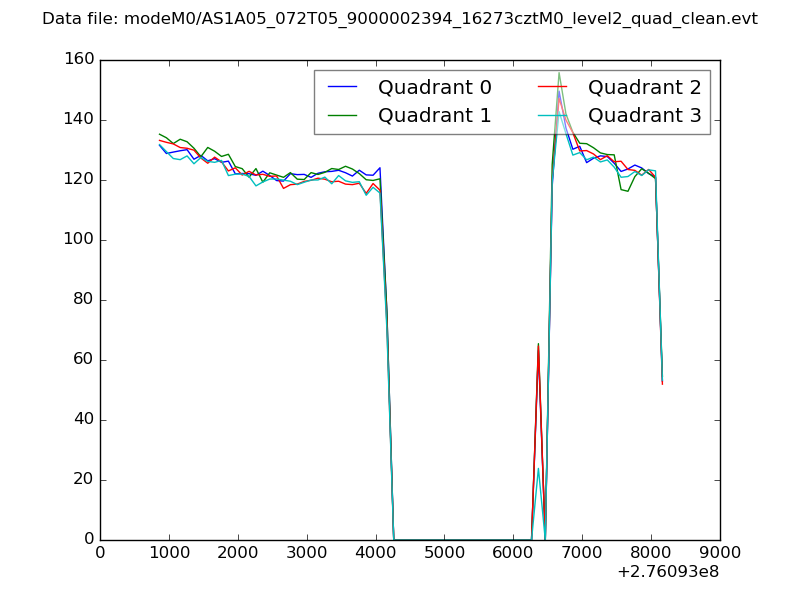 |
|
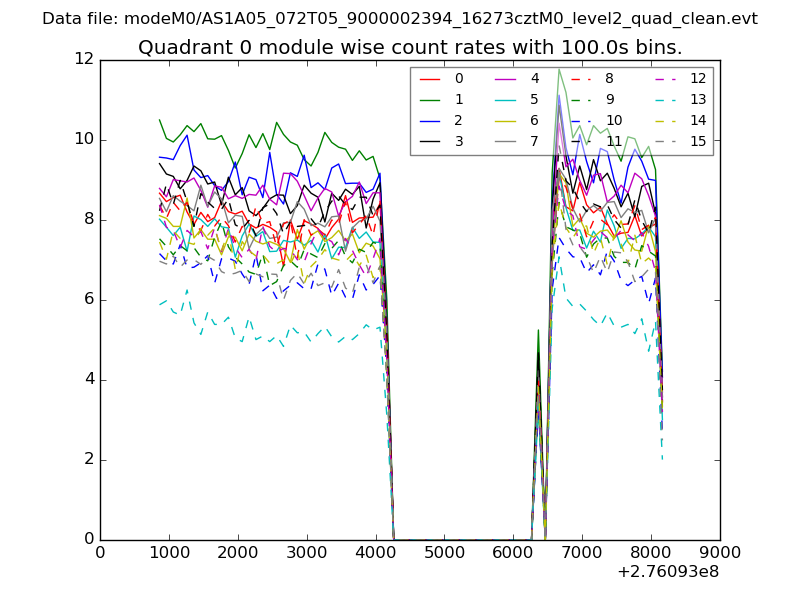
| Module-wise count rates for Quadrant A Data is divided into 100 sec bins |
 |
 |
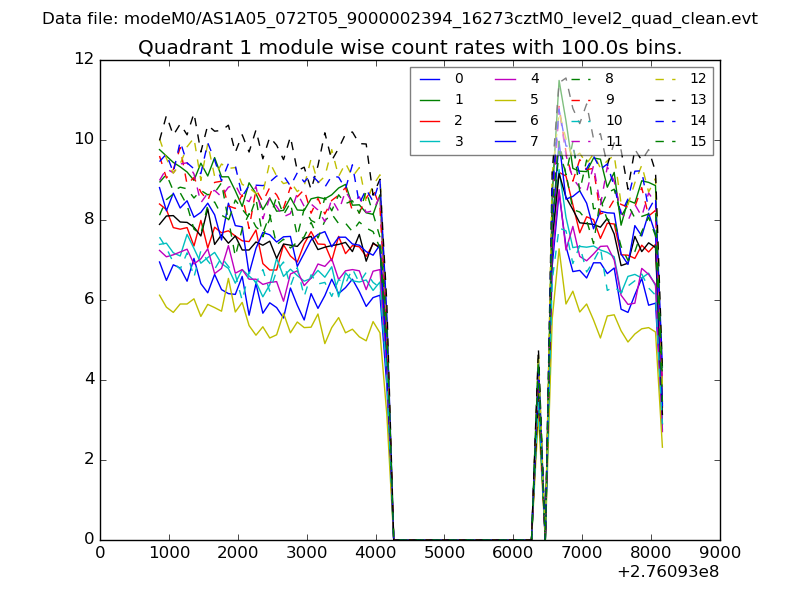
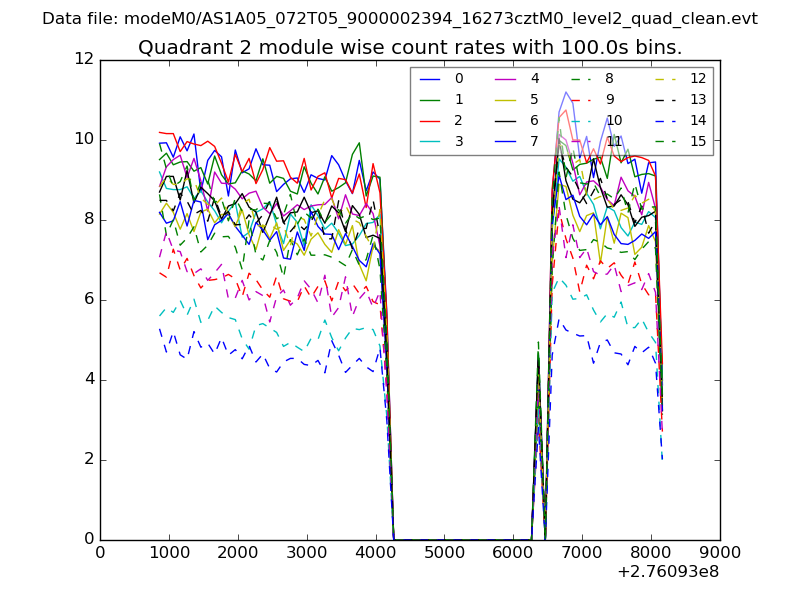
| Module-wise count rates for Quadrant B Data is divided into 100 sec bins |
 |
 |
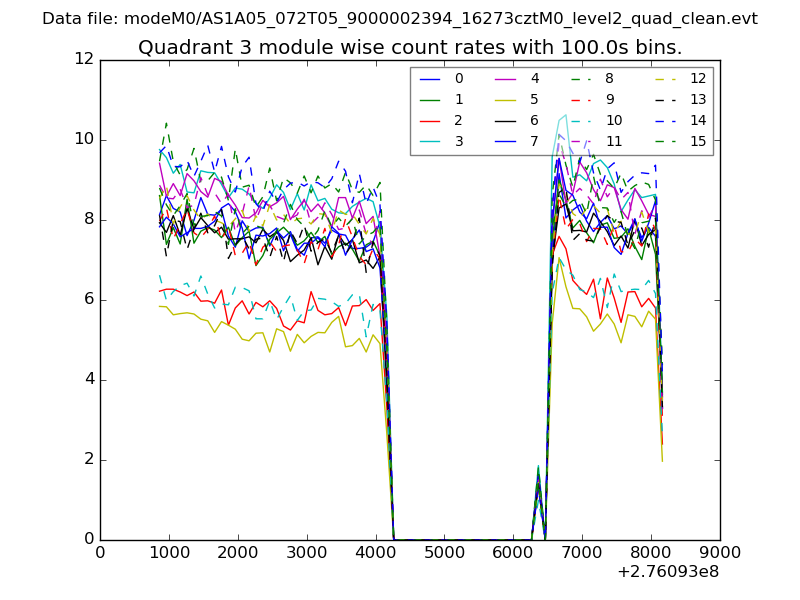
| Module-wise count rates for Quadrant C Data is divided into 100 sec bins |
 |
 |
| Module-wise count rates for Quadrant D Data is divided into 100 sec bins |
 |
 |
| Parameter | Plot |
|---|---|
| CZT HV Monitor | 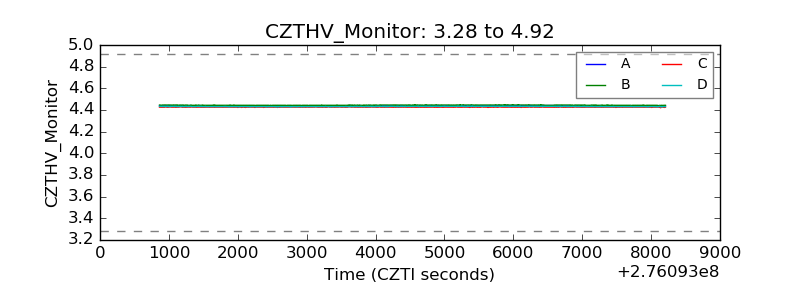 |
| D_VDD | 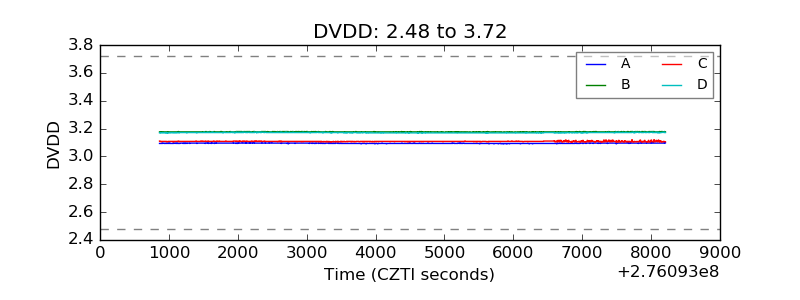 |
| Temperature 1 | 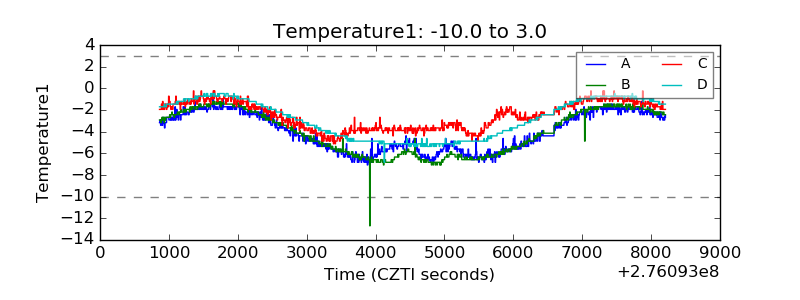 |
| Veto HV Monitor | 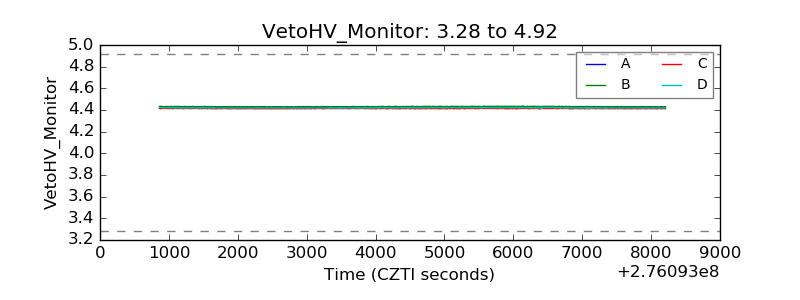 |
| Veto LLD | 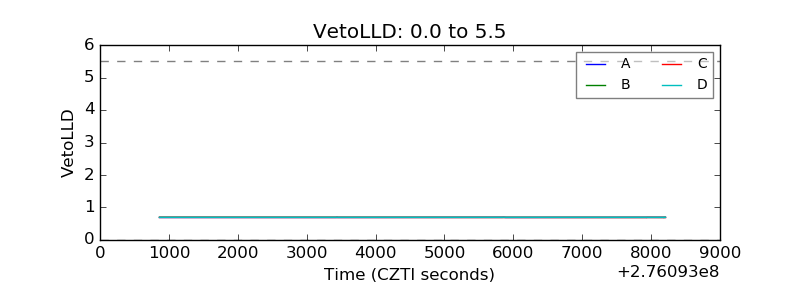 |
| Alpha Counter | 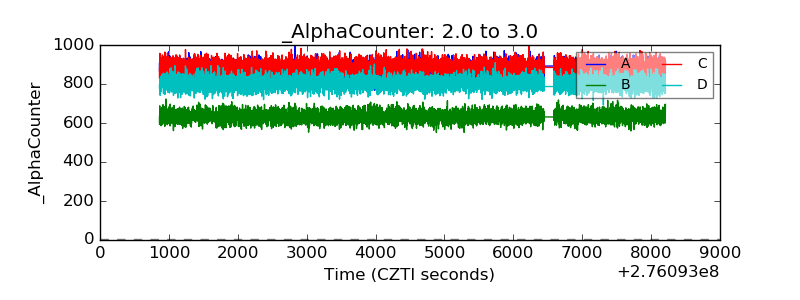 |
| _CPM_Rate |  |
| CZT Counter | 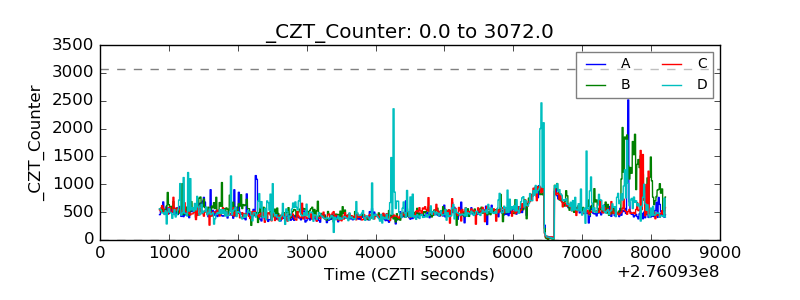 |
| +2.5 Volts monitor |  |
| +5 Volts monitor |  |
| _ROLL_ROT | 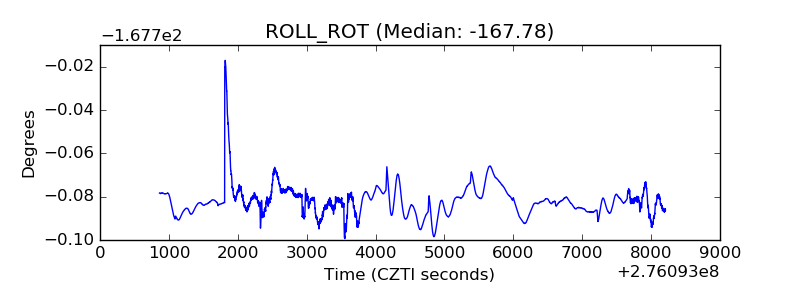 |
| _Roll_DEC | 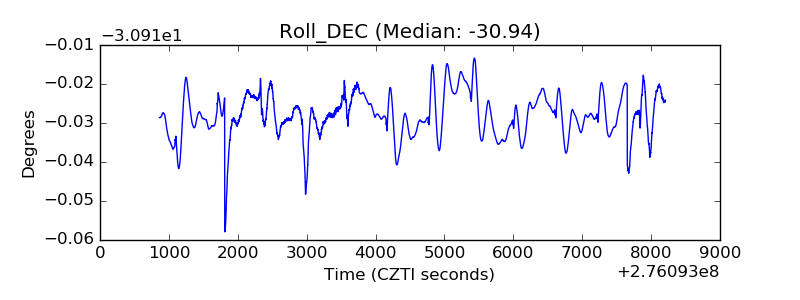 |
| _Roll_RA | 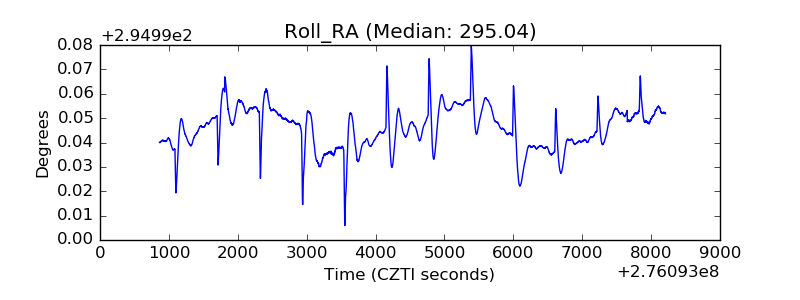 |
| Veto Counter | 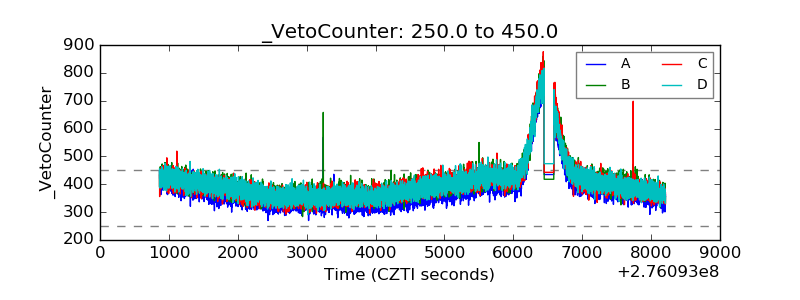 |