| Param | Original file | Final file |
|---|---|---|
| Filename | modeM0/AS1A05_072T05_9000002394_16274cztM0_level2.evt | modeM0/AS1A05_072T05_9000002394_16274cztM0_level2_quad_clean.evt |
| Size (bytes) | 569,260,800 | 105,920,640 |
| Size | 542.9 MB | 101.0 MB |
| Events in quadrant A | 3,731,158 | 670,490 |
| Events in quadrant B | 4,775,424 | 679,448 |
| Events in quadrant C | 3,851,375 | 672,387 |
| Events in quadrant D | 4,370,111 | 659,943 |
| Mode SS | |||
|---|---|---|---|
| Quadrant | BADHDUFLAG | Total packets | Discarded packets |
| A | 0 | 154 | 0 |
| B | 0 | 154 | 0 |
| C | 0 | 154 | 0 |
| D | 0 | 154 | 0 |
| Mode M0 | |||
|---|---|---|---|
| Quadrant | BADHDUFLAG | Total packets | Discarded packets |
| A | 0 | 16056 | 3 |
| B | 0 | 18915 | 2 |
| C | 0 | 16263 | 2 |
| D | 0 | 18161 | 2 |
| Quadrant | Total seconds | Saturated seconds | Saturation percentage |
|---|---|---|---|
| A | 7540 | 138 | 1.830239% |
| B | 7540 | 254 | 3.368700% |
| C | 7540 | 189 | 2.506631% |
| D | 7540 | 169 | 2.241379% |
Noise dominated data is calculated using 1-second bins in cleaned event files. If a bin has >2000 counts, and if more than 50% of those come from <1% of pixels, then it is considered to be noise-dominated and hence unusable.
| Quadrant | # 1 sec bins | Bins with >0 counts | Bins with >2000 counts | High rate bins dominated by noise | Noise dominated (total time) | Noise dominated (detector-on time) | Marked lightcurve |
|---|---|---|---|---|---|---|---|
| A | 7626 | 7543 | 8 | 8 | 0.10% | 0.11% |  |
| B | 7626 | 7543 | 35 | 35 | 0.46% | 0.46% |  |
| C | 7626 | 7543 | 2 | 2 | 0.03% | 0.03% |  |
| D | 7626 | 7543 | 84 | 84 | 1.10% | 1.11% |  |
Top three noisy pixels from each quadrant. If the there are fewer than three noisy pixels in the level2.evt file, extra rows are filled as -1
| Pixel properties | Quadrant properties | ||||||
|---|---|---|---|---|---|---|---|
| Quadrant | DetID | PixID | Counts | Sigma | Mean | Median | Sigma |
| A | 15 | 174 | 142610 | 750.14 | 927 | 906 | 188.9 |
| A | 13 | 248 | 15642 | 78.01 | 927 | 906 | 188.9 |
| A | 9 | 143 | 9718 | 46.65 | 927 | 906 | 188.9 |
| B | 5 | 65 | 606298 | 3366.79 | 925 | 899 | 179.8 |
| B | 0 | 219 | 141824 | 783.72 | 925 | 899 | 179.8 |
| B | 4 | 216 | 127275 | 702.81 | 925 | 899 | 179.8 |
| C | 3 | 233 | 149802 | 713.86 | 886 | 892 | 208.6 |
| C | 14 | 238 | 134372 | 639.89 | 886 | 892 | 208.6 |
| C | 0 | 207 | 104244 | 495.46 | 886 | 892 | 208.6 |
| D | 1 | 52 | 628381 | 2847.4 | 902 | 876 | 220.4 |
| D | 15 | 0 | 245766 | 1111.23 | 902 | 876 | 220.4 |
| D | 10 | 70 | 77352 | 347.02 | 902 | 876 | 220.4 |
Histogram calculated using DETX and DETY for each event in the final _common_clean file
| Quadrant A | 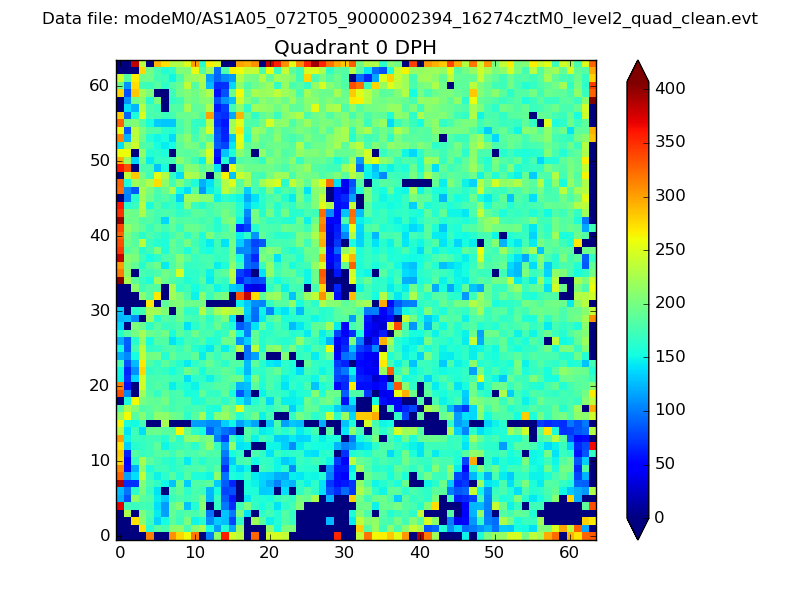 |
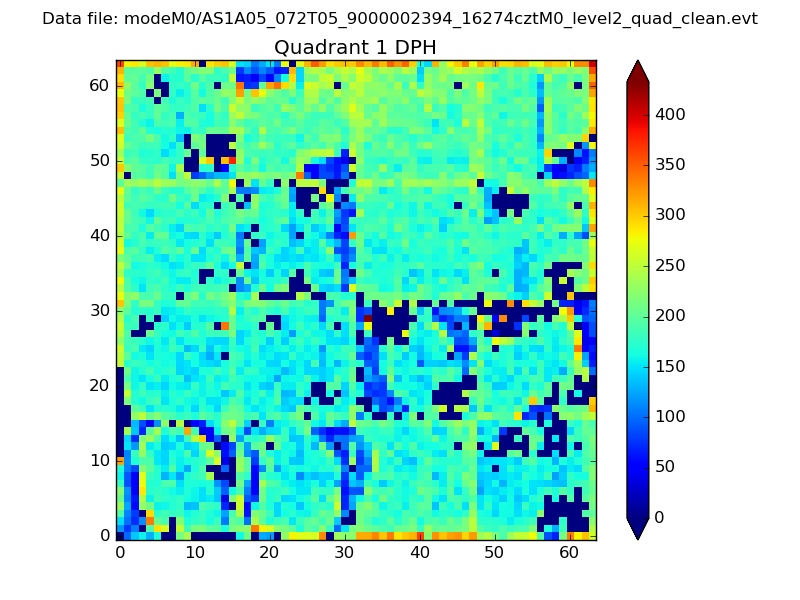 |
Quadrant B |
|---|---|---|---|
| Quadrant D | 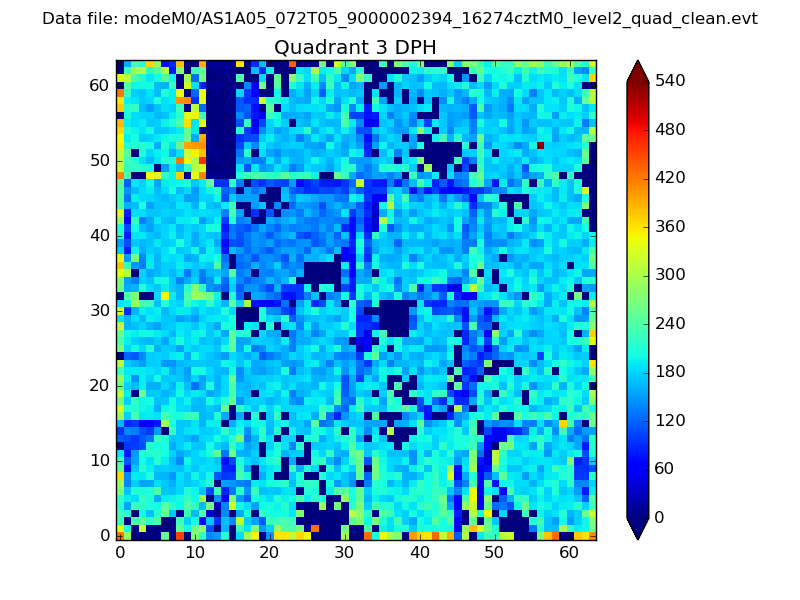 |
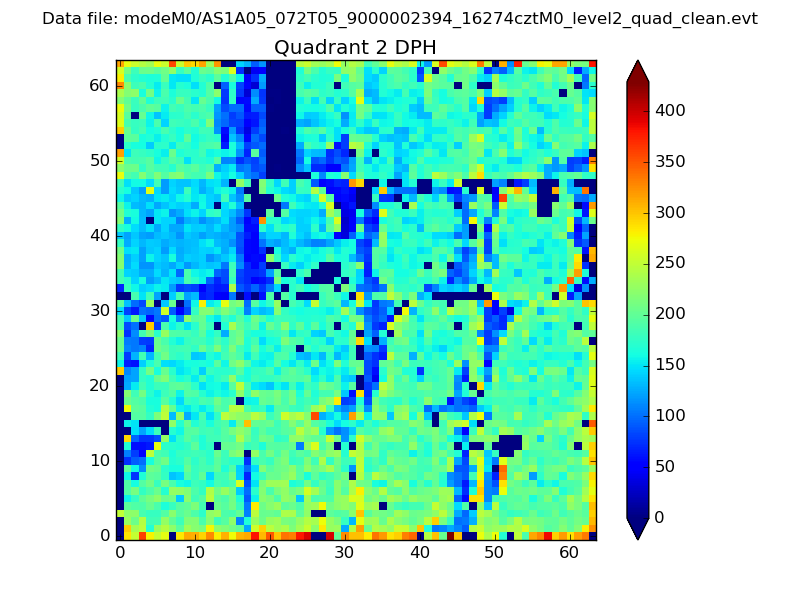 |
Quadrant C |
| Plot type | Count rate plots | Images |
|---|---|---|
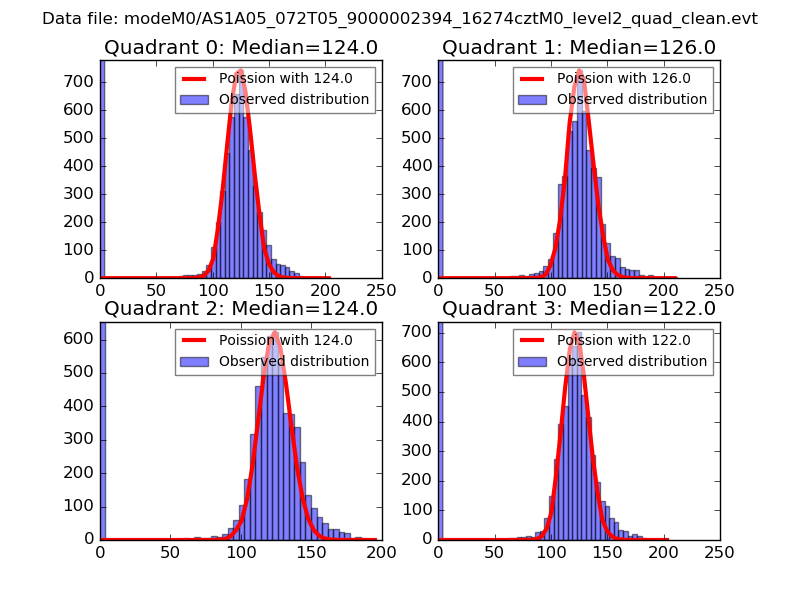
| Comparison with Poisson distribution Blue bars denote a histogram of data divided into 1 sec bins. Red curve is a Poisson curve with rate = median count rate of data. |
 |
 |
| Quadrant-wise count rates Data is divided into 100 sec bins |
 |
|
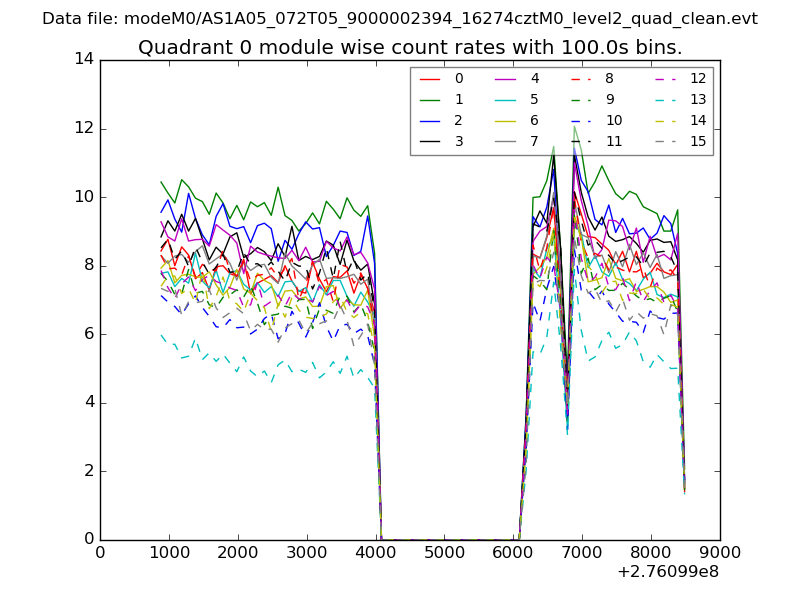
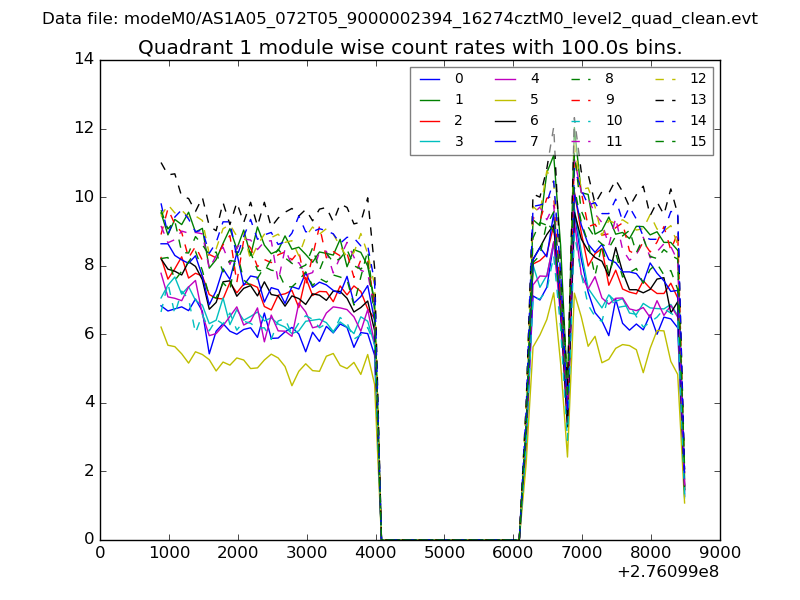
| Module-wise count rates for Quadrant A Data is divided into 100 sec bins |
 |
 |
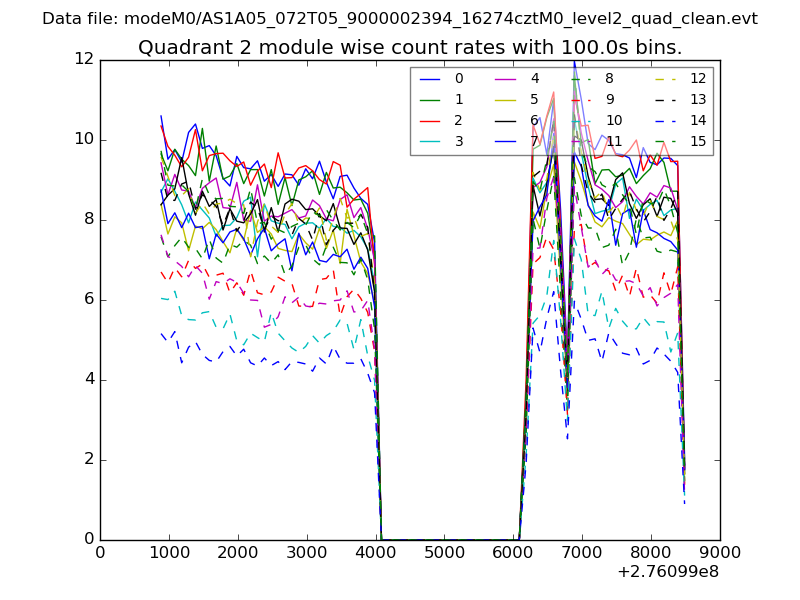
| Module-wise count rates for Quadrant B Data is divided into 100 sec bins |
 |
 |
| Module-wise count rates for Quadrant C Data is divided into 100 sec bins |
 |
 |
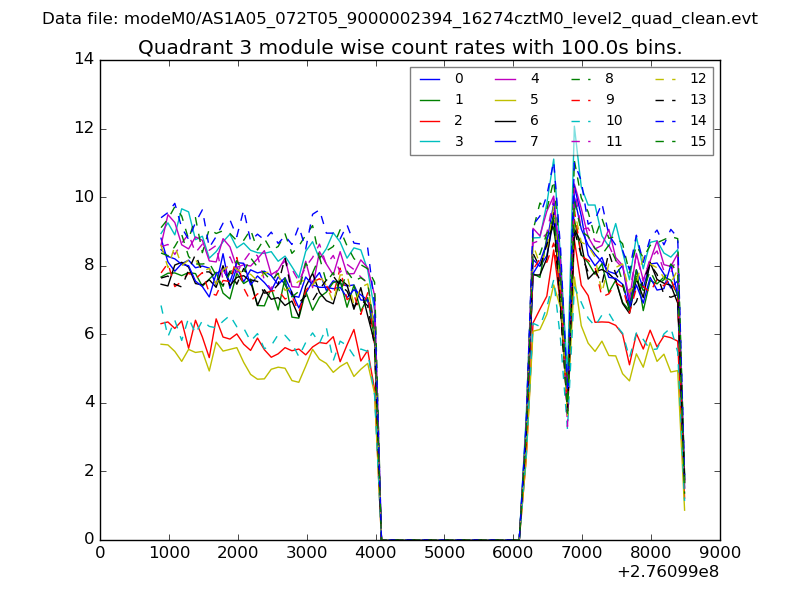
| Module-wise count rates for Quadrant D Data is divided into 100 sec bins |
 |
 |
| Parameter | Plot |
|---|---|
| CZT HV Monitor | 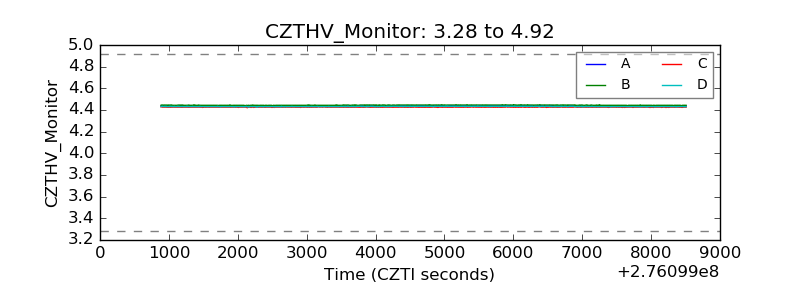 |
| D_VDD | 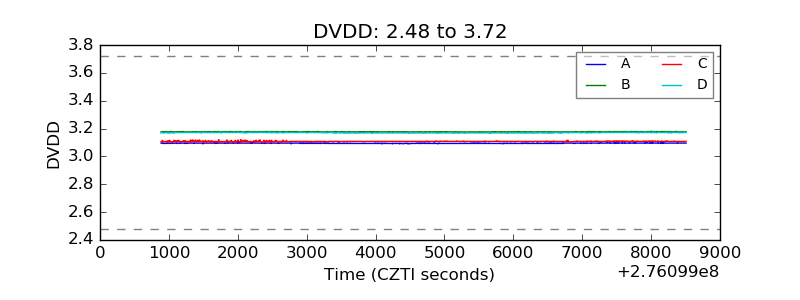 |
| Temperature 1 |  |
| Veto HV Monitor | 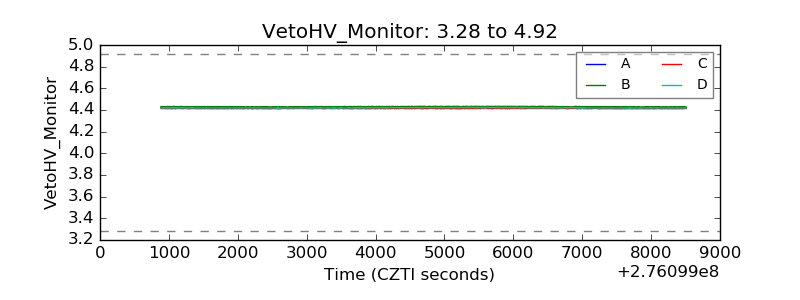 |
| Veto LLD | 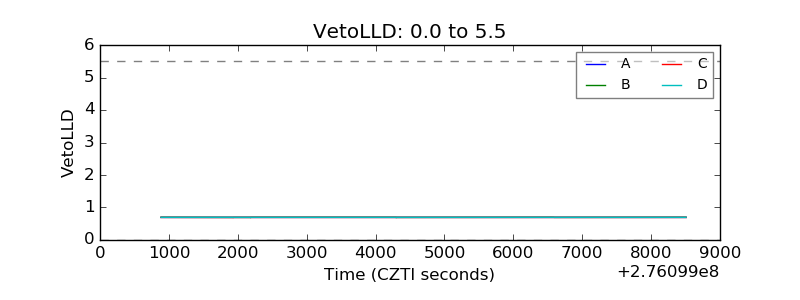 |
| Alpha Counter |  |
| _CPM_Rate | 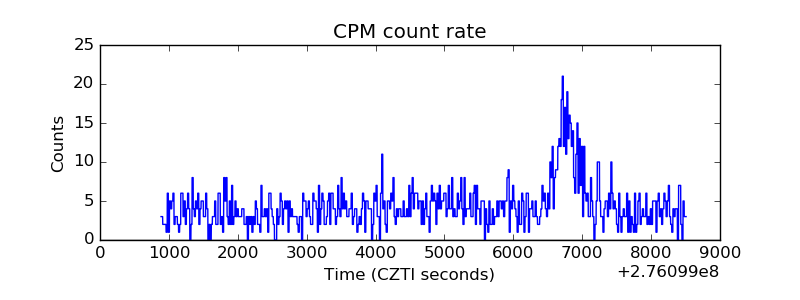 |
| CZT Counter | 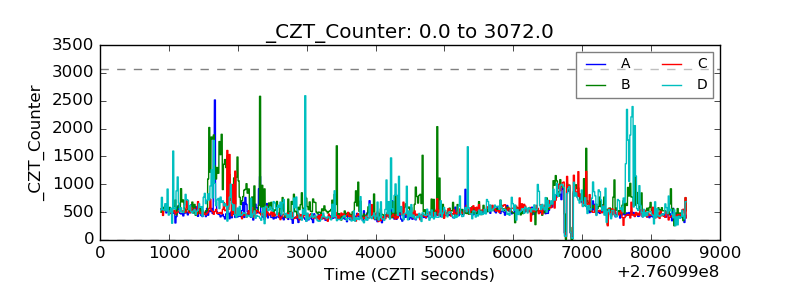 |
| +2.5 Volts monitor |  |
| +5 Volts monitor |  |
| _ROLL_ROT | 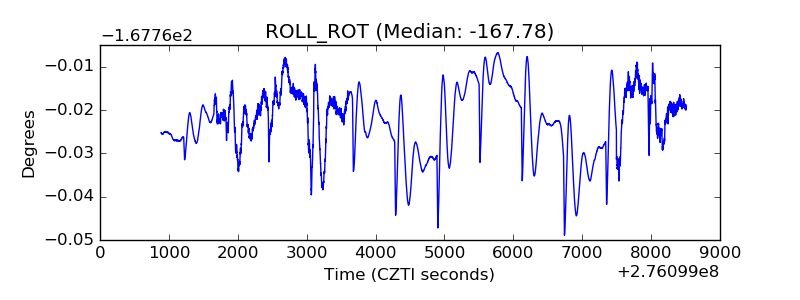 |
| _Roll_DEC | 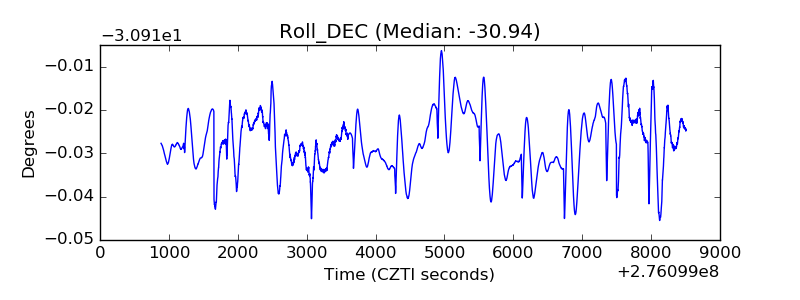 |
| _Roll_RA | 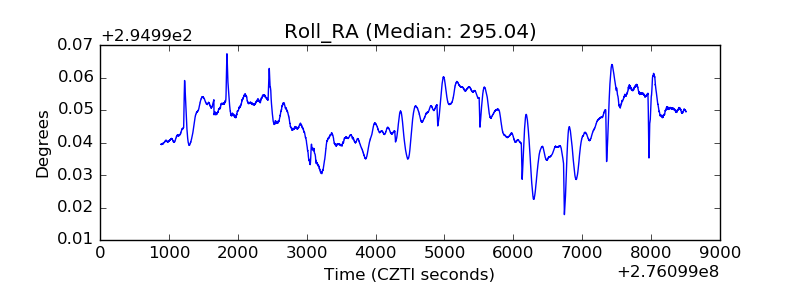 |
| Veto Counter | 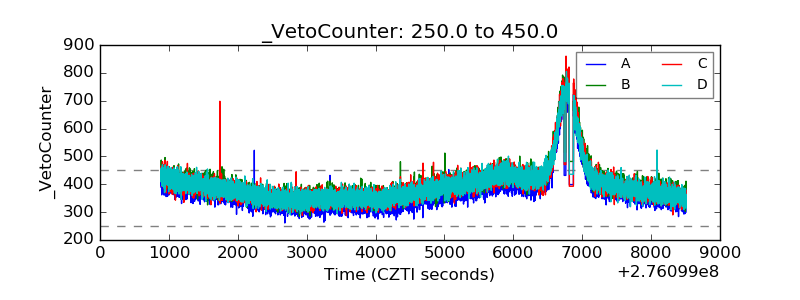 |