| Param | Original file | Final file |
|---|---|---|
| Filename | modeM0/AS1A05_072T05_9000002394_16275cztM0_level2.evt | modeM0/AS1A05_072T05_9000002394_16275cztM0_level2_quad_clean.evt |
| Size (bytes) | 540,581,760 | 107,040,960 |
| Size | 515.5 MB | 102.1 MB |
| Events in quadrant A | 3,668,714 | 678,980 |
| Events in quadrant B | 4,083,176 | 690,161 |
| Events in quadrant C | 3,687,603 | 680,421 |
| Events in quadrant D | 4,414,971 | 662,276 |
| Mode SS | |||
|---|---|---|---|
| Quadrant | BADHDUFLAG | Total packets | Discarded packets |
| A | 0 | 154 | 0 |
| B | 0 | 154 | 0 |
| C | 0 | 154 | 0 |
| D | 0 | 154 | 0 |
| Mode M9 | |||
|---|---|---|---|
| Quadrant | BADHDUFLAG | Total packets | Discarded packets |
| A | 0 | 4 | 0 |
| B | 0 | 4 | 0 |
| C | 0 | 4 | 0 |
| D | 0 | 4 | 0 |
| Mode M0 | |||
|---|---|---|---|
| Quadrant | BADHDUFLAG | Total packets | Discarded packets |
| A | 0 | 16045 | 3 |
| B | 0 | 17082 | 2 |
| C | 0 | 16047 | 2 |
| D | 0 | 18350 | 2 |
| Quadrant | Total seconds | Saturated seconds | Saturation percentage |
|---|---|---|---|
| A | 7619 | 88 | 1.155007% |
| B | 7619 | 89 | 1.168132% |
| C | 7619 | 112 | 1.470009% |
| D | 7620 | 110 | 1.443570% |
Noise dominated data is calculated using 1-second bins in cleaned event files. If a bin has >2000 counts, and if more than 50% of those come from <1% of pixels, then it is considered to be noise-dominated and hence unusable.
| Quadrant | # 1 sec bins | Bins with >0 counts | Bins with >2000 counts | High rate bins dominated by noise | Noise dominated (total time) | Noise dominated (detector-on time) | Marked lightcurve |
|---|---|---|---|---|---|---|---|
| A | 8015 | 7621 | 34 | 34 | 0.42% | 0.45% | 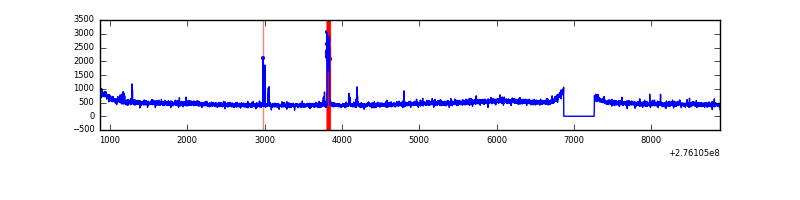 |
| B | 8015 | 7621 | 0 | 0 | 0.00% | 0.00% | 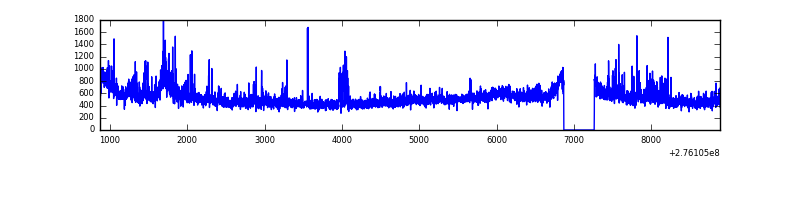 |
| C | 8015 | 7621 | 2 | 2 | 0.02% | 0.03% | 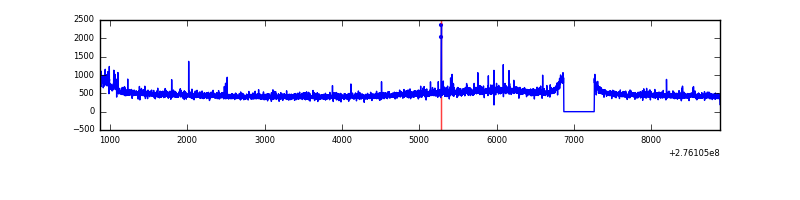 |
| D | 8016 | 7622 | 73 | 73 | 0.91% | 0.96% | 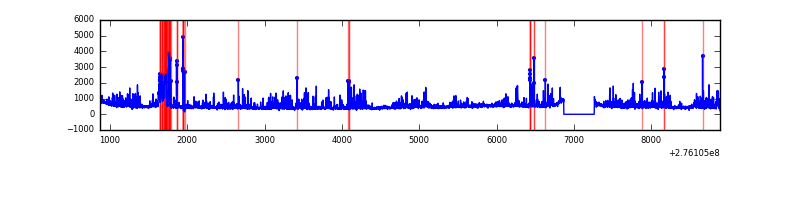 |
Top three noisy pixels from each quadrant. If the there are fewer than three noisy pixels in the level2.evt file, extra rows are filled as -1
| Pixel properties | Quadrant properties | ||||||
|---|---|---|---|---|---|---|---|
| Quadrant | DetID | PixID | Counts | Sigma | Mean | Median | Sigma |
| A | 15 | 174 | 105345 | 552.44 | 922 | 902 | 189.1 |
| A | 13 | 248 | 19047 | 95.98 | 922 | 902 | 189.1 |
| A | 0 | 226 | 8119 | 38.17 | 922 | 902 | 189.1 |
| B | 0 | 219 | 141257 | 785.22 | 922 | 898 | 178.8 |
| B | 0 | 198 | 56069 | 308.65 | 922 | 898 | 178.8 |
| B | 4 | 216 | 55076 | 303.09 | 922 | 898 | 178.8 |
| C | 14 | 238 | 136736 | 653.62 | 883 | 887 | 207.8 |
| C | 3 | 233 | 61105 | 289.73 | 883 | 887 | 207.8 |
| C | 0 | 207 | 49009 | 231.53 | 883 | 887 | 207.8 |
| D | 1 | 52 | 698009 | 3192.46 | 894 | 866 | 218.4 |
| D | 15 | 0 | 215316 | 982.04 | 894 | 866 | 218.4 |
| D | 10 | 70 | 123629 | 562.17 | 894 | 866 | 218.4 |
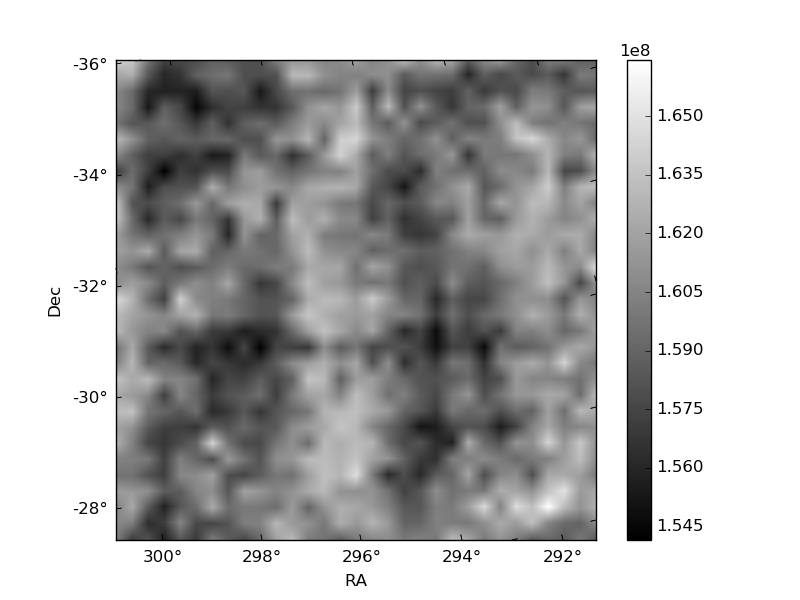
Histogram calculated using DETX and DETY for each event in the final _common_clean file
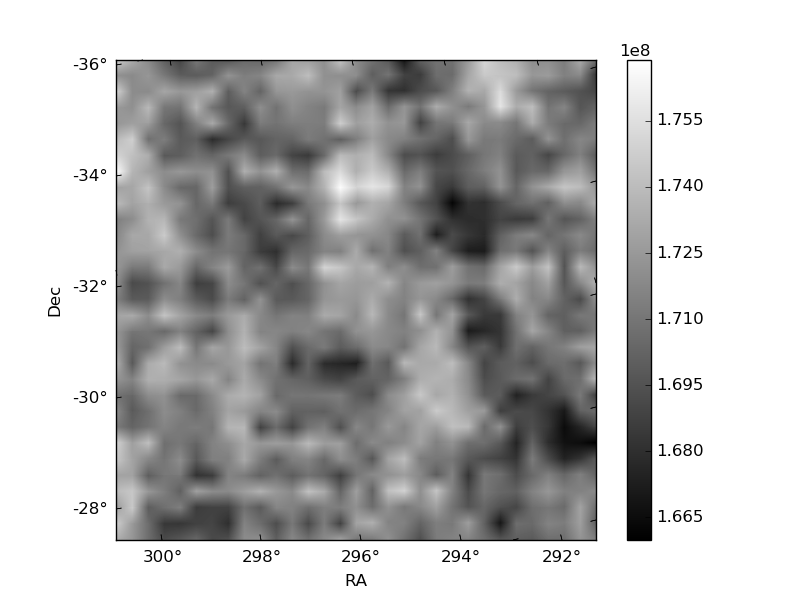
| Quadrant A | 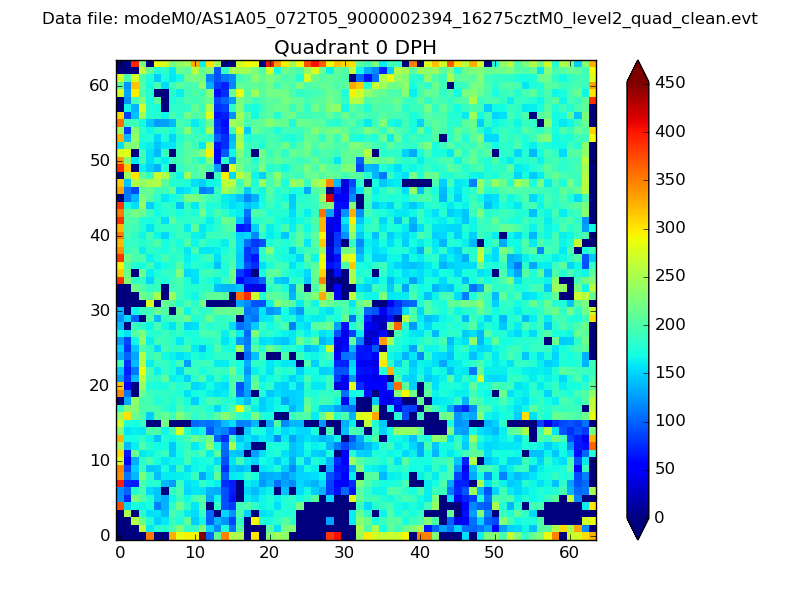 |
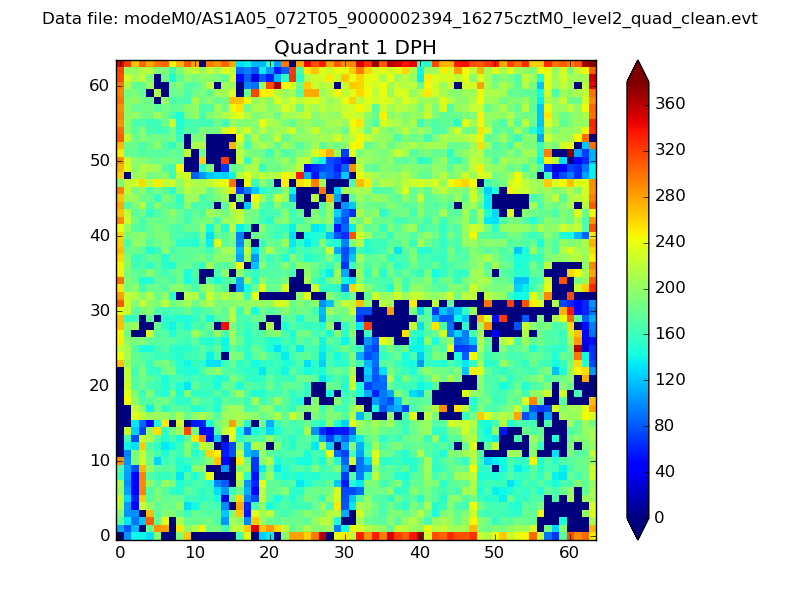 |
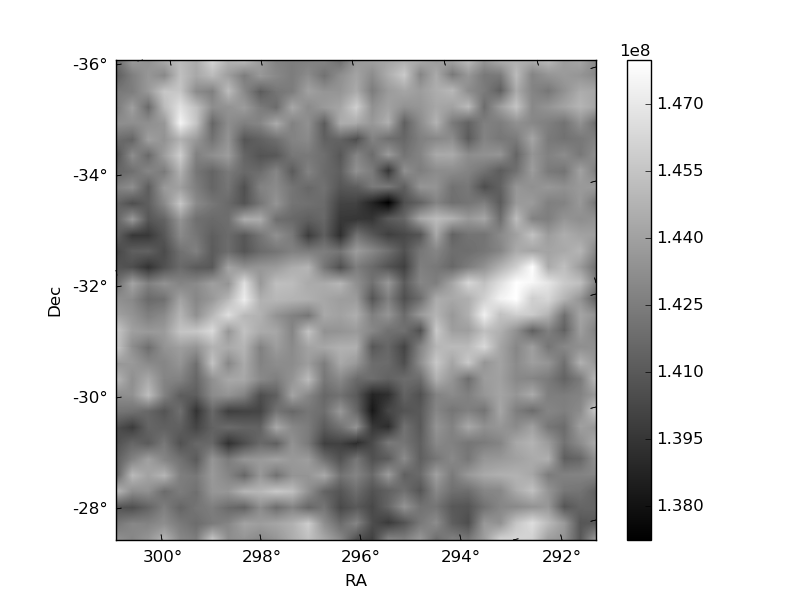
Quadrant B |
|---|---|---|---|
| Quadrant D | 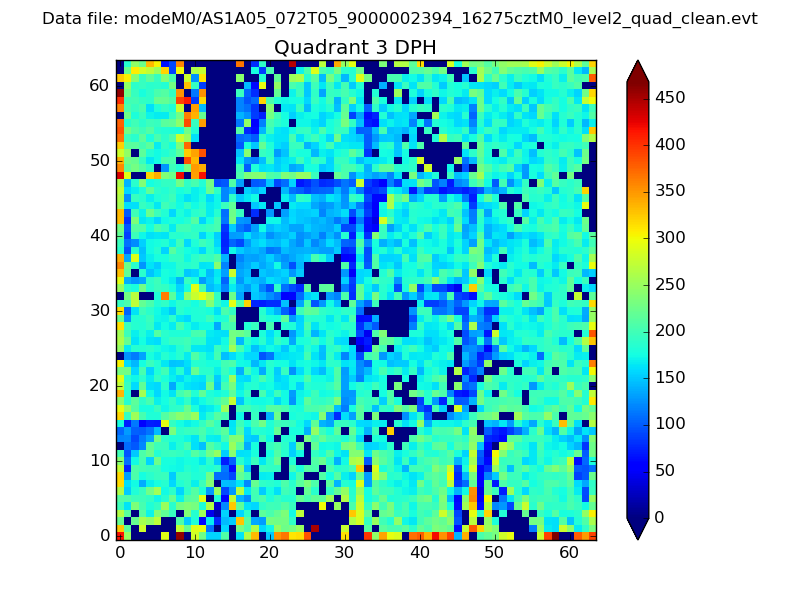 |
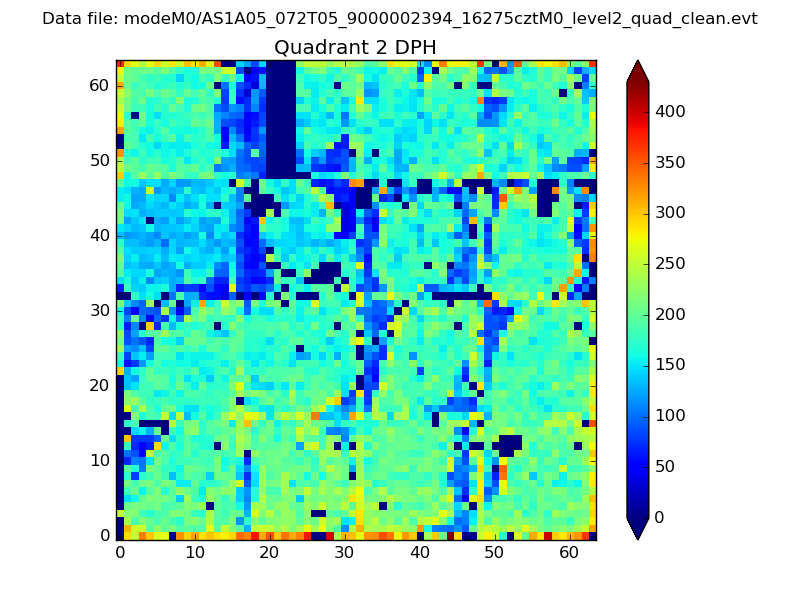 |
Quadrant C |
| Plot type | Count rate plots | Images |
|---|---|---|
| Comparison with Poisson distribution Blue bars denote a histogram of data divided into 1 sec bins. Red curve is a Poisson curve with rate = median count rate of data. |
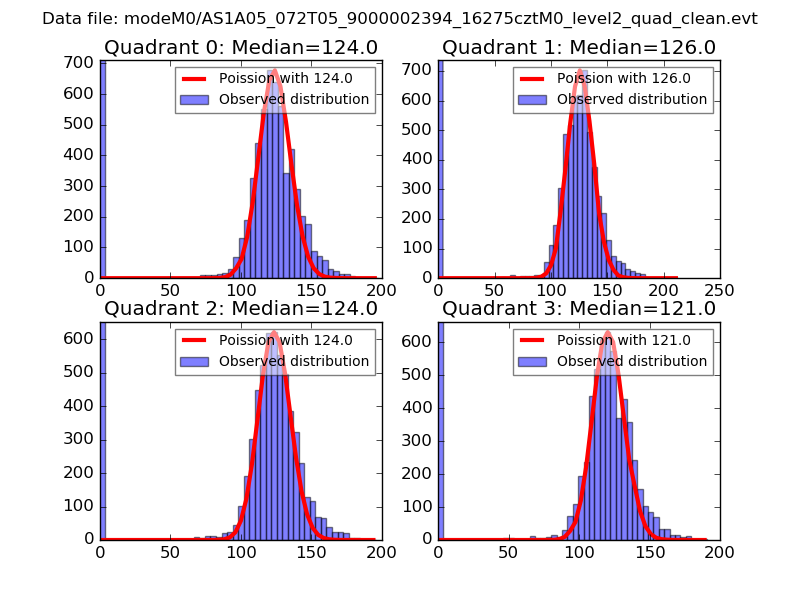 |
 |
| Quadrant-wise count rates Data is divided into 100 sec bins |
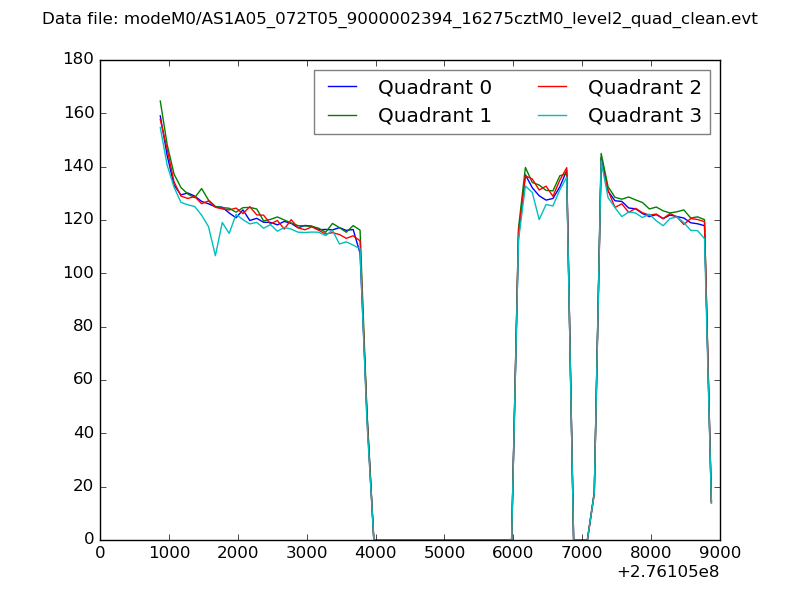 |
|
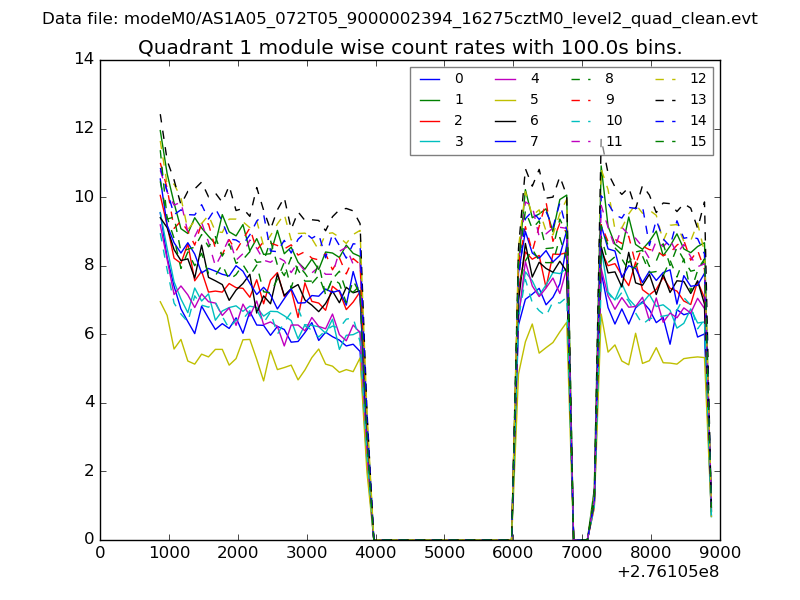
| Module-wise count rates for Quadrant A Data is divided into 100 sec bins |
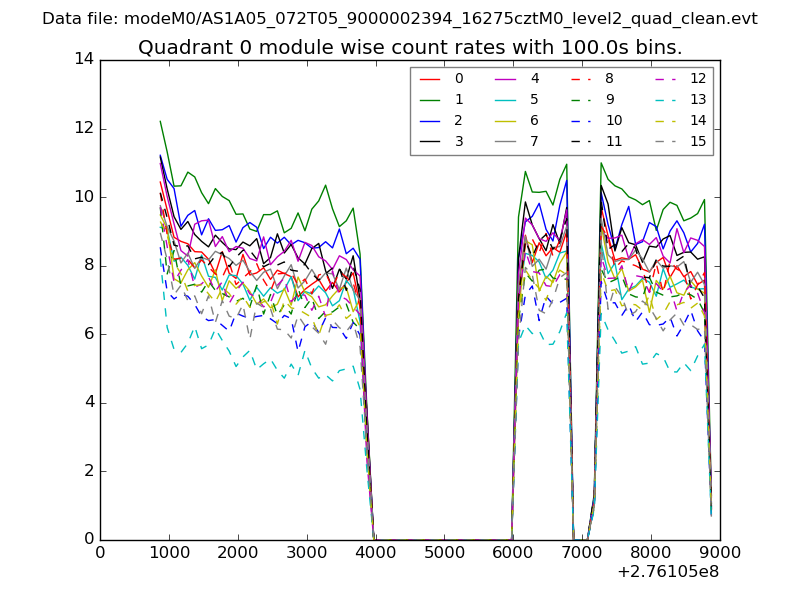 |
 |
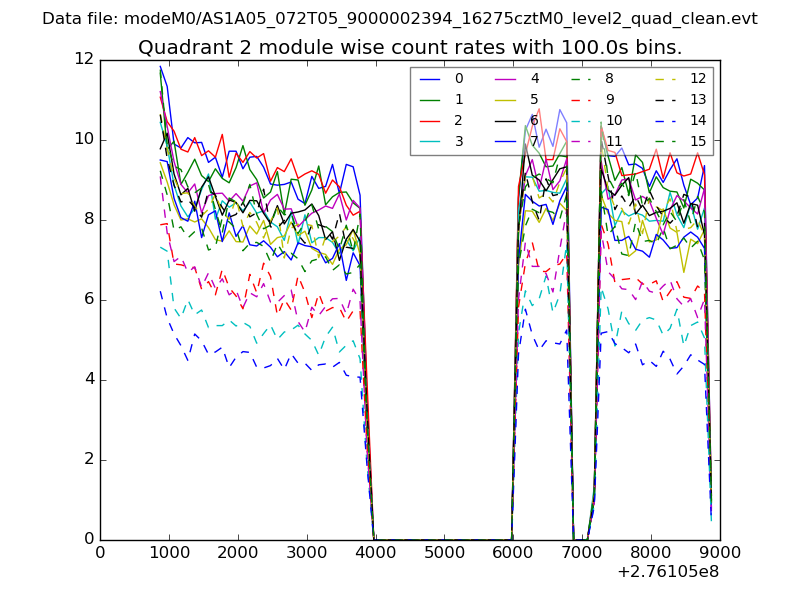
| Module-wise count rates for Quadrant B Data is divided into 100 sec bins |
 |
 |
| Module-wise count rates for Quadrant C Data is divided into 100 sec bins |
 |
 |
| Module-wise count rates for Quadrant D Data is divided into 100 sec bins |
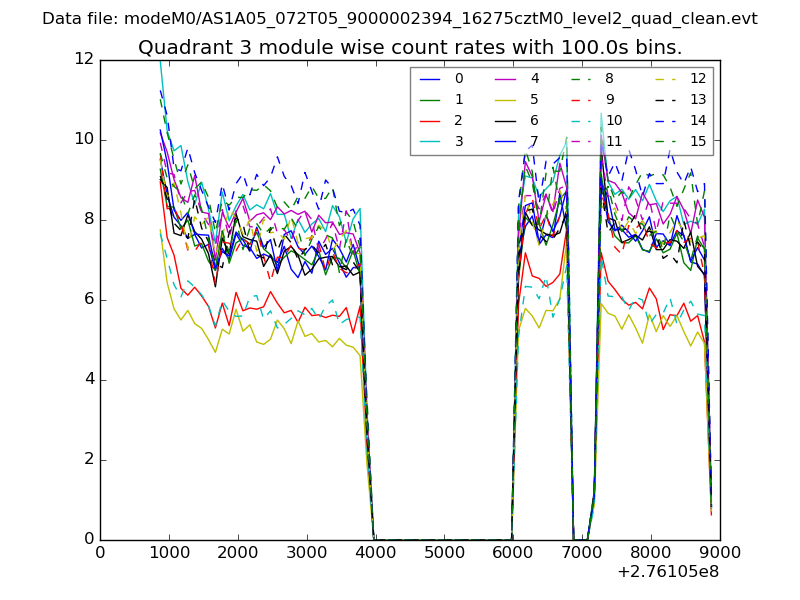 |
 |
| Parameter | Plot |
|---|---|
| CZT HV Monitor | 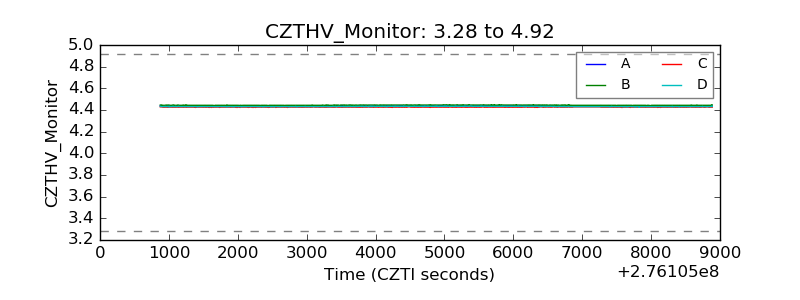 |
| D_VDD | 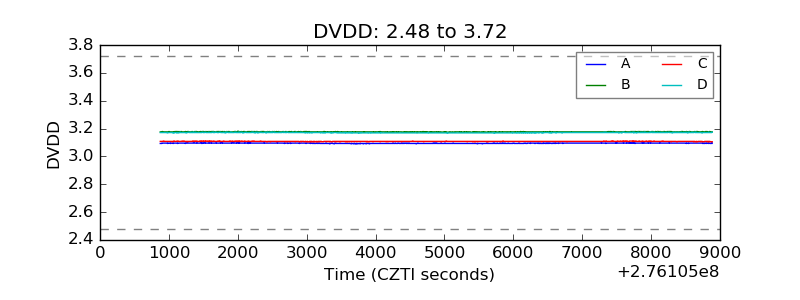 |
| Temperature 1 | 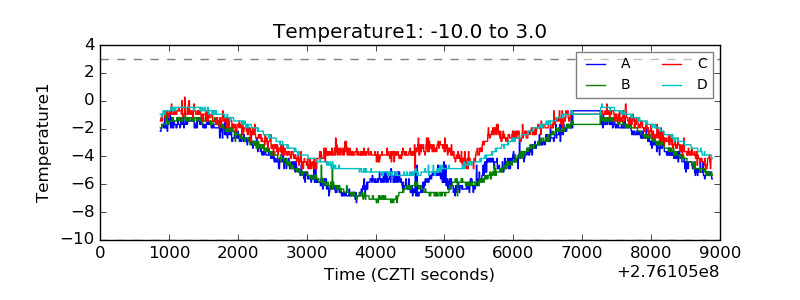 |
| Veto HV Monitor | 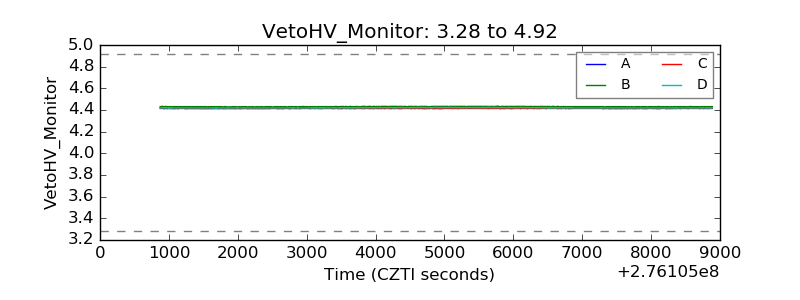 |
| Veto LLD | 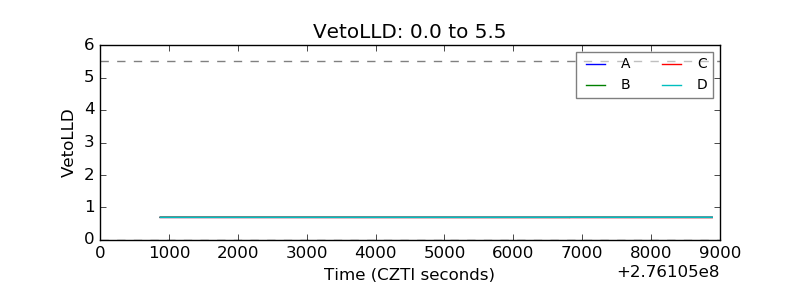 |
| Alpha Counter | 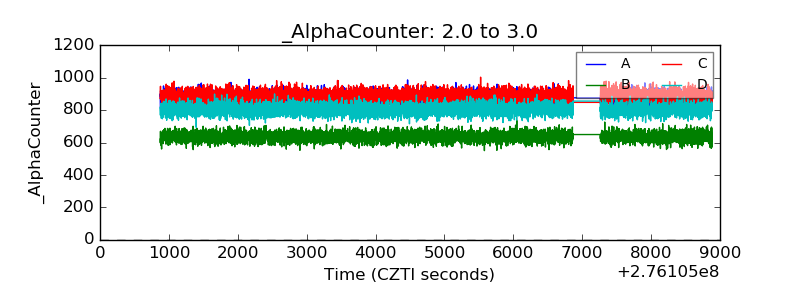 |
| _CPM_Rate |  |
| CZT Counter | 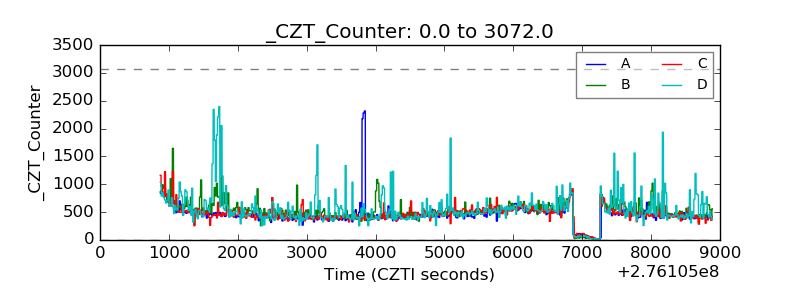 |
| +2.5 Volts monitor |  |
| +5 Volts monitor |  |
| _ROLL_ROT | 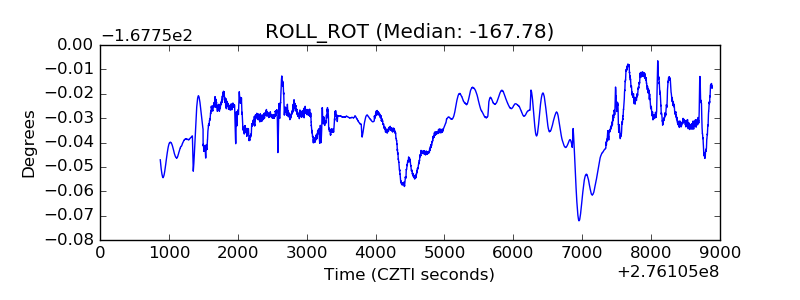 |
| _Roll_DEC | 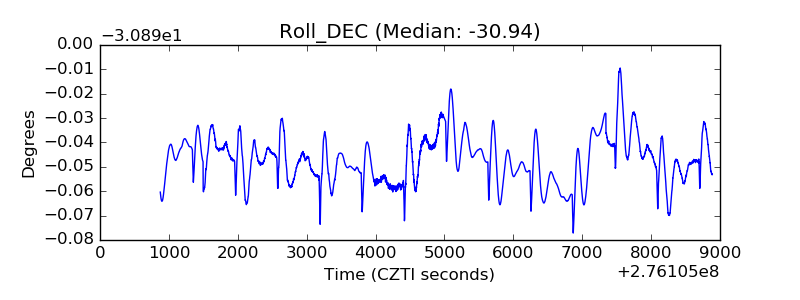 |
| _Roll_RA | 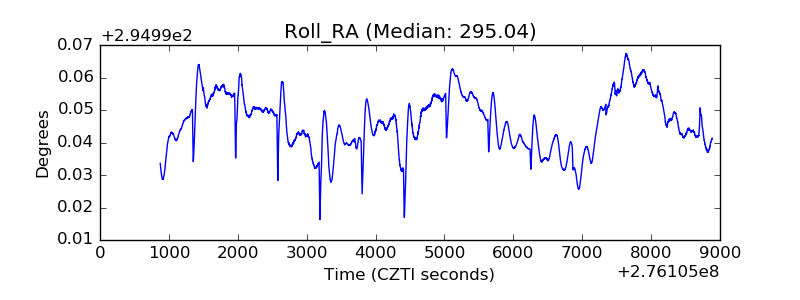 |
| Veto Counter | 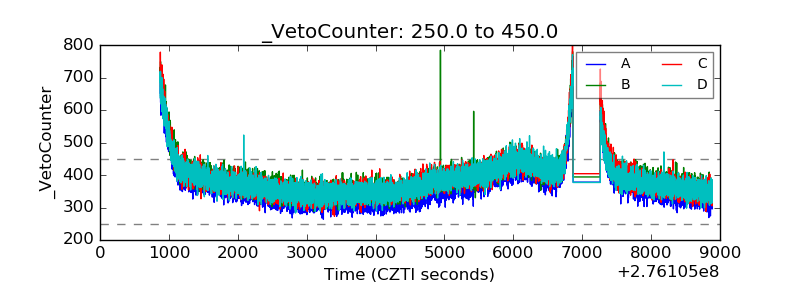 |