| Param | Original file | Final file |
|---|---|---|
| Filename | modeM0/AS1A05_072T05_9000002394_16278cztM0_level2.evt | modeM0/AS1A05_072T05_9000002394_16278cztM0_level2_quad_clean.evt |
| Size (bytes) | 492,154,560 | 94,210,560 |
| Size | 469.4 MB | 89.8 MB |
| Events in quadrant A | 3,731,727 | 585,715 |
| Events in quadrant B | 3,570,715 | 603,428 |
| Events in quadrant C | 3,428,727 | 588,744 |
| Events in quadrant D | 3,686,522 | 575,487 |
| Mode SS | |||
|---|---|---|---|
| Quadrant | BADHDUFLAG | Total packets | Discarded packets |
| A | 0 | 146 | 0 |
| B | 0 | 146 | 0 |
| C | 0 | 146 | 0 |
| D | 0 | 146 | 0 |
| Mode M9 | |||
|---|---|---|---|
| Quadrant | BADHDUFLAG | Total packets | Discarded packets |
| A | 0 | 18 | 0 |
| B | 0 | 18 | 0 |
| C | 0 | 18 | 0 |
| D | 0 | 18 | 0 |
| Mode M0 | |||
|---|---|---|---|
| Quadrant | BADHDUFLAG | Total packets | Discarded packets |
| A | 0 | 15772 | 3 |
| B | 0 | 15231 | 2 |
| C | 0 | 14806 | 2 |
| D | 0 | 15947 | 2 |
| Quadrant | Total seconds | Saturated seconds | Saturation percentage |
|---|---|---|---|
| A | 7180 | 90 | 1.253482% |
| B | 7180 | 49 | 0.682451% |
| C | 7180 | 52 | 0.724234% |
| D | 7180 | 78 | 1.086351% |
Noise dominated data is calculated using 1-second bins in cleaned event files. If a bin has >2000 counts, and if more than 50% of those come from <1% of pixels, then it is considered to be noise-dominated and hence unusable.
| Quadrant | # 1 sec bins | Bins with >0 counts | Bins with >2000 counts | High rate bins dominated by noise | Noise dominated (total time) | Noise dominated (detector-on time) | Marked lightcurve |
|---|---|---|---|---|---|---|---|
| A | 8911 | 7183 | 41 | 41 | 0.46% | 0.57% | 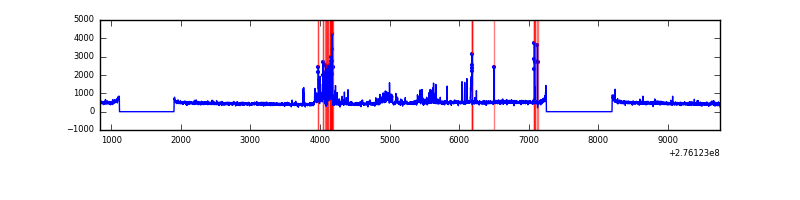 |
| B | 8911 | 7183 | 3 | 3 | 0.03% | 0.04% | 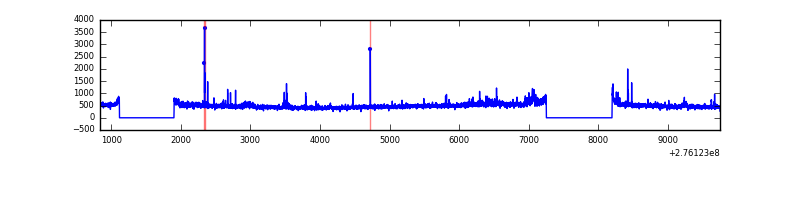 |
| C | 8911 | 7183 | 0 | 0 | 0.00% | 0.00% | 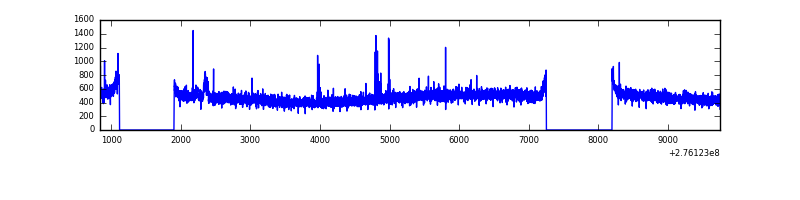 |
| D | 8911 | 7183 | 44 | 44 | 0.49% | 0.61% | 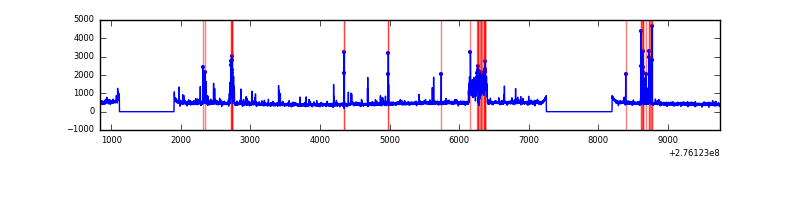 |
Top three noisy pixels from each quadrant. If the there are fewer than three noisy pixels in the level2.evt file, extra rows are filled as -1
| Pixel properties | Quadrant properties | ||||||
|---|---|---|---|---|---|---|---|
| Quadrant | DetID | PixID | Counts | Sigma | Mean | Median | Sigma |
| A | 15 | 174 | 452569 | 2635.71 | 849 | 829 | 171.4 |
| A | 9 | 143 | 12909 | 70.48 | 849 | 829 | 171.4 |
| A | 0 | 226 | 7401 | 38.34 | 849 | 829 | 171.4 |
| B | 4 | 216 | 59686 | 353.89 | 860 | 836 | 166.3 |
| B | 0 | 189 | 48310 | 285.48 | 860 | 836 | 166.3 |
| B | 0 | 198 | 45031 | 265.76 | 860 | 836 | 166.3 |
| C | 14 | 238 | 124765 | 644.82 | 823 | 829 | 192.2 |
| C | 3 | 233 | 65697 | 337.5 | 823 | 829 | 192.2 |
| C | 0 | 207 | 29456 | 148.94 | 823 | 829 | 192.2 |
| D | 1 | 52 | 423383 | 2088.46 | 829 | 805 | 202.3 |
| D | 10 | 70 | 97014 | 475.48 | 829 | 805 | 202.3 |
| D | 2 | 234 | 27392 | 131.4 | 829 | 805 | 202.3 |
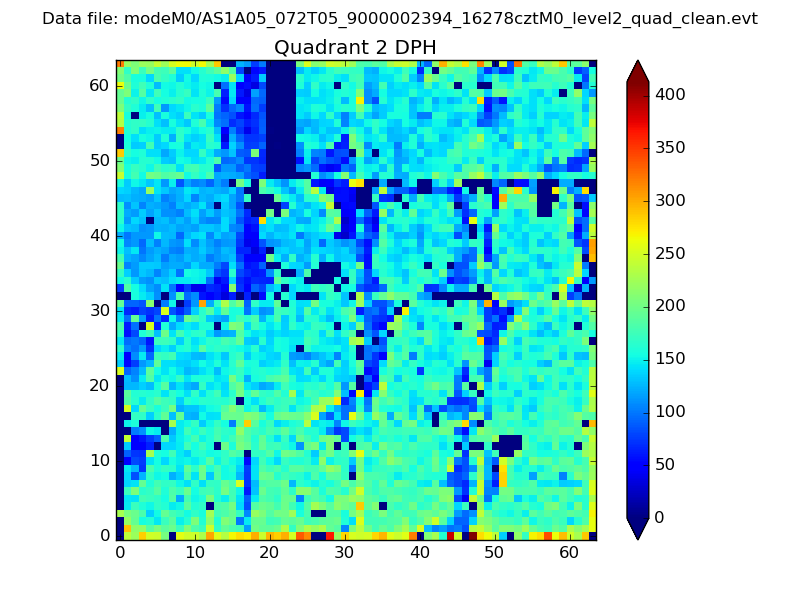
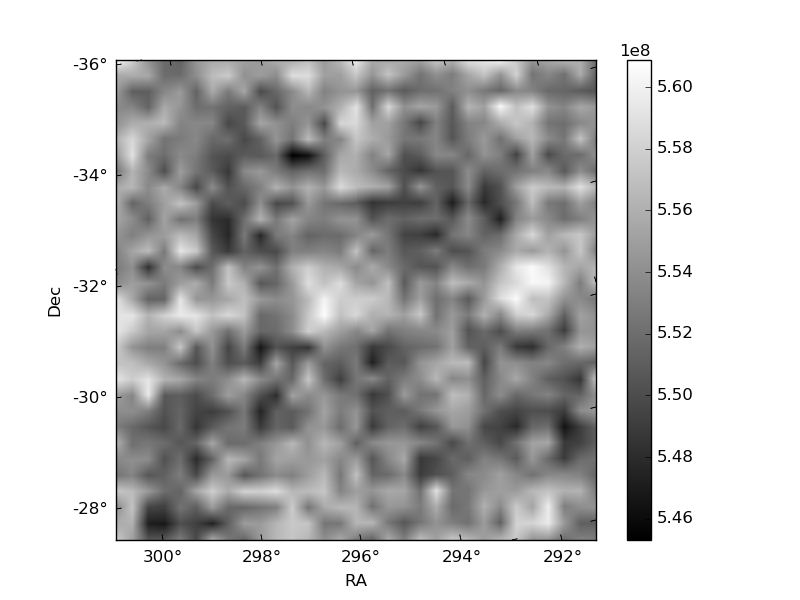
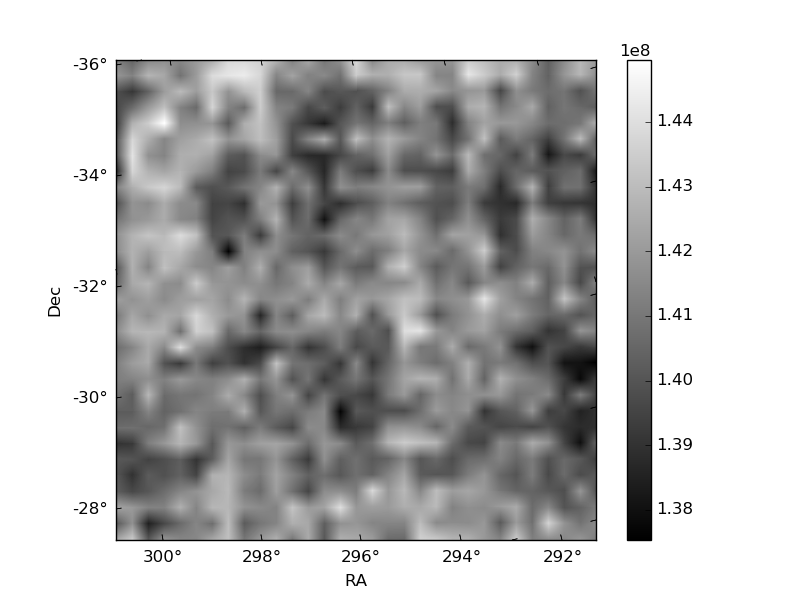
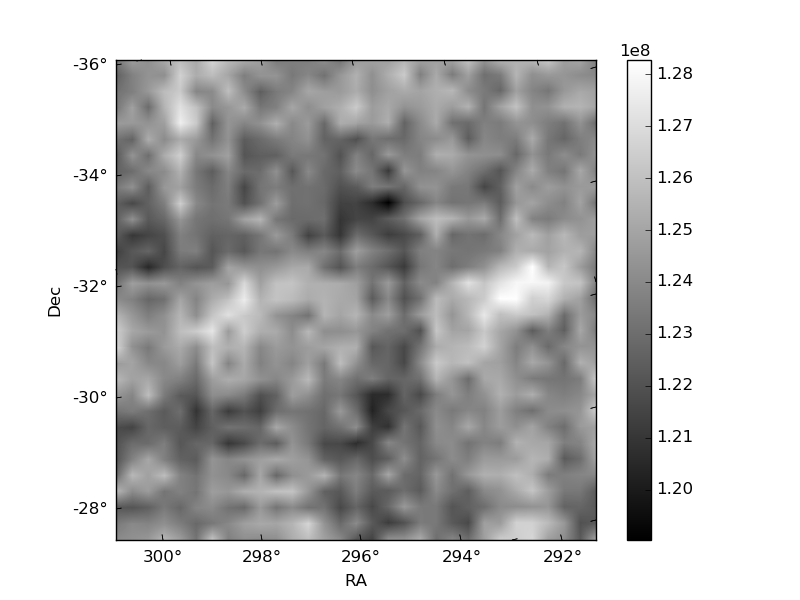
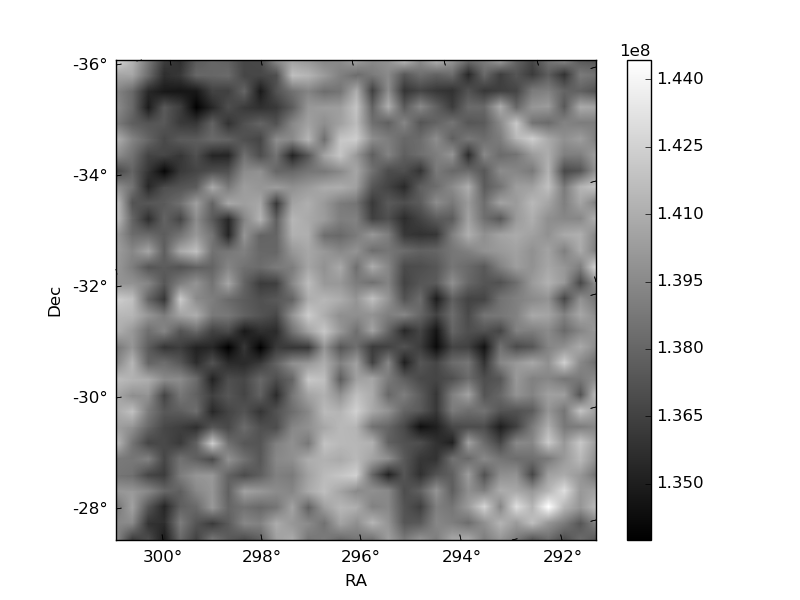
Histogram calculated using DETX and DETY for each event in the final _common_clean file
| Quadrant A | 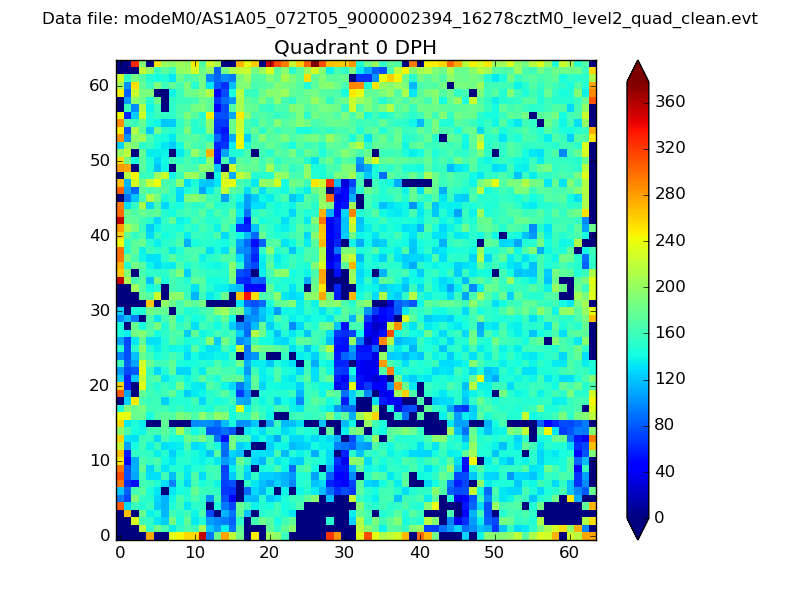 |
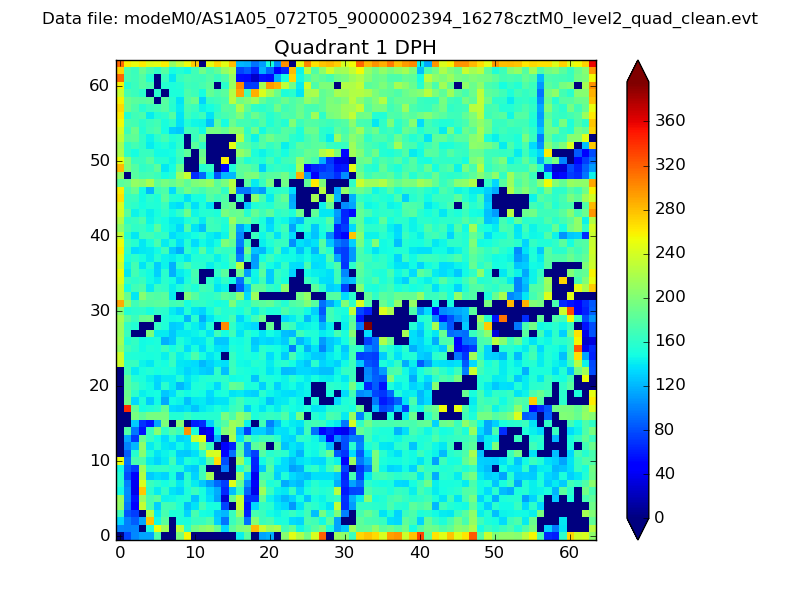 |
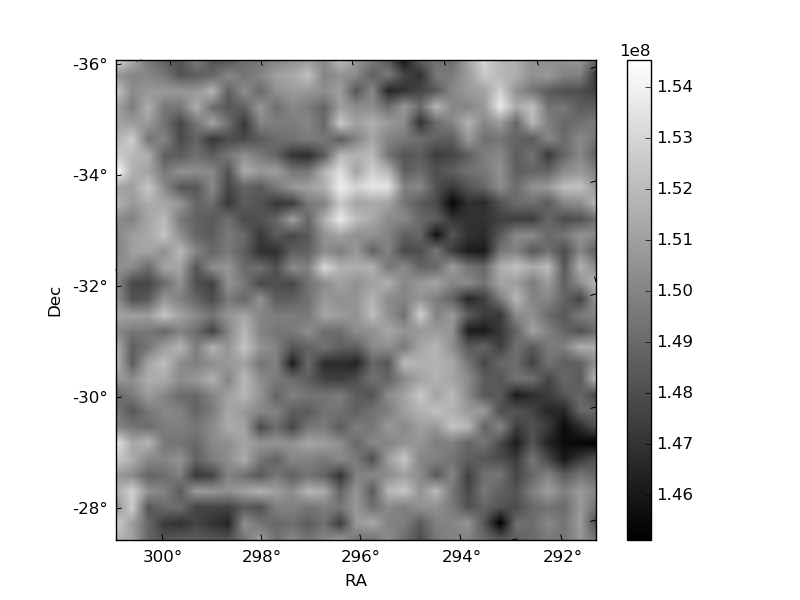
Quadrant B |
|---|---|---|---|
| Quadrant D | 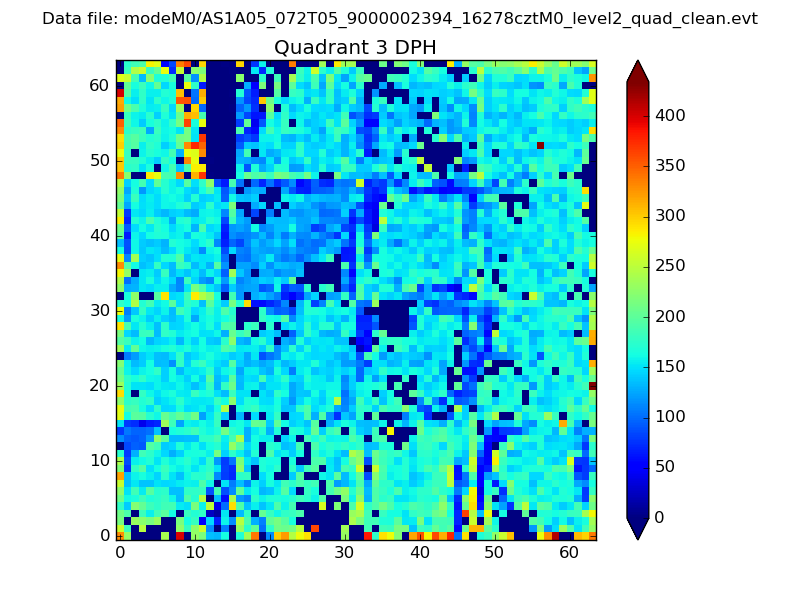 |
 |
Quadrant C |
| Plot type | Count rate plots | Images |
|---|---|---|
| Comparison with Poisson distribution Blue bars denote a histogram of data divided into 1 sec bins. Red curve is a Poisson curve with rate = median count rate of data. |
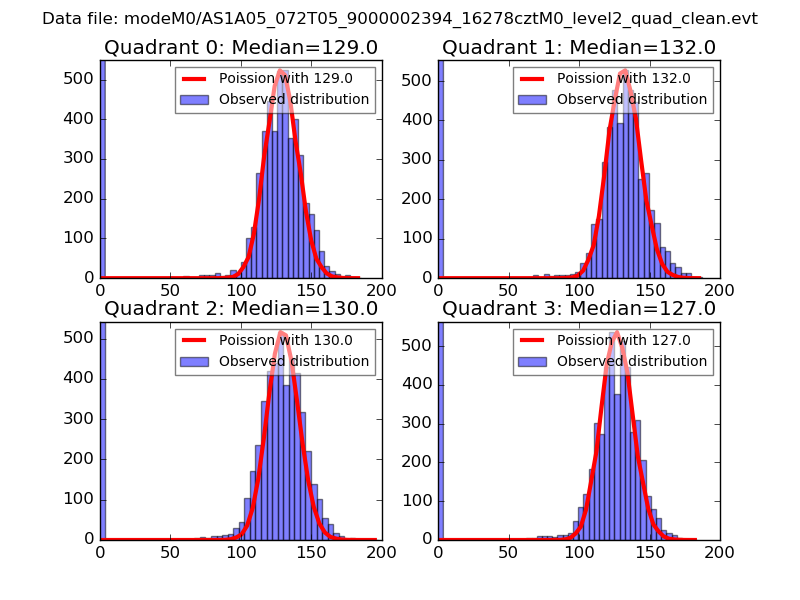 |
 |
| Quadrant-wise count rates Data is divided into 100 sec bins |
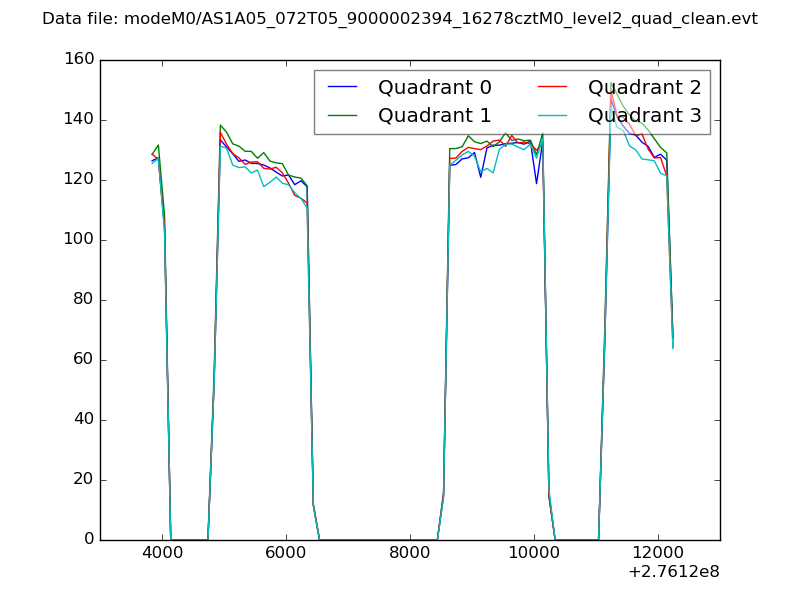 |
|
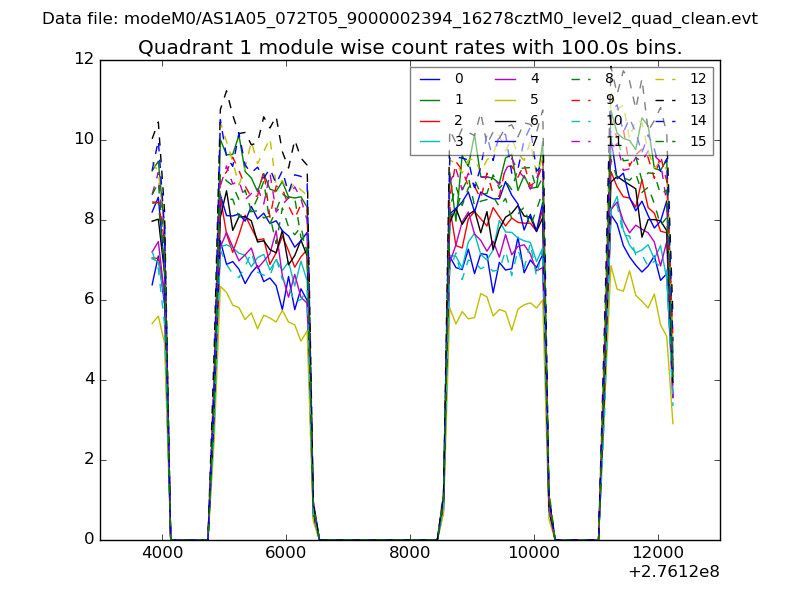
| Module-wise count rates for Quadrant A Data is divided into 100 sec bins |
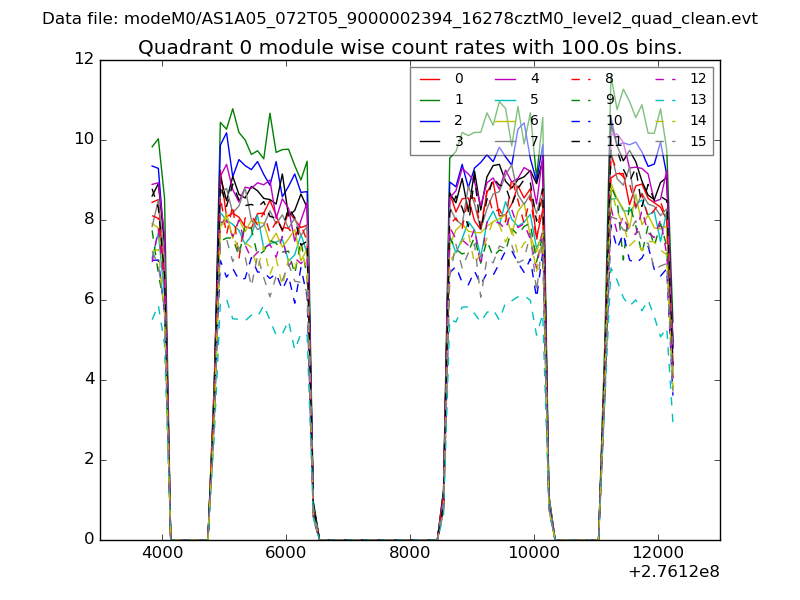 |
 |
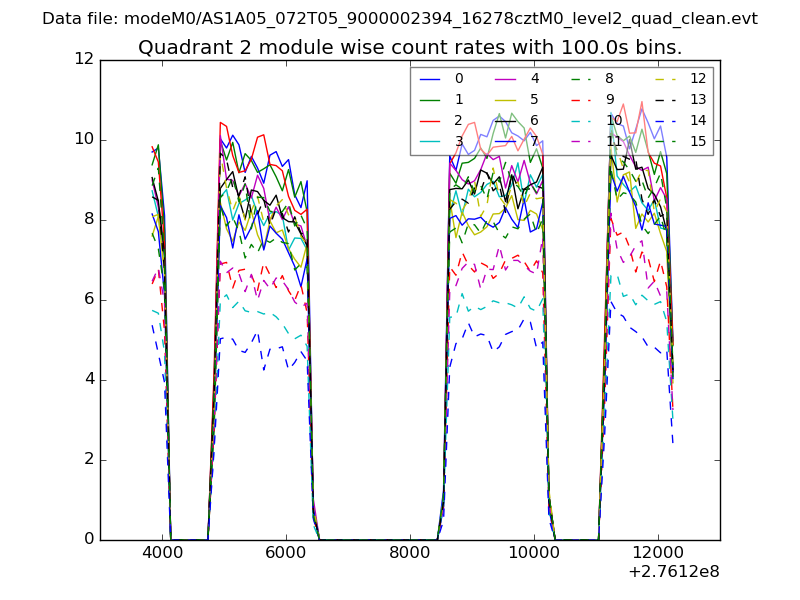
| Module-wise count rates for Quadrant B Data is divided into 100 sec bins |
 |
 |
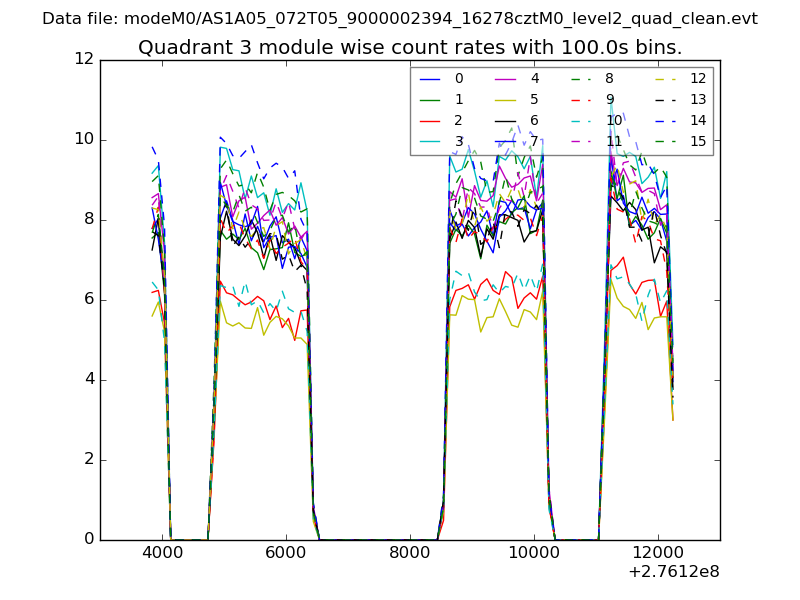
| Module-wise count rates for Quadrant C Data is divided into 100 sec bins |
 |
 |
| Module-wise count rates for Quadrant D Data is divided into 100 sec bins |
 |
 |
| Parameter | Plot |
|---|---|
| CZT HV Monitor | 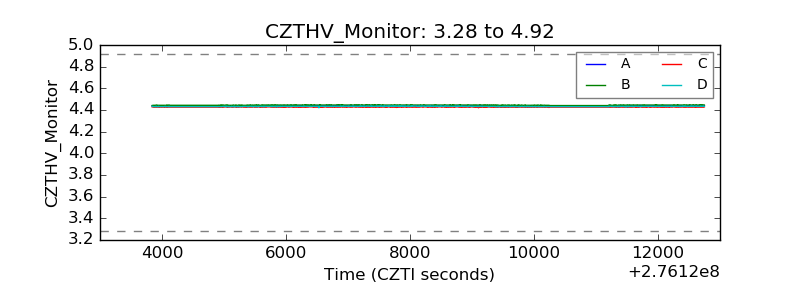 |
| D_VDD | 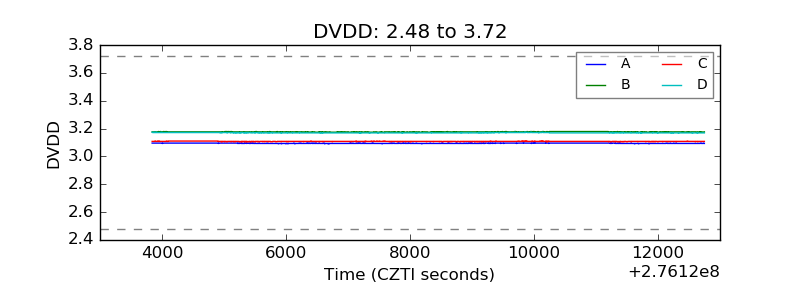 |
| Temperature 1 | 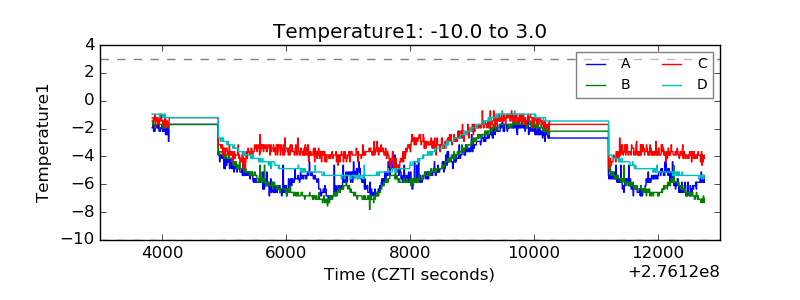 |
| Veto HV Monitor |  |
| Veto LLD | 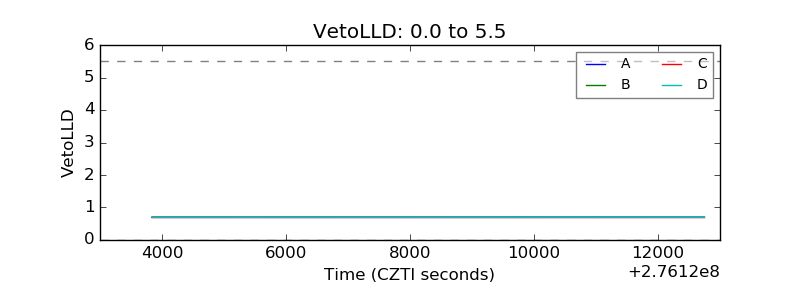 |
| Alpha Counter | 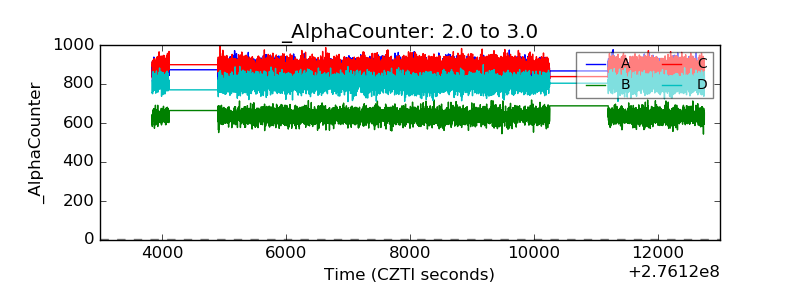 |
| _CPM_Rate | 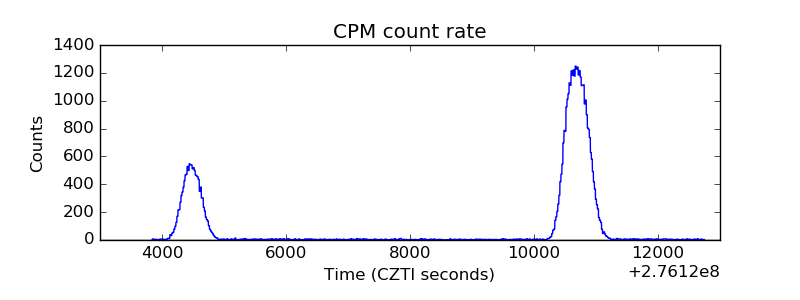 |
| CZT Counter | 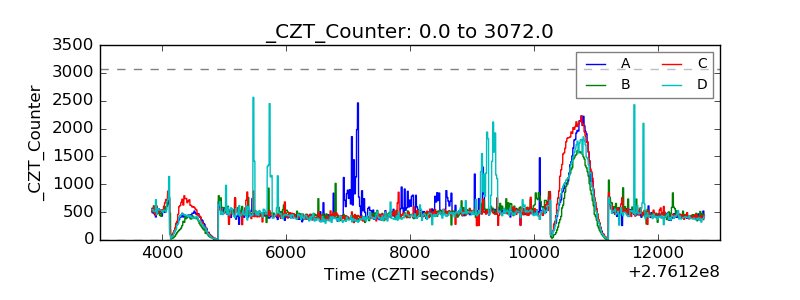 |
| +2.5 Volts monitor |  |
| +5 Volts monitor |  |
| _ROLL_ROT | 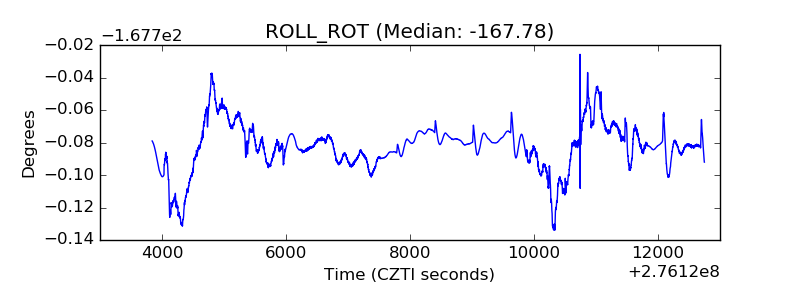 |
| _Roll_DEC | 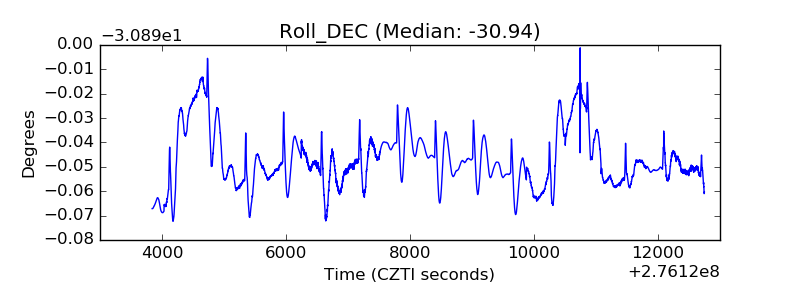 |
| _Roll_RA | 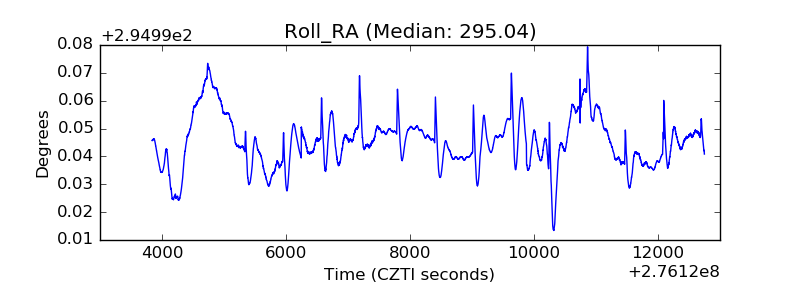 |
| Veto Counter | 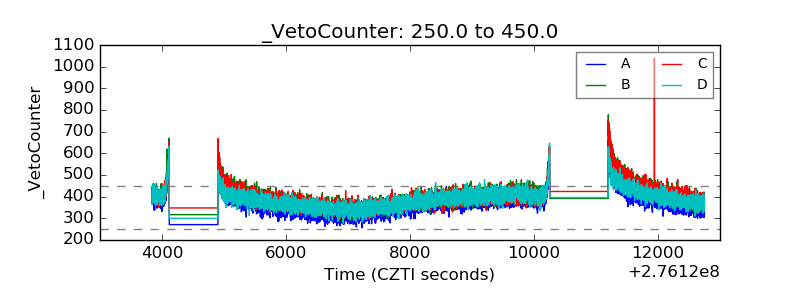 |