| Param | Original file | Final file |
|---|---|---|
| Filename | modeM0/AS1A05_072T05_9000002394_16279cztM0_level2.evt | modeM0/AS1A05_072T05_9000002394_16279cztM0_level2_quad_clean.evt |
| Size (bytes) | 488,543,040 | 86,808,960 |
| Size | 465.9 MB | 82.8 MB |
| Events in quadrant A | 3,751,387 | 534,652 |
| Events in quadrant B | 3,592,658 | 551,739 |
| Events in quadrant C | 3,407,427 | 537,686 |
| Events in quadrant D | 3,572,841 | 521,131 |
| Mode SS | |||
|---|---|---|---|
| Quadrant | BADHDUFLAG | Total packets | Discarded packets |
| A | 0 | 142 | 0 |
| B | 0 | 142 | 0 |
| C | 0 | 142 | 0 |
| D | 0 | 142 | 0 |
| Mode M9 | |||
|---|---|---|---|
| Quadrant | BADHDUFLAG | Total packets | Discarded packets |
| A | 0 | 20 | 0 |
| B | 0 | 20 | 0 |
| C | 0 | 20 | 0 |
| D | 0 | 20 | 0 |
| Mode M0 | |||
|---|---|---|---|
| Quadrant | BADHDUFLAG | Total packets | Discarded packets |
| A | 0 | 15547 | 3 |
| B | 0 | 15052 | 2 |
| C | 0 | 14376 | 2 |
| D | 0 | 15357 | 2 |
| Quadrant | Total seconds | Saturated seconds | Saturation percentage |
|---|---|---|---|
| A | 6943 | 55 | 0.792165% |
| B | 6943 | 75 | 1.080225% |
| C | 6943 | 72 | 1.037016% |
| D | 6943 | 120 | 1.728359% |
Noise dominated data is calculated using 1-second bins in cleaned event files. If a bin has >2000 counts, and if more than 50% of those come from <1% of pixels, then it is considered to be noise-dominated and hence unusable.
| Quadrant | # 1 sec bins | Bins with >0 counts | Bins with >2000 counts | High rate bins dominated by noise | Noise dominated (total time) | Noise dominated (detector-on time) | Marked lightcurve |
|---|---|---|---|---|---|---|---|
| A | 8959 | 6946 | 15 | 15 | 0.17% | 0.22% | 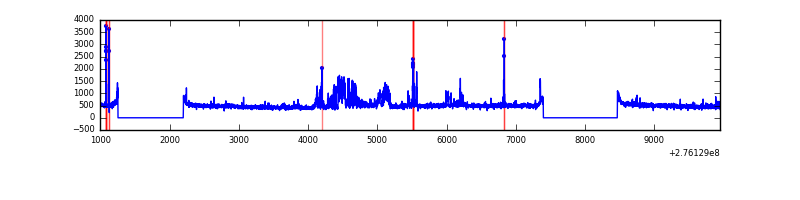 |
| B | 8959 | 6946 | 1 | 1 | 0.01% | 0.01% | 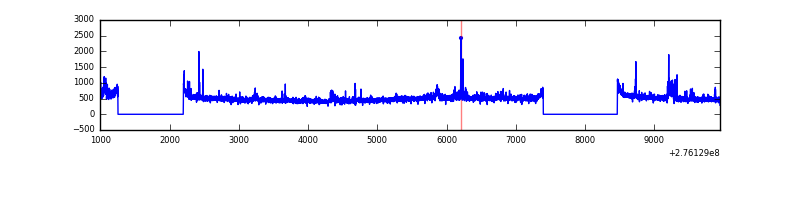 |
| C | 8959 | 6946 | 3 | 3 | 0.03% | 0.04% | 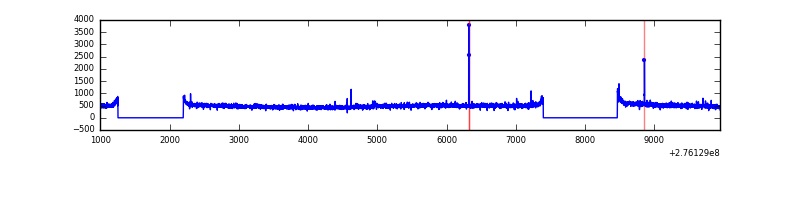 |
| D | 8959 | 6946 | 72 | 72 | 0.80% | 1.04% | 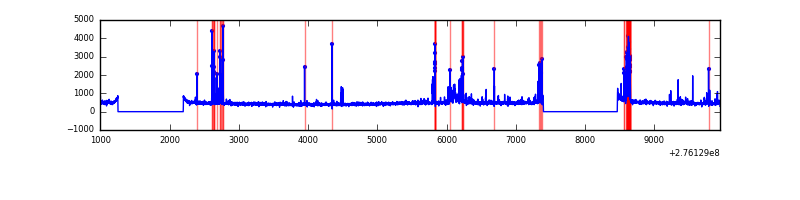 |
Top three noisy pixels from each quadrant. If the there are fewer than three noisy pixels in the level2.evt file, extra rows are filled as -1
| Pixel properties | Quadrant properties | ||||||
|---|---|---|---|---|---|---|---|
| Quadrant | DetID | PixID | Counts | Sigma | Mean | Median | Sigma |
| A | 15 | 174 | 478749 | 2788.6 | 847 | 829 | 171.4 |
| A | 13 | 248 | 12176 | 66.21 | 847 | 829 | 171.4 |
| A | 0 | 226 | 7375 | 38.2 | 847 | 829 | 171.4 |
| B | 0 | 189 | 87545 | 527.94 | 858 | 833 | 164.2 |
| B | 15 | 35 | 69133 | 415.84 | 858 | 833 | 164.2 |
| B | 4 | 216 | 51417 | 307.97 | 858 | 833 | 164.2 |
| C | 14 | 238 | 127358 | 659.62 | 822 | 829 | 191.8 |
| C | 3 | 233 | 39026 | 199.13 | 822 | 829 | 191.8 |
| C | 0 | 207 | 36785 | 187.44 | 822 | 829 | 191.8 |
| D | 10 | 70 | 235994 | 1167.33 | 824 | 800 | 201.5 |
| D | 1 | 52 | 134872 | 665.44 | 824 | 800 | 201.5 |
| D | 15 | 0 | 74029 | 363.46 | 824 | 800 | 201.5 |
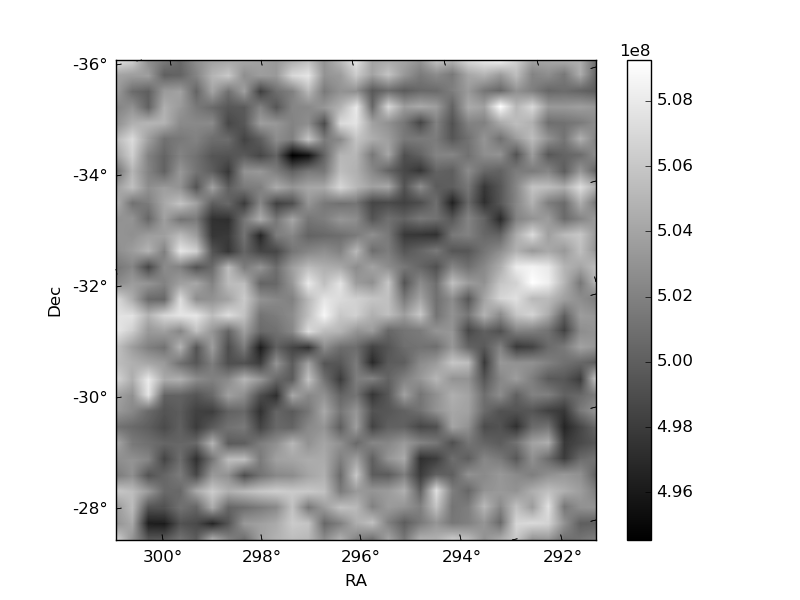
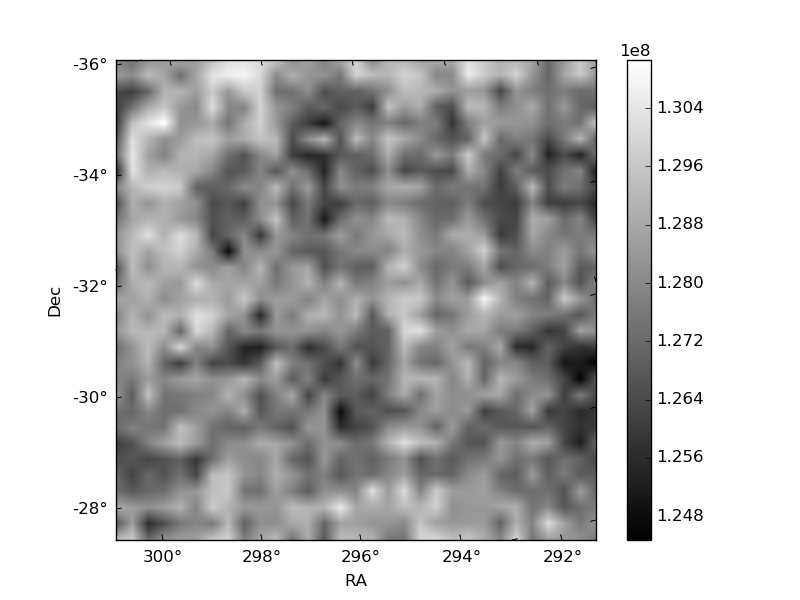
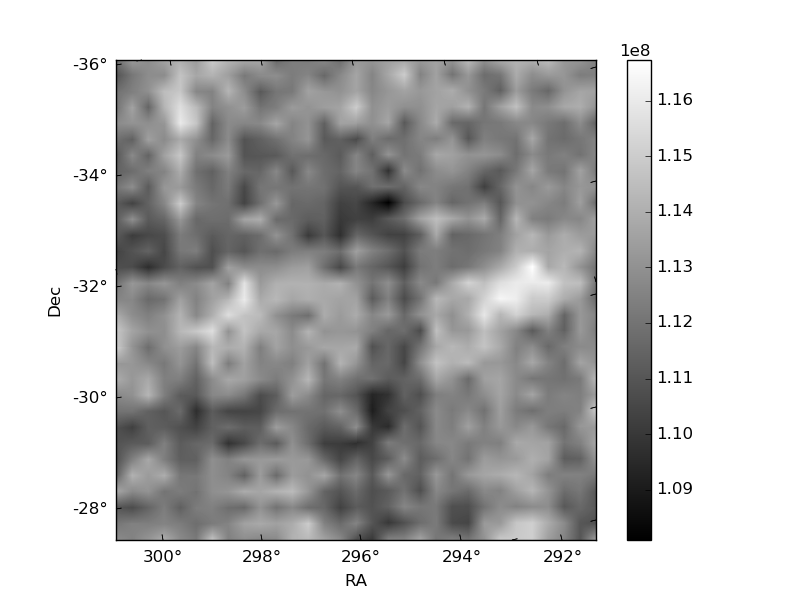
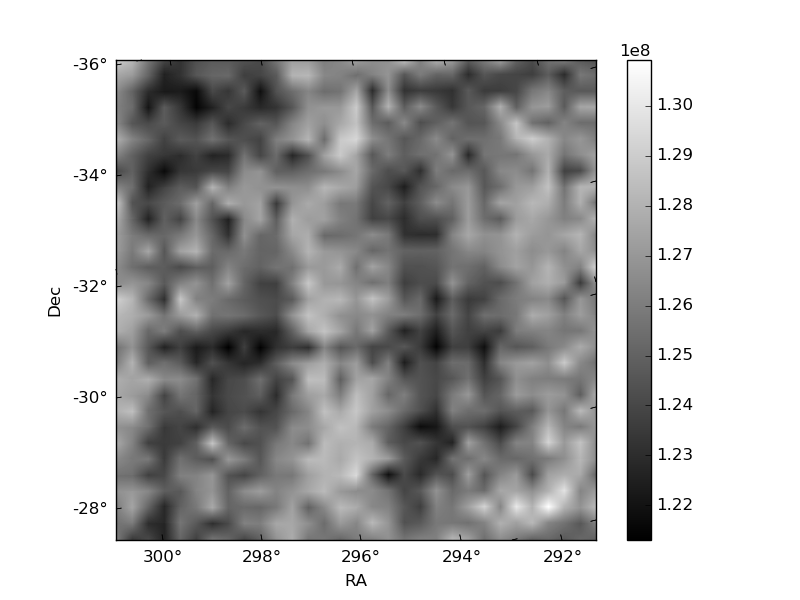
Histogram calculated using DETX and DETY for each event in the final _common_clean file
| Quadrant A | 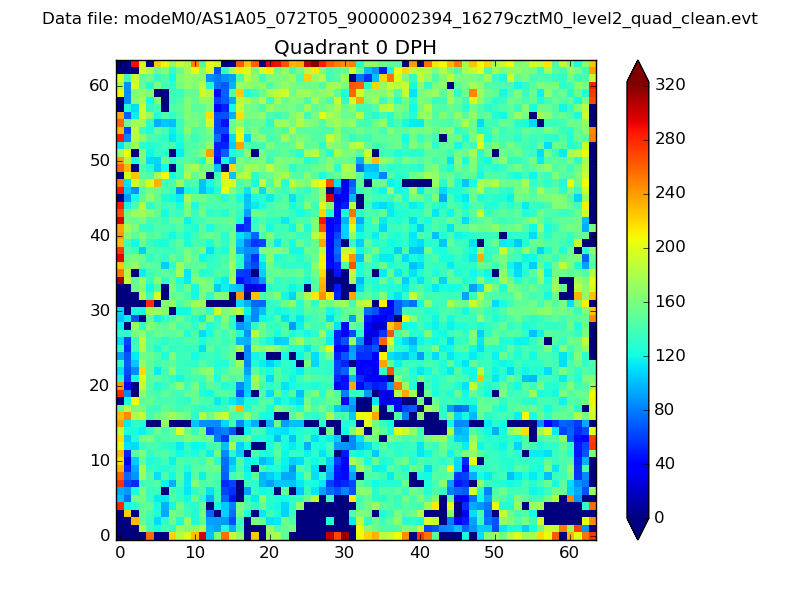 |
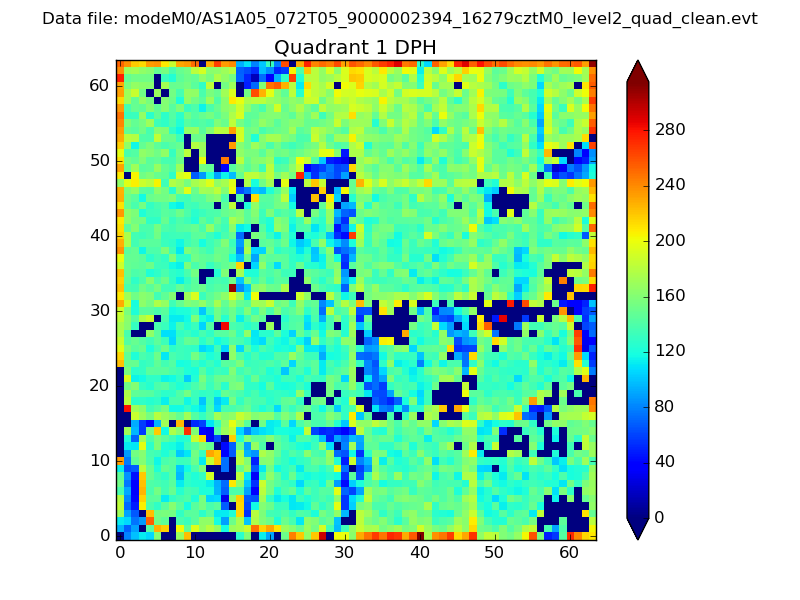 |
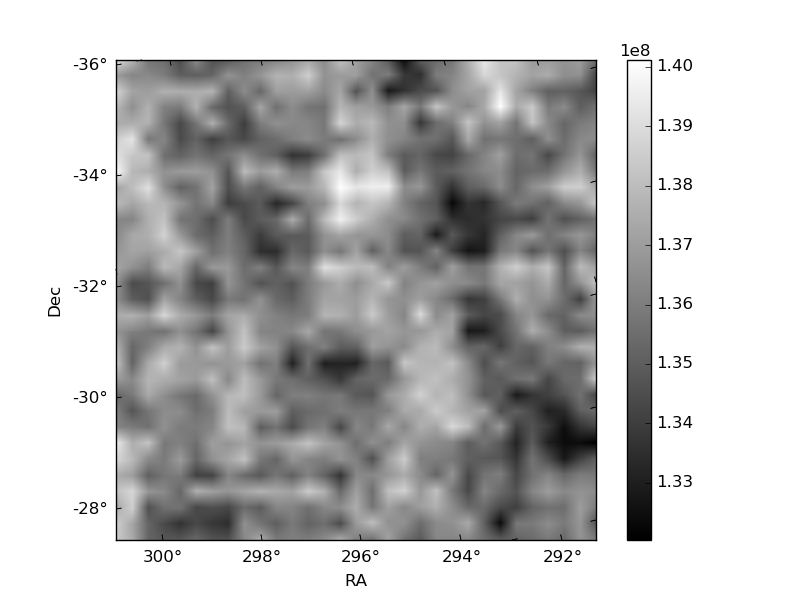
Quadrant B |
|---|---|---|---|
| Quadrant D | 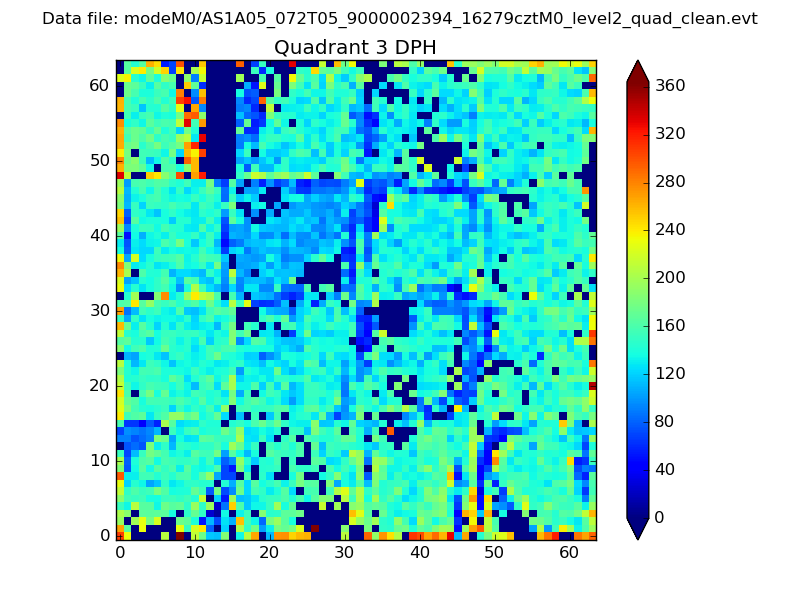 |
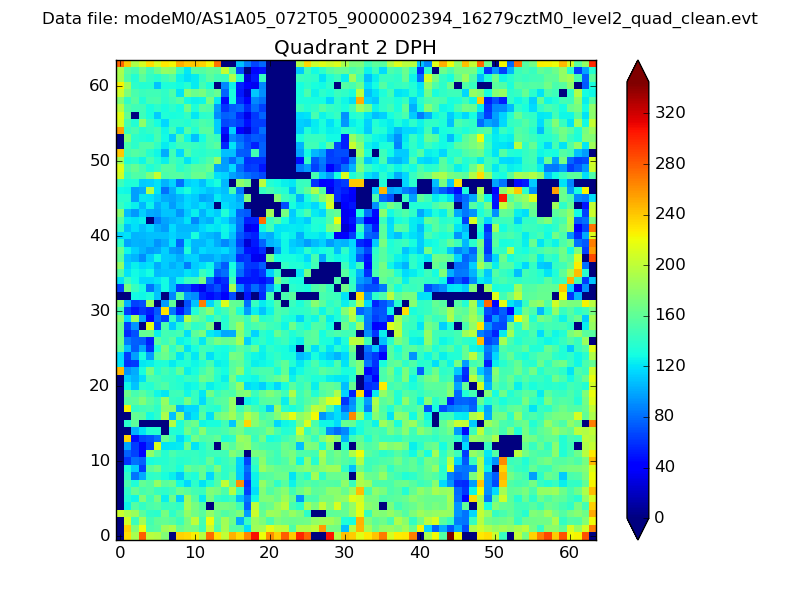 |
Quadrant C |
| Plot type | Count rate plots | Images |
|---|---|---|
| Comparison with Poisson distribution Blue bars denote a histogram of data divided into 1 sec bins. Red curve is a Poisson curve with rate = median count rate of data. |
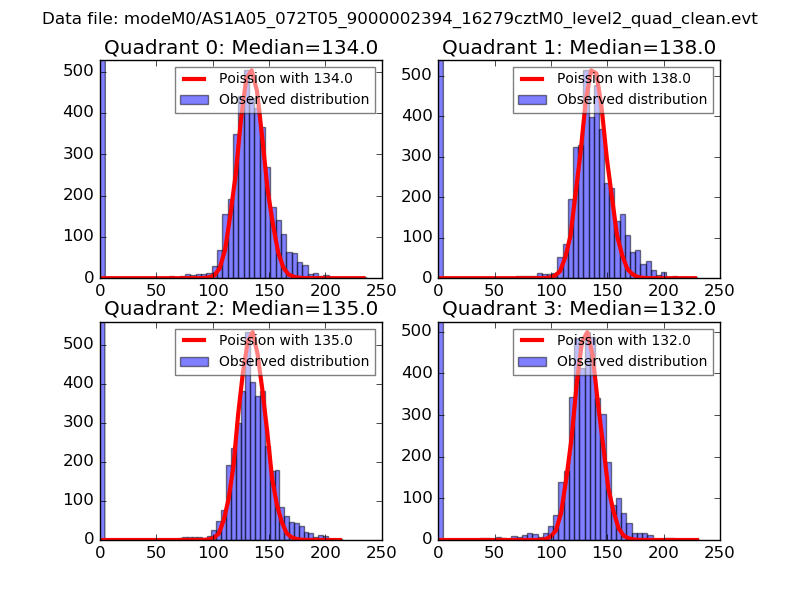 |
 |
| Quadrant-wise count rates Data is divided into 100 sec bins |
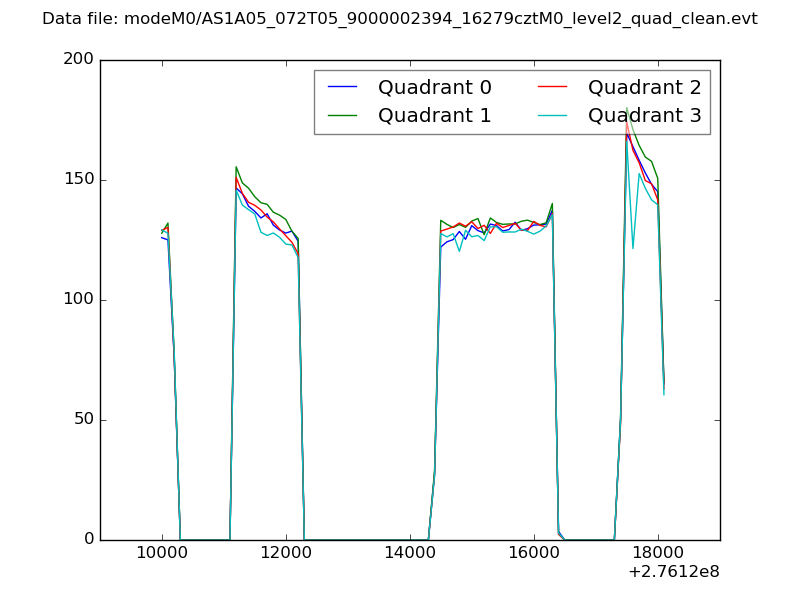 |
|
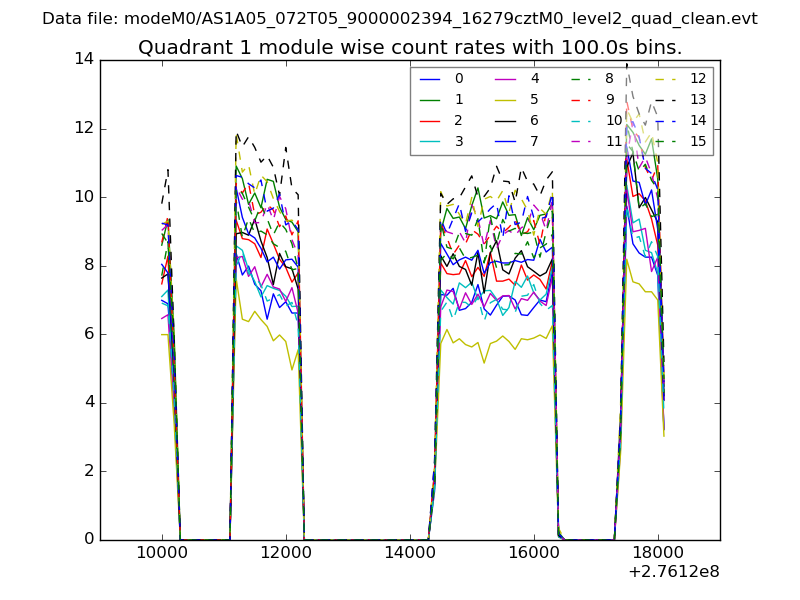
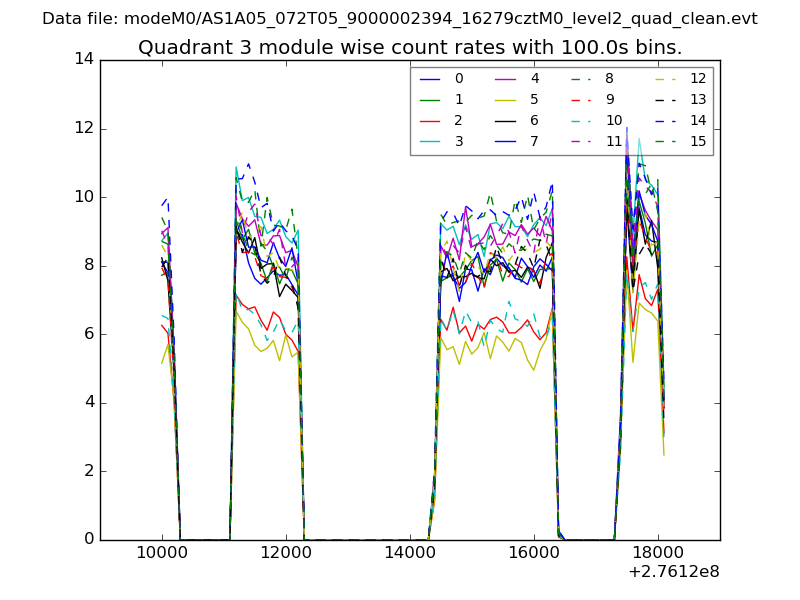
| Module-wise count rates for Quadrant A Data is divided into 100 sec bins |
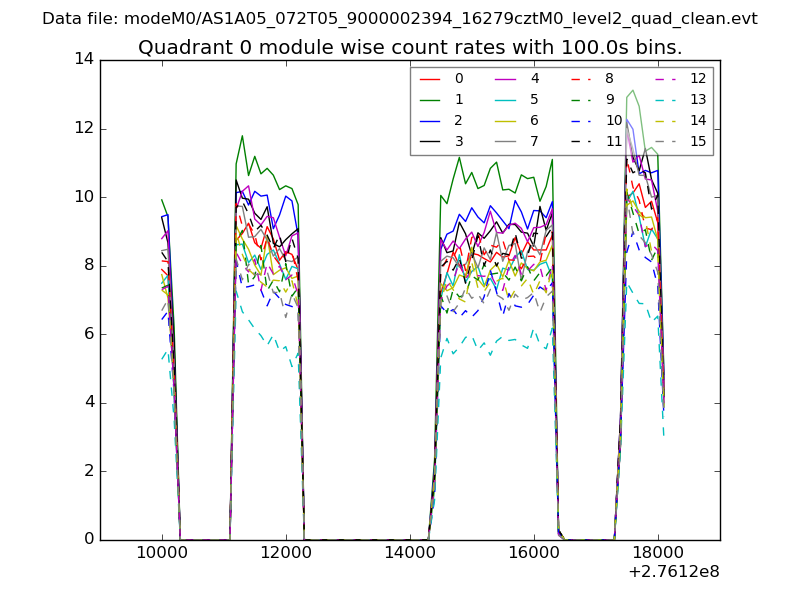 |
 |
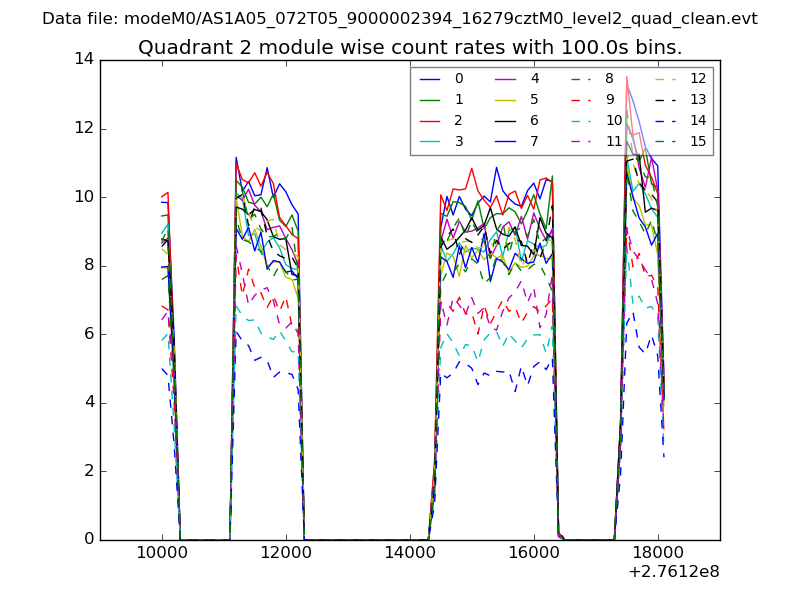
| Module-wise count rates for Quadrant B Data is divided into 100 sec bins |
 |
 |
| Module-wise count rates for Quadrant C Data is divided into 100 sec bins |
 |
 |
| Module-wise count rates for Quadrant D Data is divided into 100 sec bins |
 |
 |
| Parameter | Plot |
|---|---|
| CZT HV Monitor | 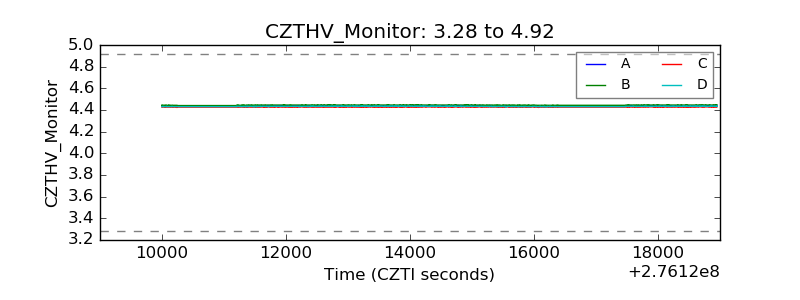 |
| D_VDD | 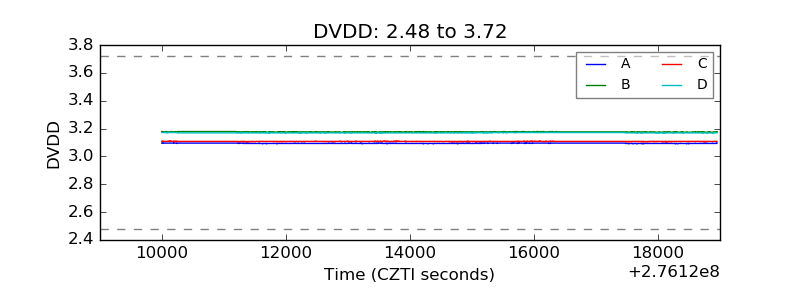 |
| Temperature 1 | 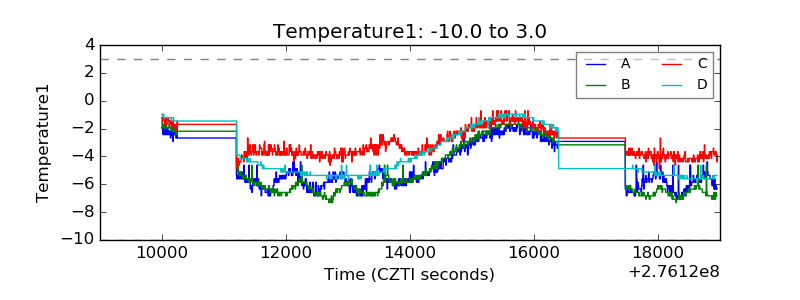 |
| Veto HV Monitor |  |
| Veto LLD | 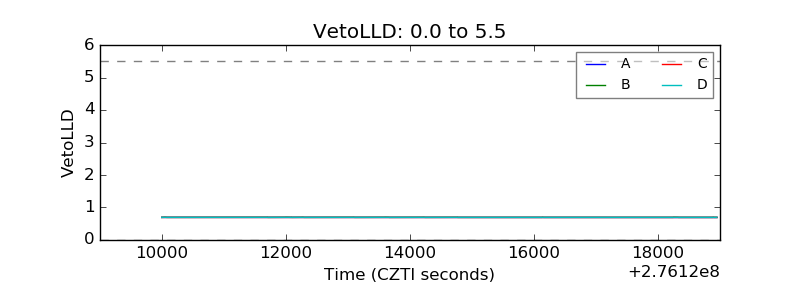 |
| Alpha Counter | 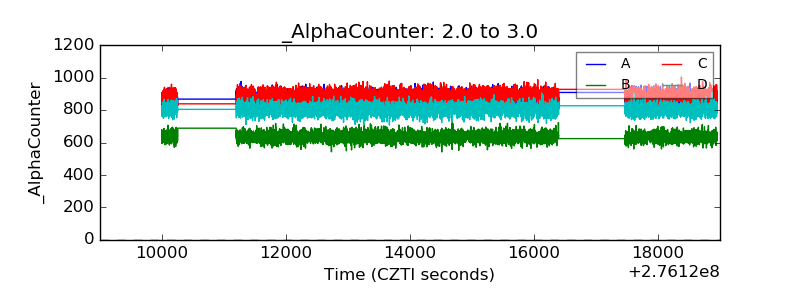 |
| _CPM_Rate | 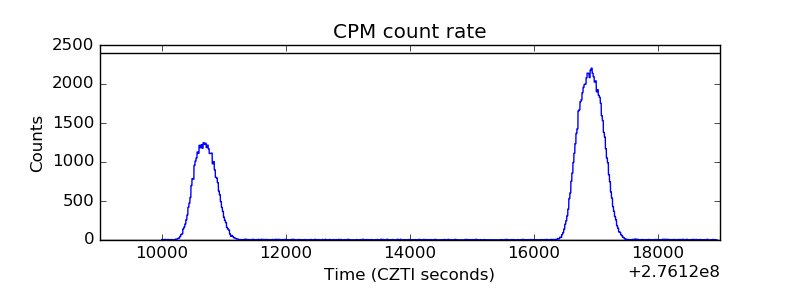 |
| CZT Counter | 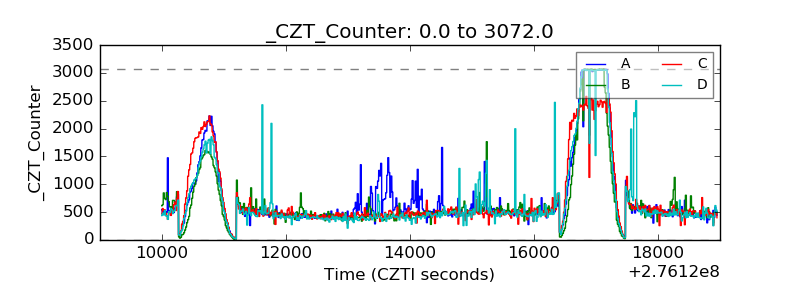 |
| +2.5 Volts monitor | 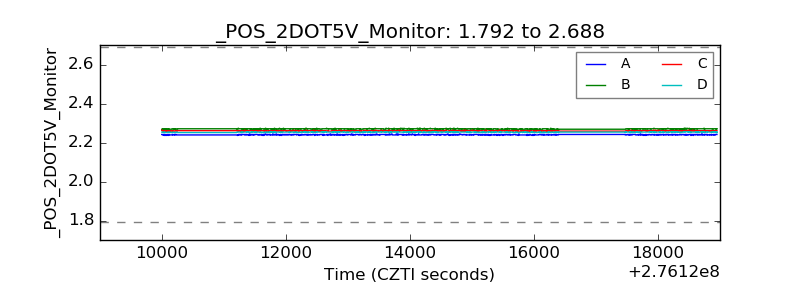 |
| +5 Volts monitor |  |
| _ROLL_ROT | 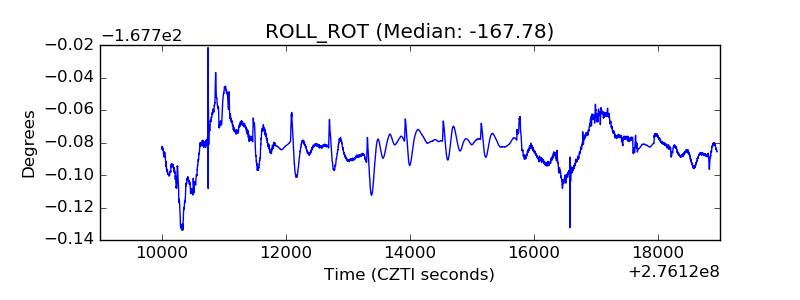 |
| _Roll_DEC | 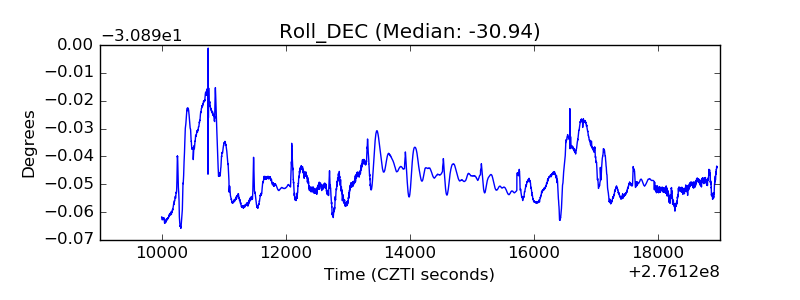 |
| _Roll_RA | 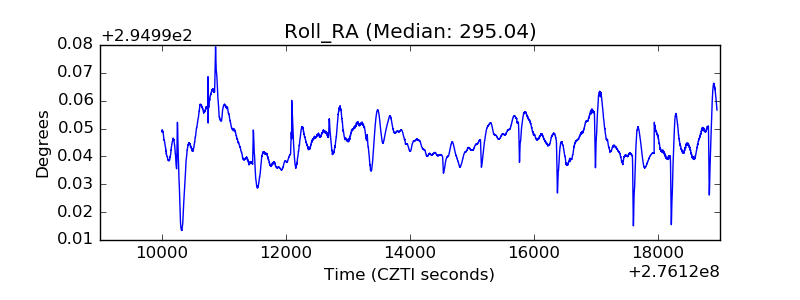 |
| Veto Counter | 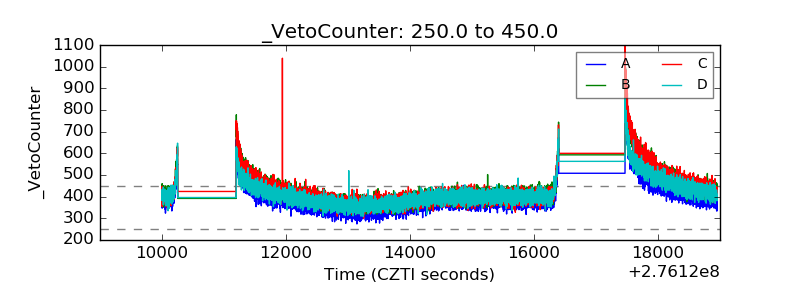 |