| Param | Original file | Final file |
|---|---|---|
| Filename | modeM0/AS1A05_072T05_9000002394_16282cztM0_level2.evt | modeM0/AS1A05_072T05_9000002394_16282cztM0_level2_quad_clean.evt |
| Size (bytes) | 452,802,240 | 59,777,280 |
| Size | 431.8 MB | 57.0 MB |
| Events in quadrant A | 3,443,916 | 342,991 |
| Events in quadrant B | 3,347,025 | 358,771 |
| Events in quadrant C | 3,230,492 | 352,969 |
| Events in quadrant D | 3,288,379 | 340,015 |
| Mode SS | |||
|---|---|---|---|
| Quadrant | BADHDUFLAG | Total packets | Discarded packets |
| A | 0 | 122 | 0 |
| B | 0 | 122 | 0 |
| C | 0 | 122 | 0 |
| D | 0 | 122 | 0 |
| Mode M9 | |||
|---|---|---|---|
| Quadrant | BADHDUFLAG | Total packets | Discarded packets |
| A | 0 | 12 | 0 |
| B | 0 | 12 | 0 |
| C | 0 | 12 | 0 |
| D | 0 | 12 | 0 |
| Mode M0 | |||
|---|---|---|---|
| Quadrant | BADHDUFLAG | Total packets | Discarded packets |
| A | 0 | 13804 | 2 |
| B | 0 | 13501 | 1 |
| C | 0 | 13083 | 1 |
| D | 0 | 13392 | 1 |
| Quadrant | Total seconds | Saturated seconds | Saturation percentage |
|---|---|---|---|
| A | 5935 | 142 | 2.392586% |
| B | 5935 | 76 | 1.280539% |
| C | 5935 | 89 | 1.499579% |
| D | 5935 | 117 | 1.971356% |
Noise dominated data is calculated using 1-second bins in cleaned event files. If a bin has >2000 counts, and if more than 50% of those come from <1% of pixels, then it is considered to be noise-dominated and hence unusable.
| Quadrant | # 1 sec bins | Bins with >0 counts | Bins with >2000 counts | High rate bins dominated by noise | Noise dominated (total time) | Noise dominated (detector-on time) | Marked lightcurve |
|---|---|---|---|---|---|---|---|
| A | 7221 | 5937 | 54 | 54 | 0.75% | 0.91% | 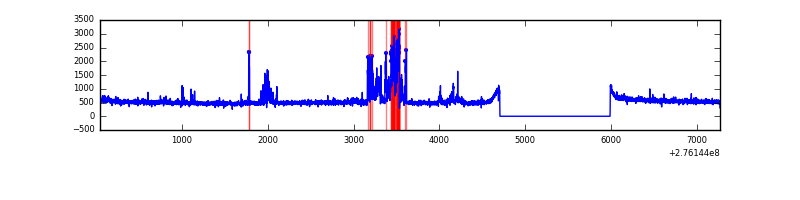 |
| B | 7221 | 5937 | 0 | 0 | 0.00% | 0.00% | 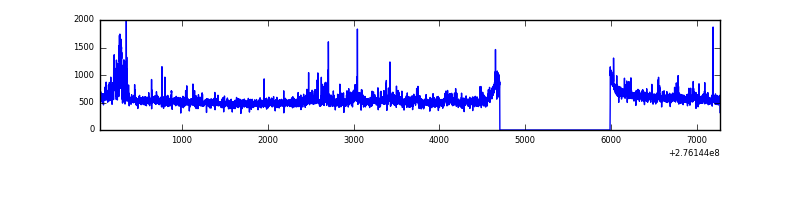 |
| C | 7221 | 5937 | 0 | 0 | 0.00% | 0.00% | 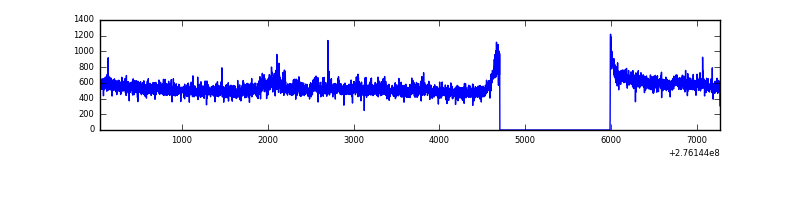 |
| D | 7221 | 5937 | 57 | 57 | 0.79% | 0.96% | 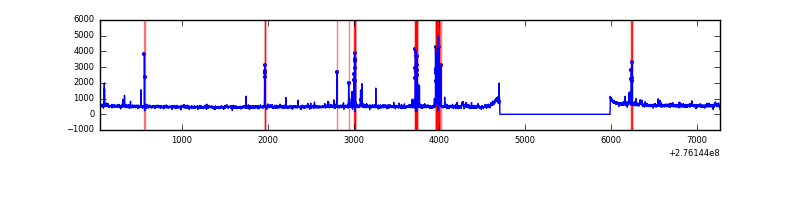 |
Top three noisy pixels from each quadrant. If the there are fewer than three noisy pixels in the level2.evt file, extra rows are filled as -1
| Pixel properties | Quadrant properties | ||||||
|---|---|---|---|---|---|---|---|
| Quadrant | DetID | PixID | Counts | Sigma | Mean | Median | Sigma |
| A | 15 | 174 | 357078 | 2290.72 | 787 | 773 | 155.5 |
| A | 9 | 143 | 63532 | 403.48 | 787 | 773 | 155.5 |
| A | 0 | 226 | 6949 | 39.71 | 787 | 773 | 155.5 |
| B | 15 | 35 | 106330 | 715.0 | 797 | 779 | 147.6 |
| B | 0 | 189 | 51833 | 345.84 | 797 | 779 | 147.6 |
| B | 0 | 198 | 46012 | 306.41 | 797 | 779 | 147.6 |
| C | 14 | 238 | 121839 | 690.79 | 767 | 774 | 175.3 |
| C | 3 | 233 | 107819 | 610.79 | 767 | 774 | 175.3 |
| C | 0 | 207 | 7861 | 40.44 | 767 | 774 | 175.3 |
| D | 1 | 52 | 268286 | 1445.14 | 771 | 751 | 185.1 |
| D | 10 | 70 | 72915 | 389.81 | 771 | 751 | 185.1 |
| D | 13 | 104 | 27808 | 146.15 | 771 | 751 | 185.1 |
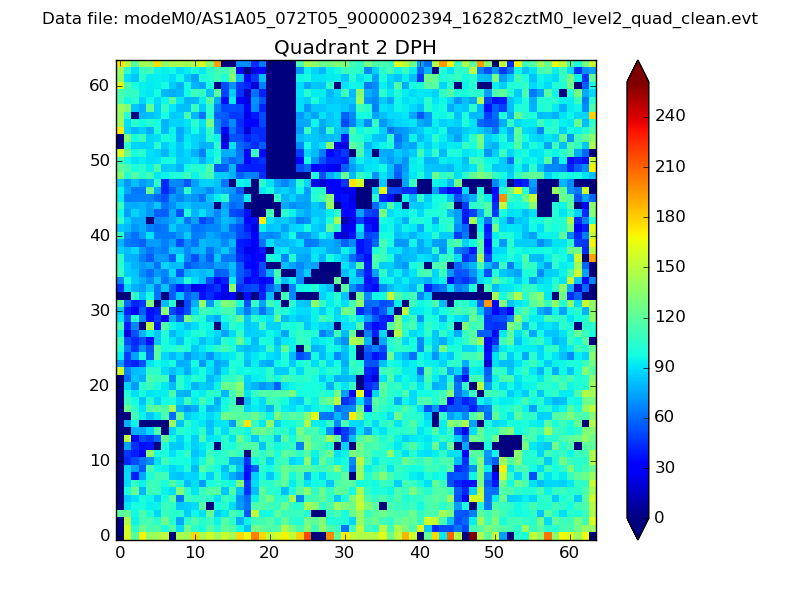
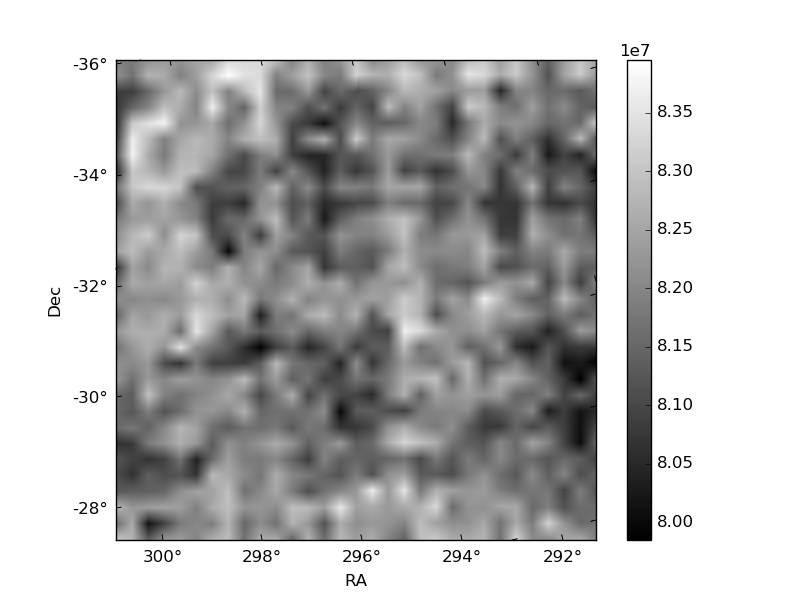
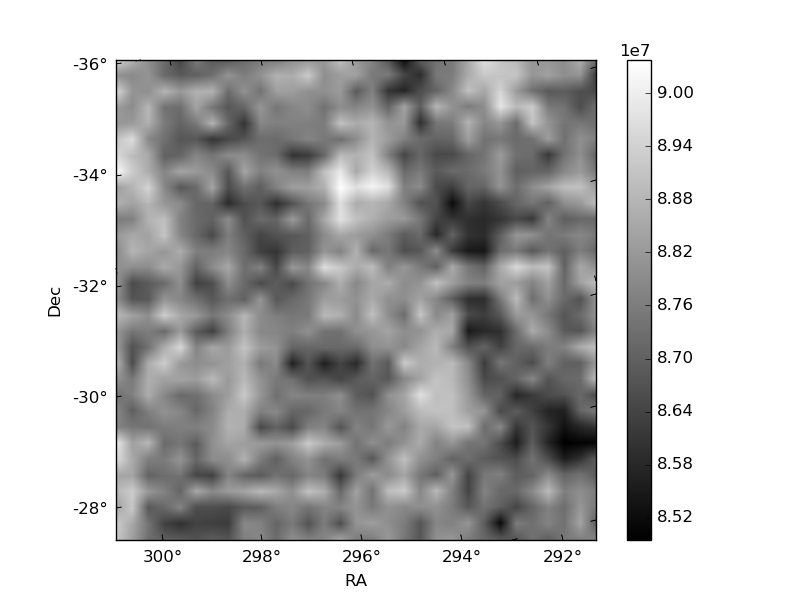
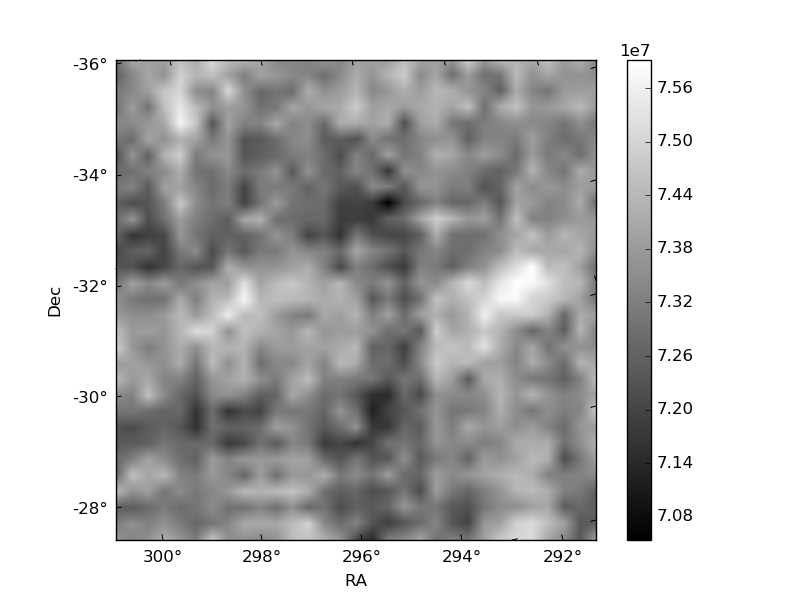
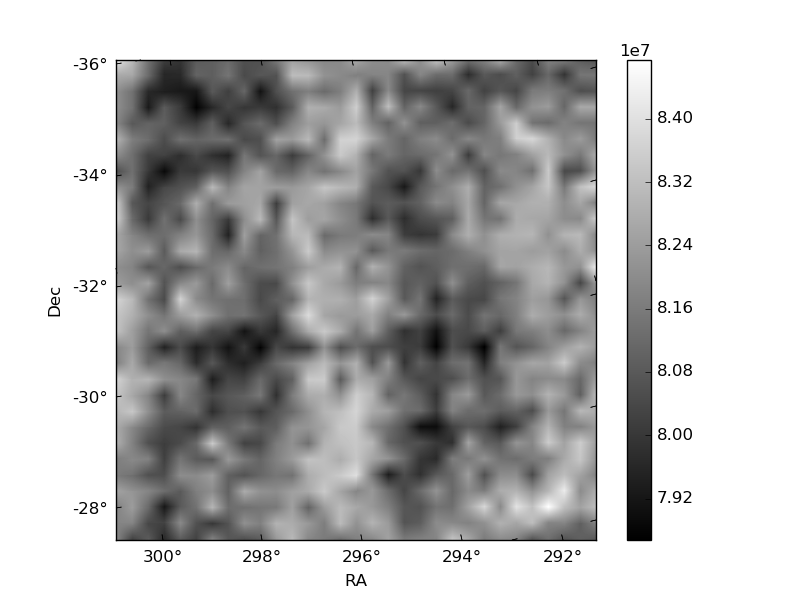
Histogram calculated using DETX and DETY for each event in the final _common_clean file
| Quadrant A | 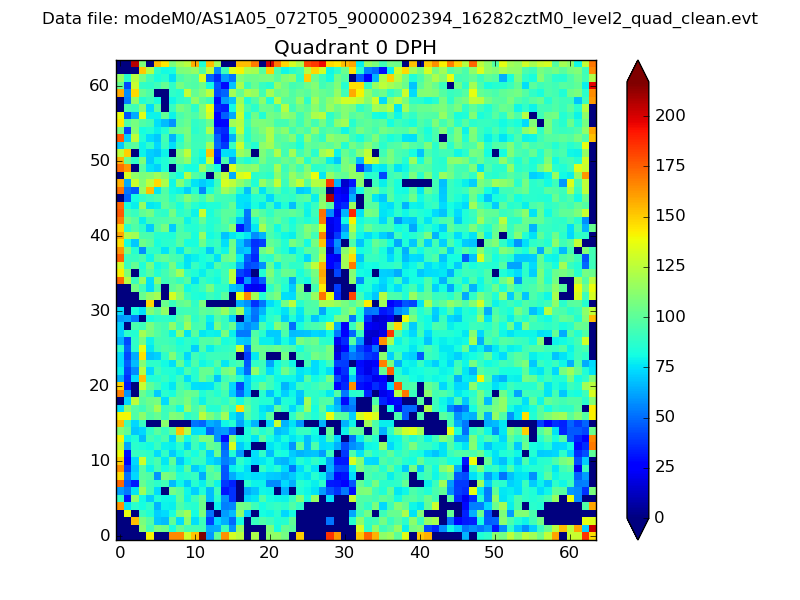 |
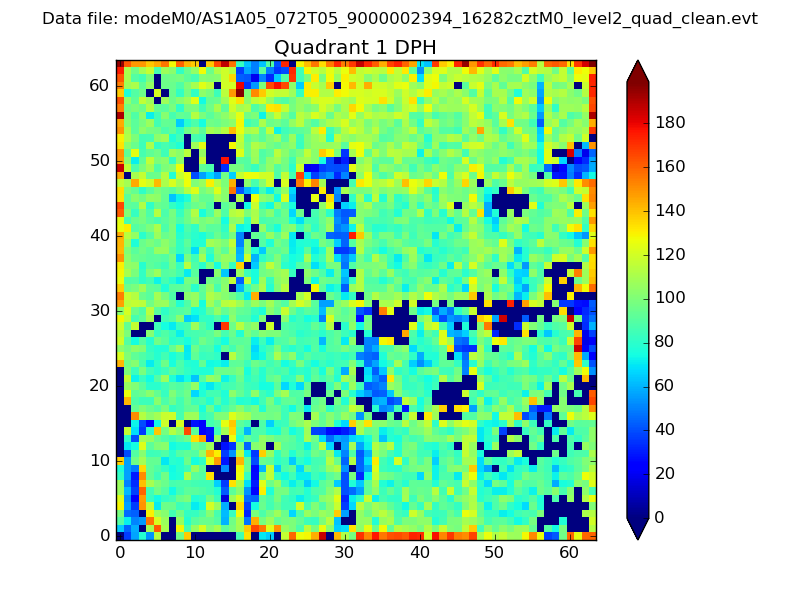 |
Quadrant B |
|---|---|---|---|
| Quadrant D | 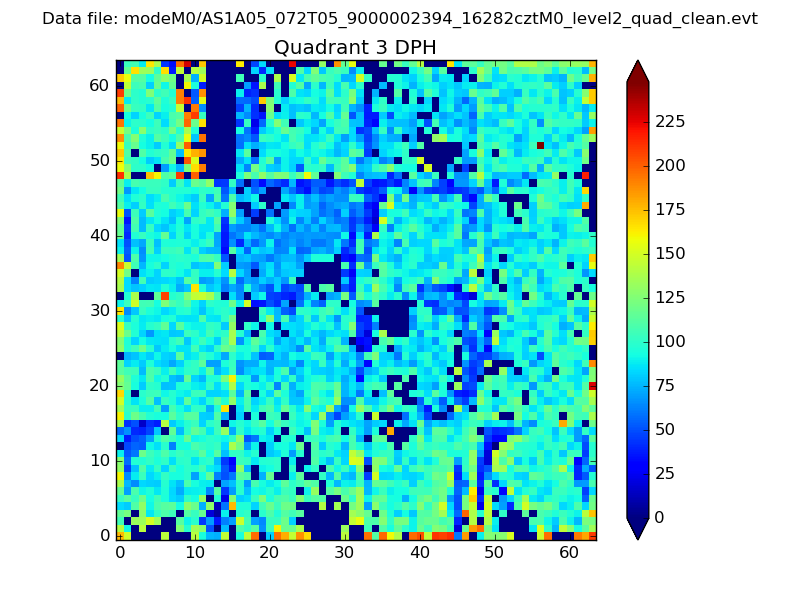 |
 |
Quadrant C |
| Plot type | Count rate plots | Images |
|---|---|---|
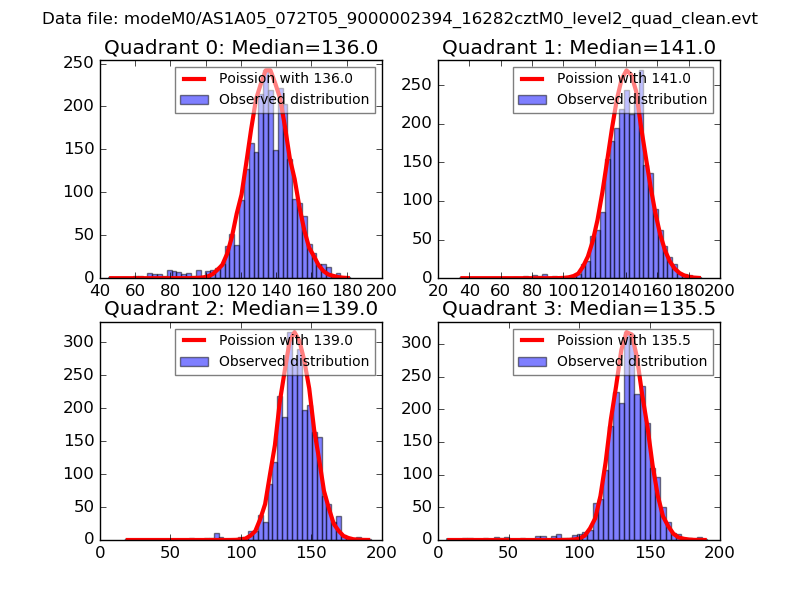
| Comparison with Poisson distribution Blue bars denote a histogram of data divided into 1 sec bins. Red curve is a Poisson curve with rate = median count rate of data. |
 |
 |
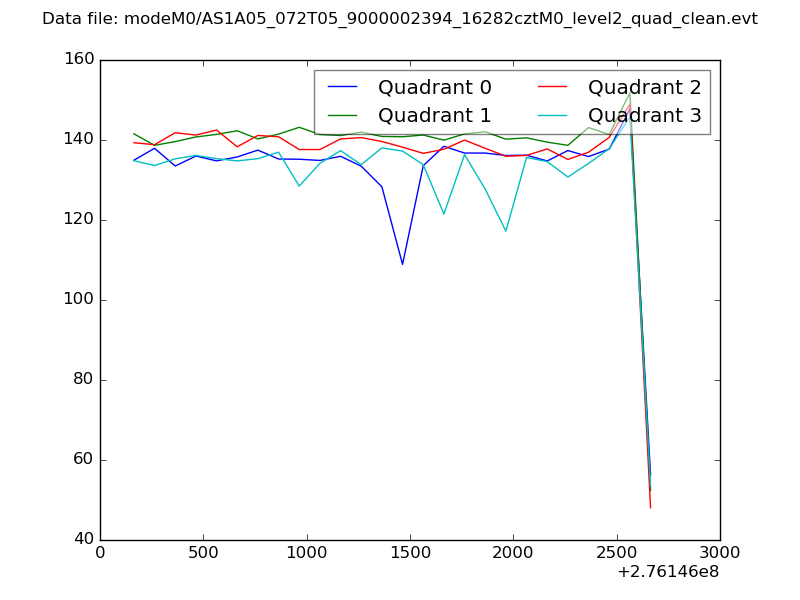
| Quadrant-wise count rates Data is divided into 100 sec bins |
 |
|
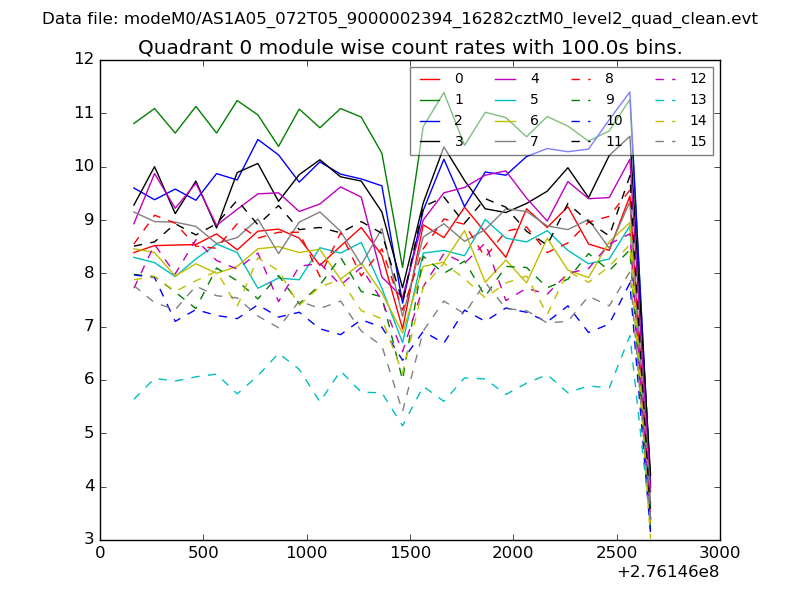
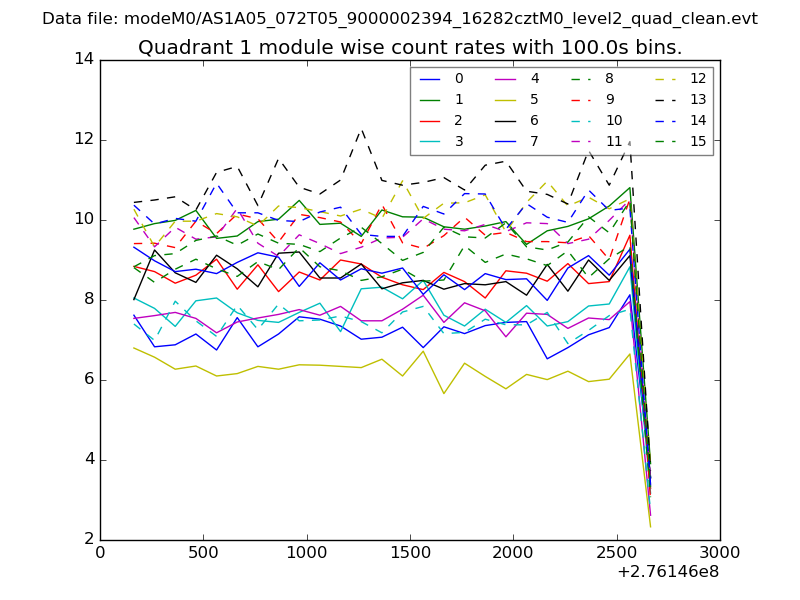
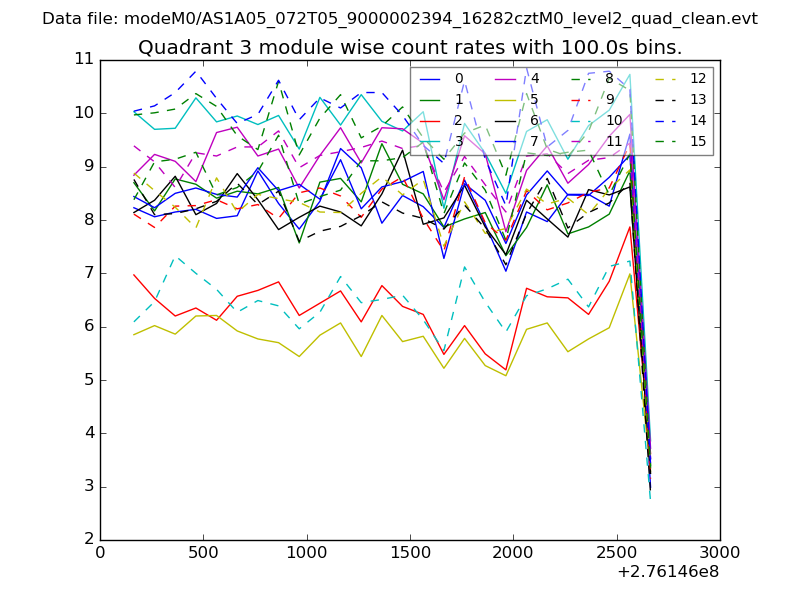
| Module-wise count rates for Quadrant A Data is divided into 100 sec bins |
 |
 |
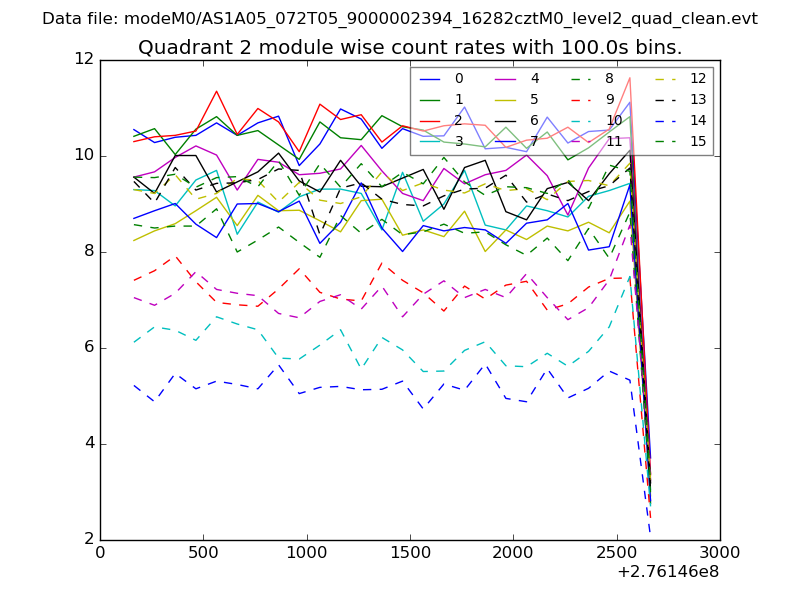
| Module-wise count rates for Quadrant B Data is divided into 100 sec bins |
 |
 |
| Module-wise count rates for Quadrant C Data is divided into 100 sec bins |
 |
 |
| Module-wise count rates for Quadrant D Data is divided into 100 sec bins |
 |
 |
| Parameter | Plot |
|---|---|
| CZT HV Monitor | 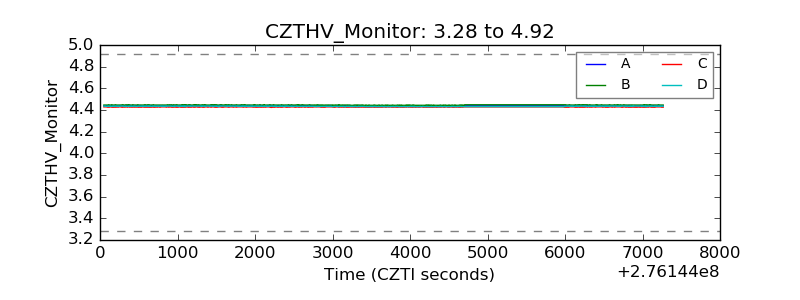 |
| D_VDD | 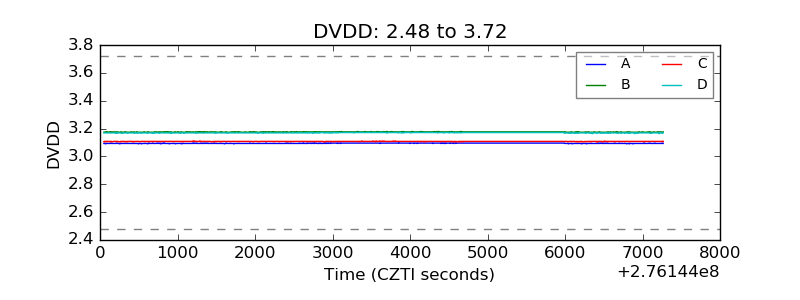 |
| Temperature 1 | 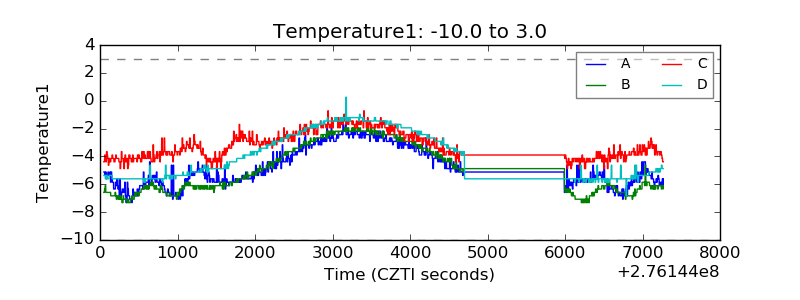 |
| Veto HV Monitor | 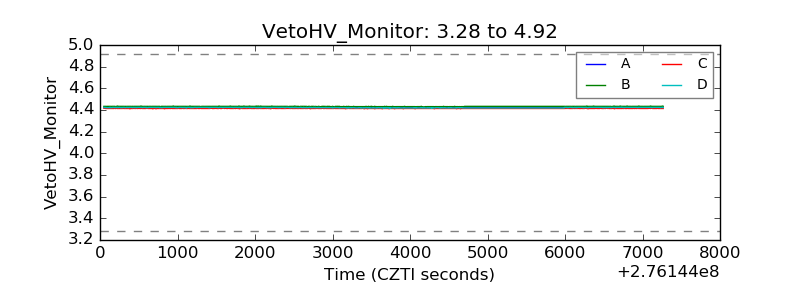 |
| Veto LLD | 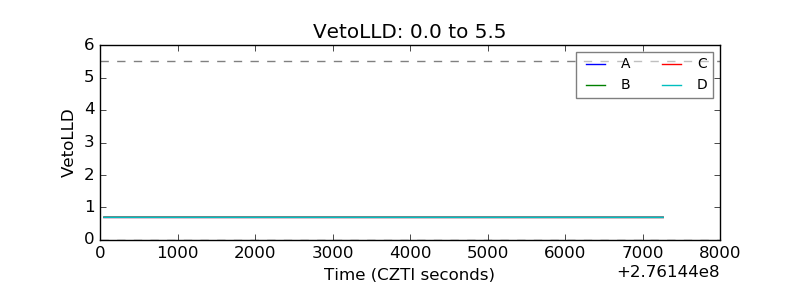 |
| Alpha Counter |  |
| _CPM_Rate | 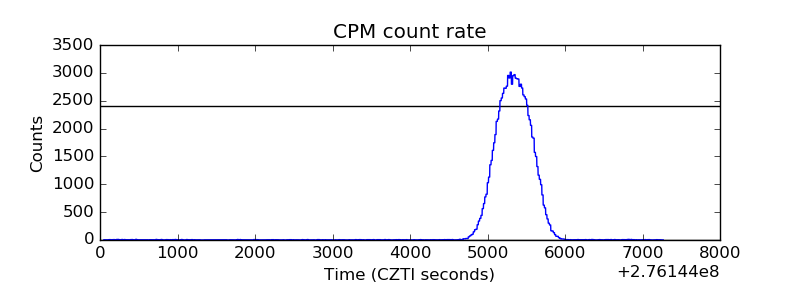 |
| CZT Counter | 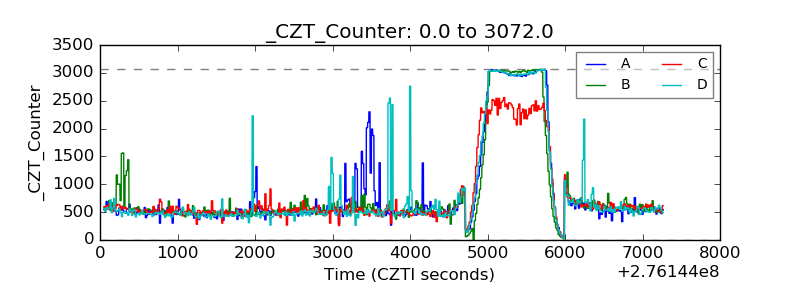 |
| +2.5 Volts monitor |  |
| +5 Volts monitor |  |
| _ROLL_ROT | 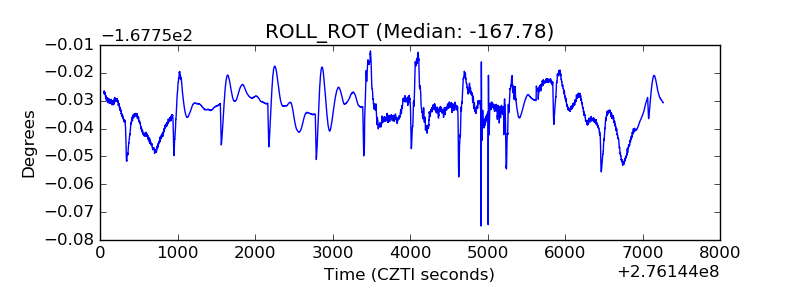 |
| _Roll_DEC | 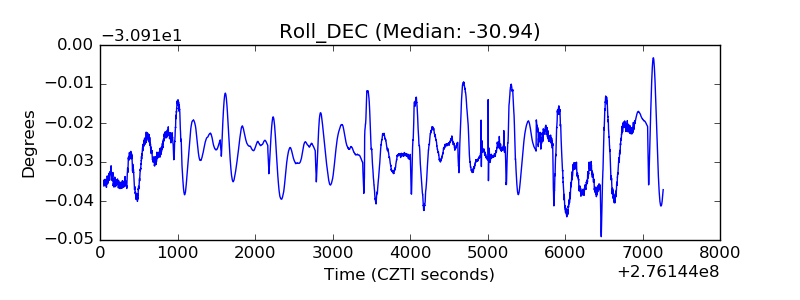 |
| _Roll_RA | 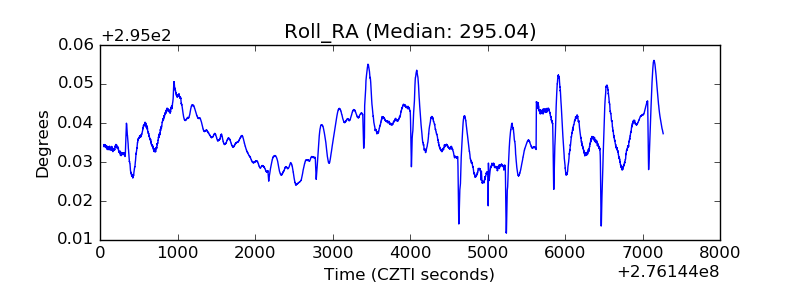 |
| Veto Counter | 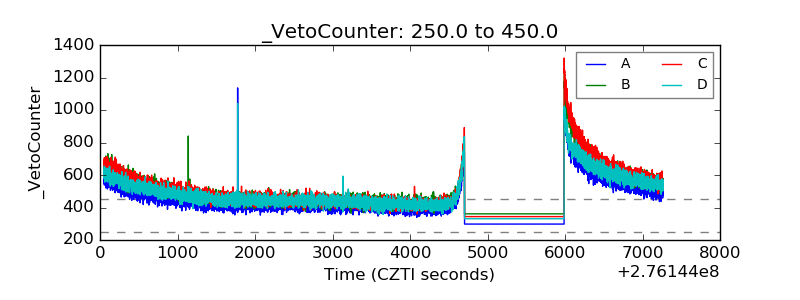 |