| Param | Original file | Final file |
|---|---|---|
| Filename | modeM0/AS1A05_072T05_9000002394_16283cztM0_level2.evt | modeM0/AS1A05_072T05_9000002394_16283cztM0_level2_quad_clean.evt |
| Size (bytes) | 481,334,400 | 68,353,920 |
| Size | 459.0 MB | 65.2 MB |
| Events in quadrant A | 3,486,151 | 406,050 |
| Events in quadrant B | 3,670,848 | 418,003 |
| Events in quadrant C | 3,454,423 | 414,362 |
| Events in quadrant D | 3,549,214 | 402,356 |
| Mode SS | |||
|---|---|---|---|
| Quadrant | BADHDUFLAG | Total packets | Discarded packets |
| A | 0 | 126 | 0 |
| B | 0 | 126 | 0 |
| C | 0 | 126 | 0 |
| D | 0 | 126 | 0 |
| Mode M9 | |||
|---|---|---|---|
| Quadrant | BADHDUFLAG | Total packets | Discarded packets |
| A | 0 | 14 | 0 |
| B | 0 | 14 | 0 |
| C | 0 | 14 | 0 |
| D | 0 | 15 | 0 |
| Mode M0 | |||
|---|---|---|---|
| Quadrant | BADHDUFLAG | Total packets | Discarded packets |
| A | 0 | 13967 | 3 |
| B | 0 | 14802 | 2 |
| C | 0 | 13958 | 2 |
| D | 0 | 14237 | 2 |
| Quadrant | Total seconds | Saturated seconds | Saturation percentage |
|---|---|---|---|
| A | 6139 | 88 | 1.433458% |
| B | 6139 | 86 | 1.400880% |
| C | 6139 | 103 | 1.677798% |
| D | 6139 | 85 | 1.384590% |
Noise dominated data is calculated using 1-second bins in cleaned event files. If a bin has >2000 counts, and if more than 50% of those come from <1% of pixels, then it is considered to be noise-dominated and hence unusable.
| Quadrant | # 1 sec bins | Bins with >0 counts | Bins with >2000 counts | High rate bins dominated by noise | Noise dominated (total time) | Noise dominated (detector-on time) | Marked lightcurve |
|---|---|---|---|---|---|---|---|
| A | 7505 | 6141 | 33 | 33 | 0.44% | 0.54% | 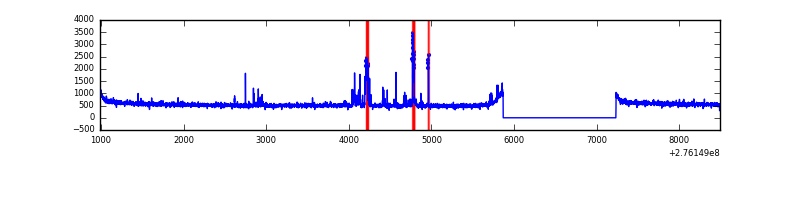 |
| B | 7505 | 6141 | 5 | 5 | 0.07% | 0.08% | 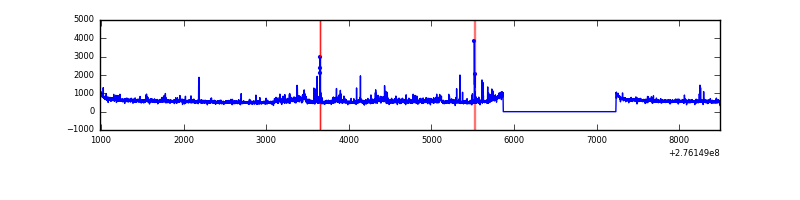 |
| C | 7505 | 6141 | 0 | 0 | 0.00% | 0.00% | 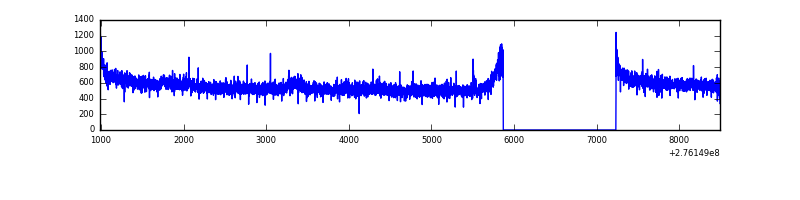 |
| D | 7505 | 6141 | 33 | 33 | 0.44% | 0.54% | 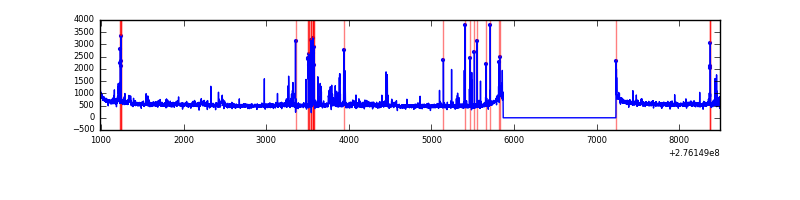 |
Top three noisy pixels from each quadrant. If the there are fewer than three noisy pixels in the level2.evt file, extra rows are filled as -1
| Pixel properties | Quadrant properties | ||||||
|---|---|---|---|---|---|---|---|
| Quadrant | DetID | PixID | Counts | Sigma | Mean | Median | Sigma |
| A | 15 | 174 | 119369 | 706.7 | 852 | 840 | 167.7 |
| A | 9 | 143 | 90922 | 537.09 | 852 | 840 | 167.7 |
| A | 0 | 226 | 7396 | 39.09 | 852 | 840 | 167.7 |
| B | 0 | 189 | 195039 | 1213.89 | 859 | 841 | 160.0 |
| B | 0 | 198 | 45661 | 280.16 | 859 | 841 | 160.0 |
| B | 15 | 35 | 38244 | 233.8 | 859 | 841 | 160.0 |
| C | 14 | 238 | 131351 | 689.5 | 831 | 840 | 189.3 |
| C | 3 | 233 | 73710 | 384.98 | 831 | 840 | 189.3 |
| C | 0 | 207 | 8974 | 42.97 | 831 | 840 | 189.3 |
| D | 1 | 52 | 235705 | 1154.43 | 840 | 819 | 203.5 |
| D | 10 | 70 | 105344 | 513.72 | 840 | 819 | 203.5 |
| D | 13 | 104 | 28938 | 138.2 | 840 | 819 | 203.5 |
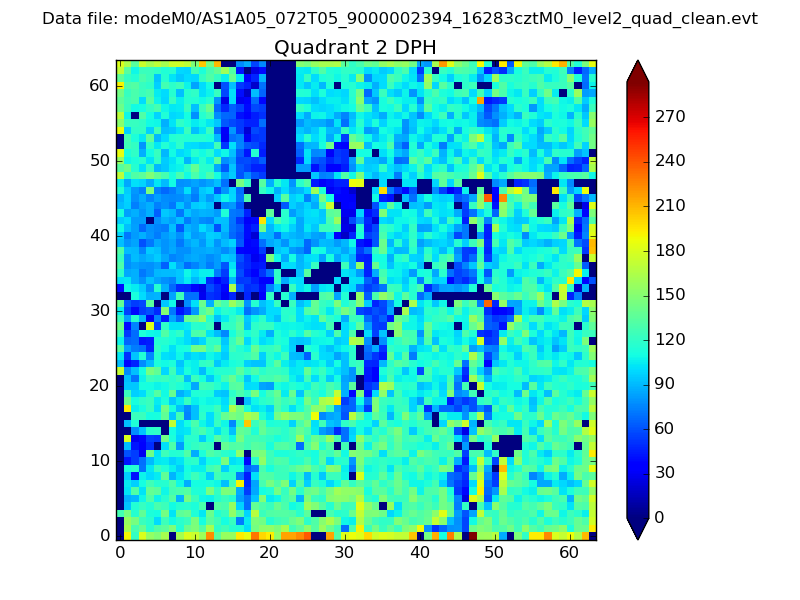
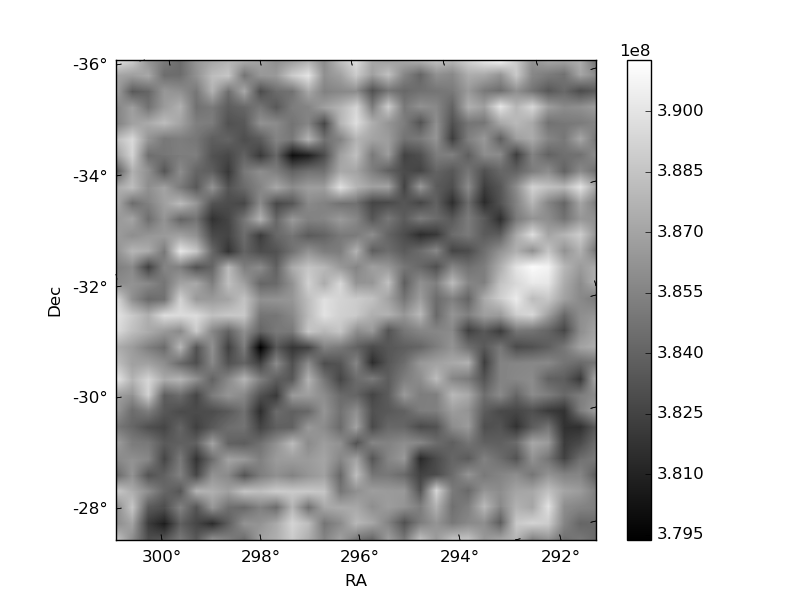
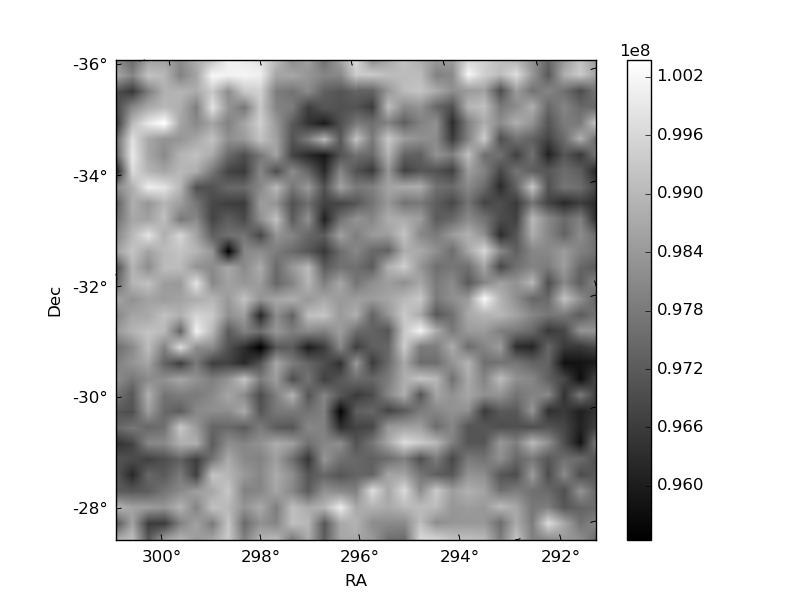
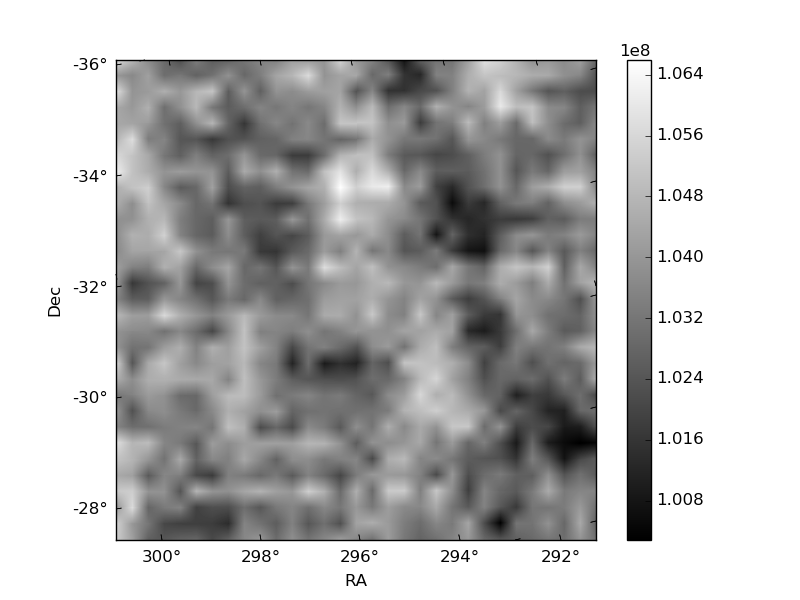
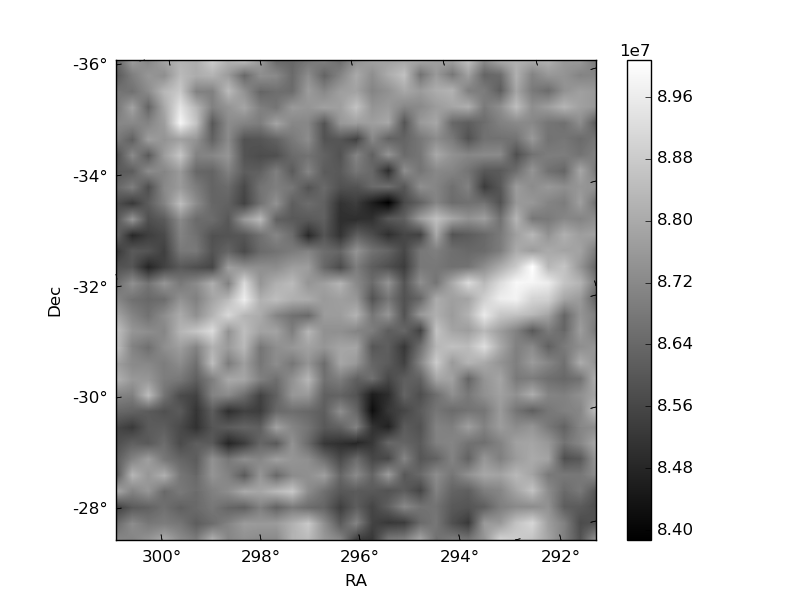
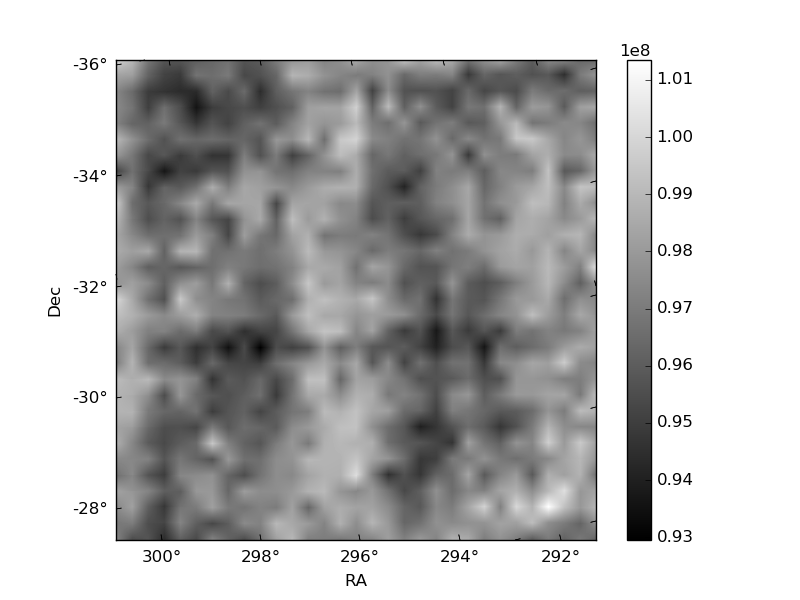
Histogram calculated using DETX and DETY for each event in the final _common_clean file
| Quadrant A | 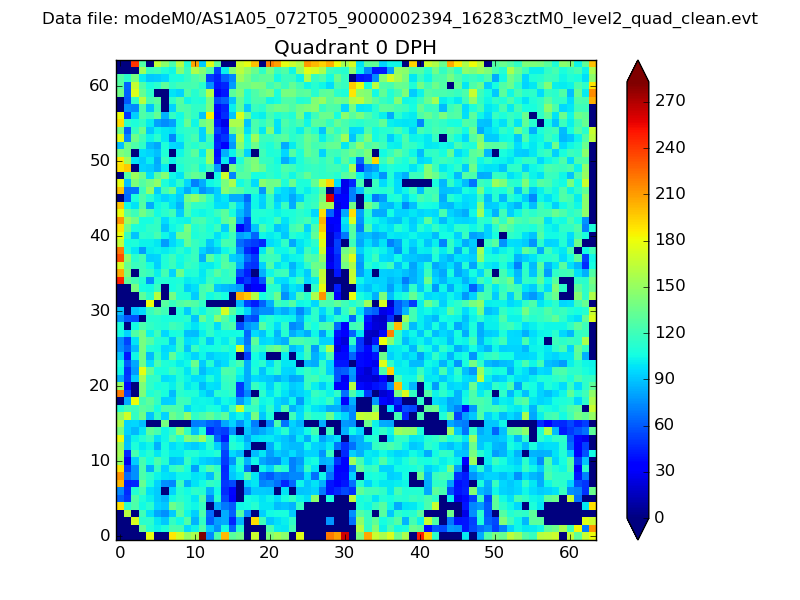 |
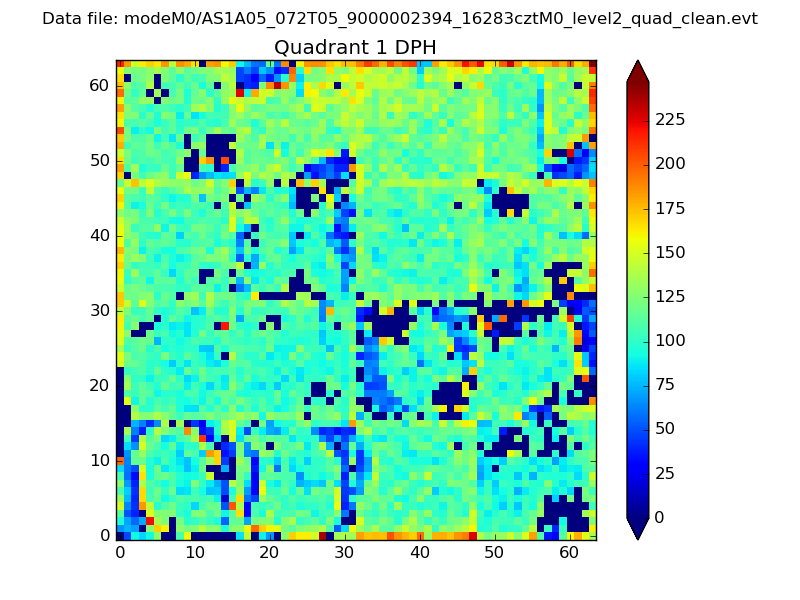 |
Quadrant B |
|---|---|---|---|
| Quadrant D | 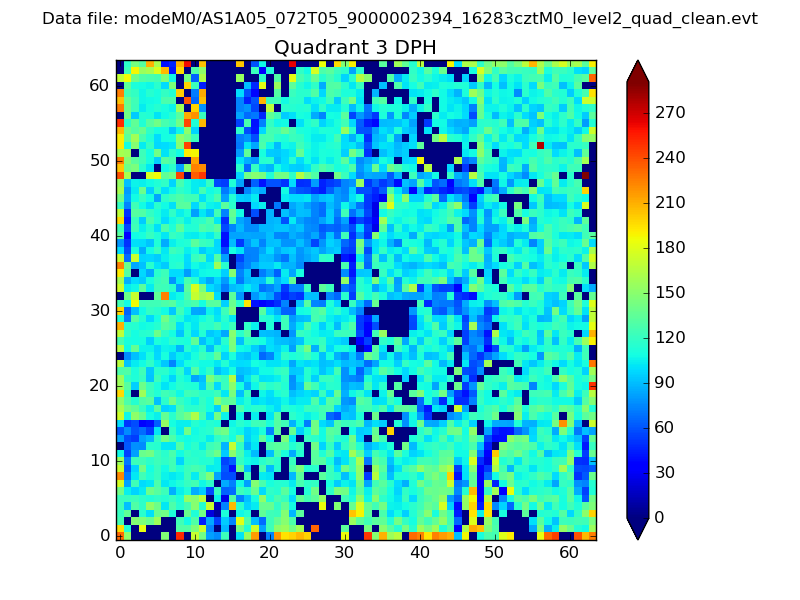 |
 |
Quadrant C |
| Plot type | Count rate plots | Images |
|---|---|---|
| Comparison with Poisson distribution Blue bars denote a histogram of data divided into 1 sec bins. Red curve is a Poisson curve with rate = median count rate of data. |
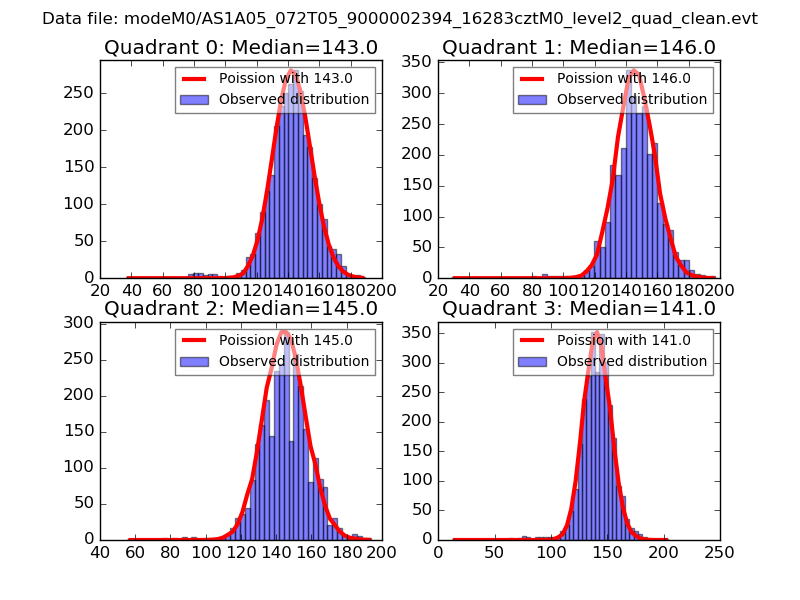 |
 |
| Quadrant-wise count rates Data is divided into 100 sec bins |
 |
|
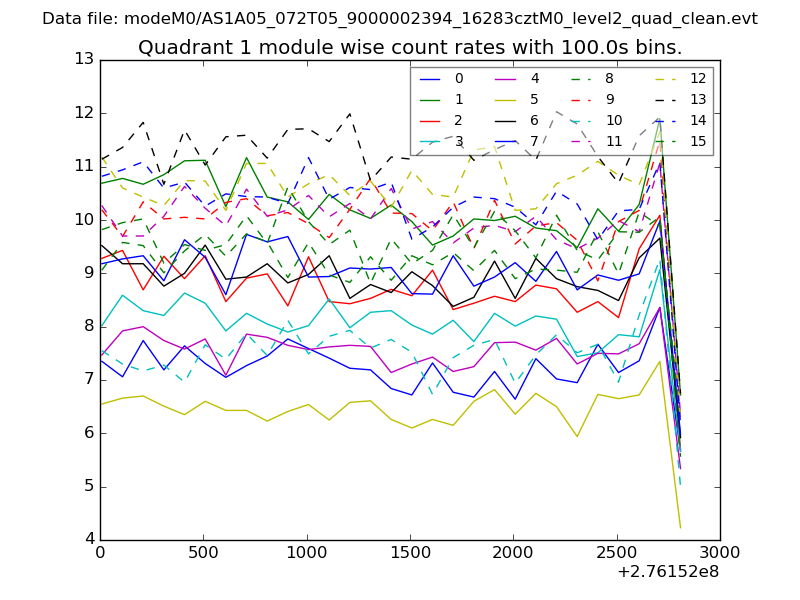
| Module-wise count rates for Quadrant A Data is divided into 100 sec bins |
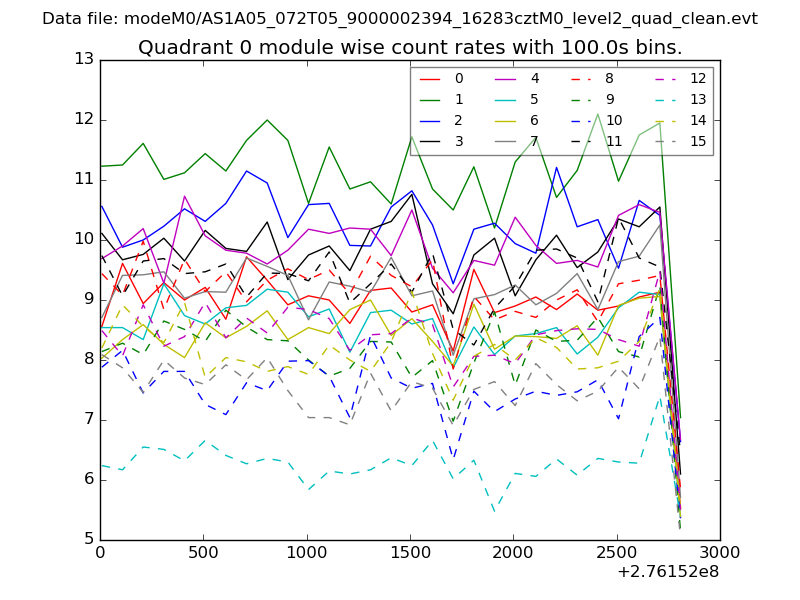 |
 |
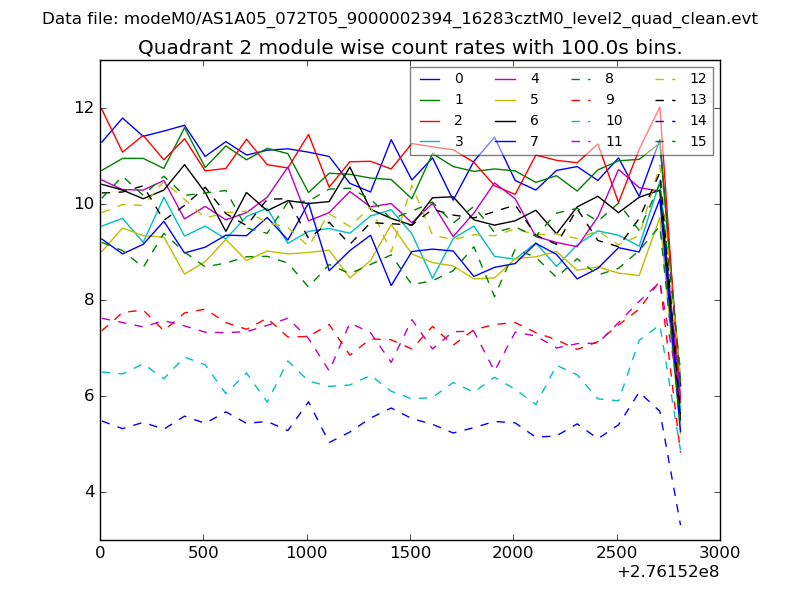
| Module-wise count rates for Quadrant B Data is divided into 100 sec bins |
 |
 |
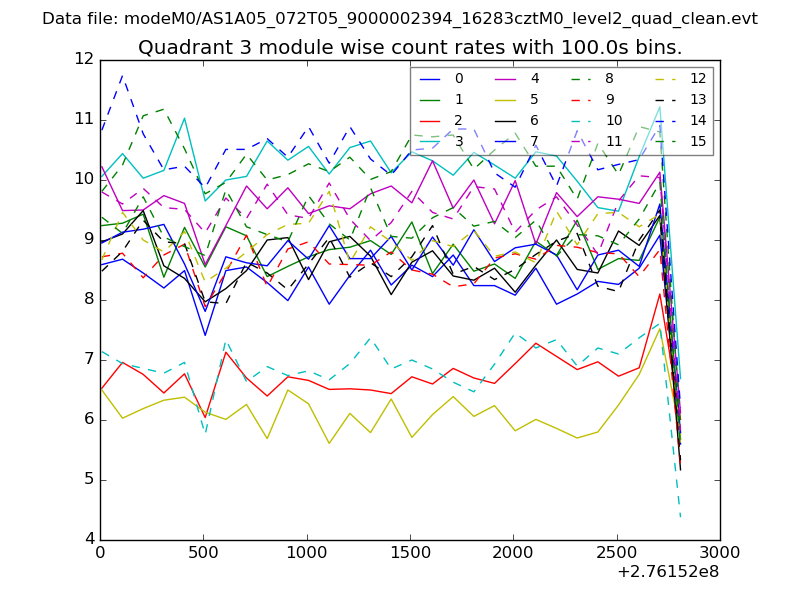
| Module-wise count rates for Quadrant C Data is divided into 100 sec bins |
 |
 |
| Module-wise count rates for Quadrant D Data is divided into 100 sec bins |
 |
 |
| Parameter | Plot |
|---|---|
| CZT HV Monitor | 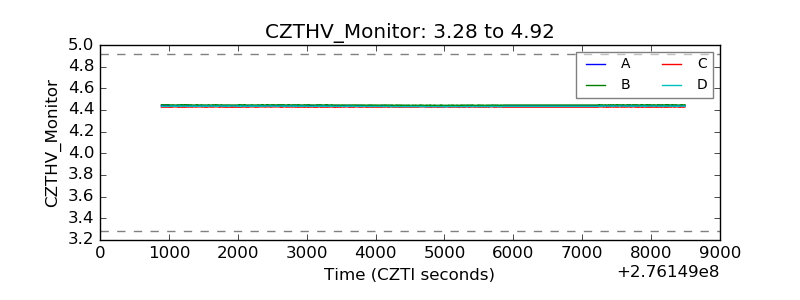 |
| D_VDD | 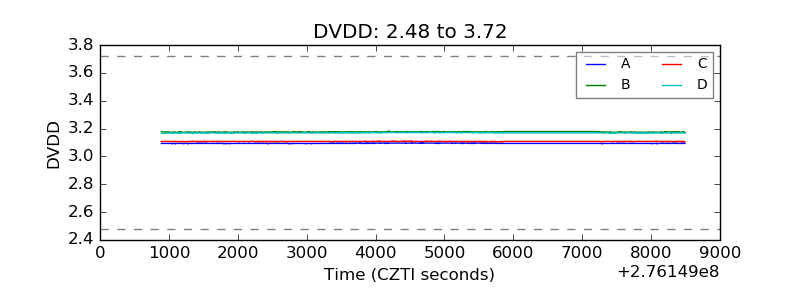 |
| Temperature 1 | 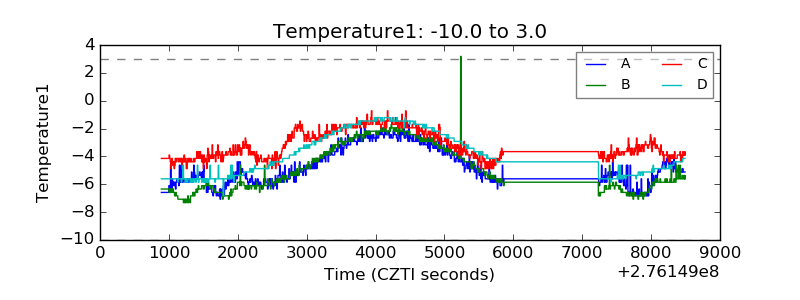 |
| Veto HV Monitor |  |
| Veto LLD | 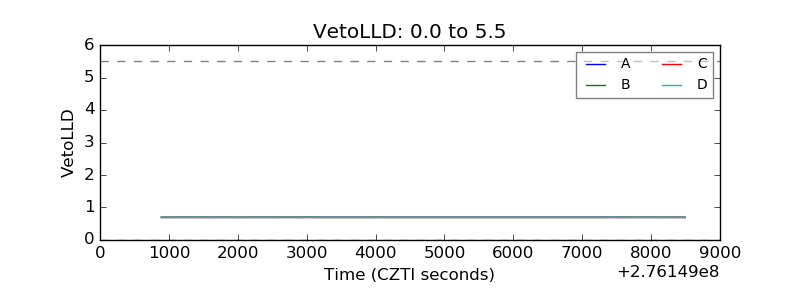 |
| Alpha Counter |  |
| _CPM_Rate | 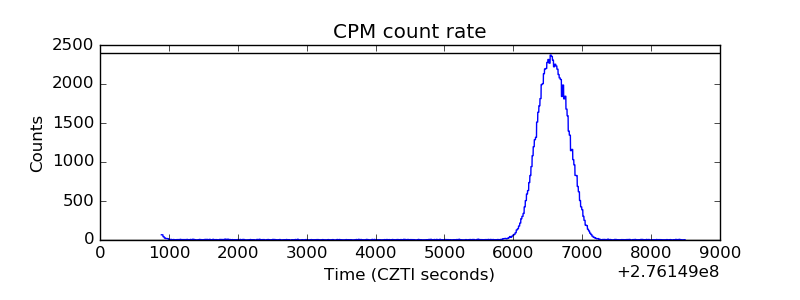 |
| CZT Counter | 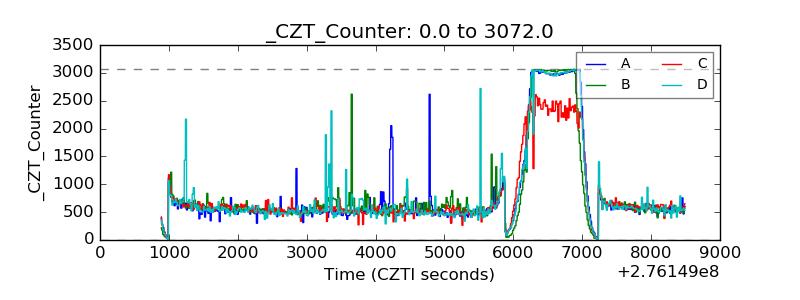 |
| +2.5 Volts monitor |  |
| +5 Volts monitor |  |
| _ROLL_ROT | 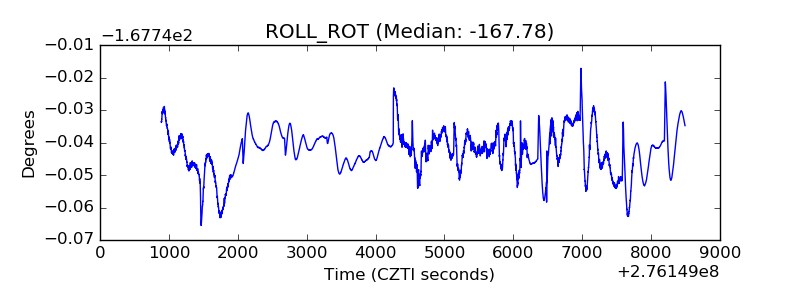 |
| _Roll_DEC | 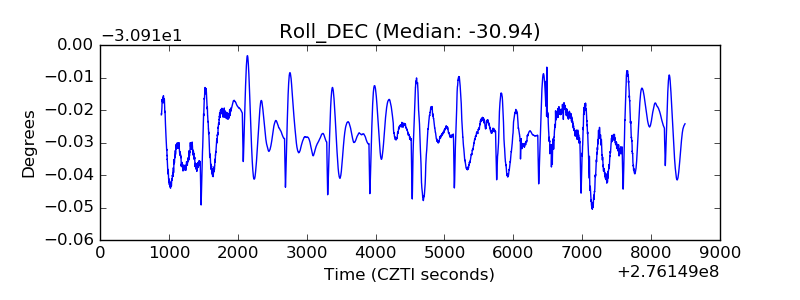 |
| _Roll_RA | 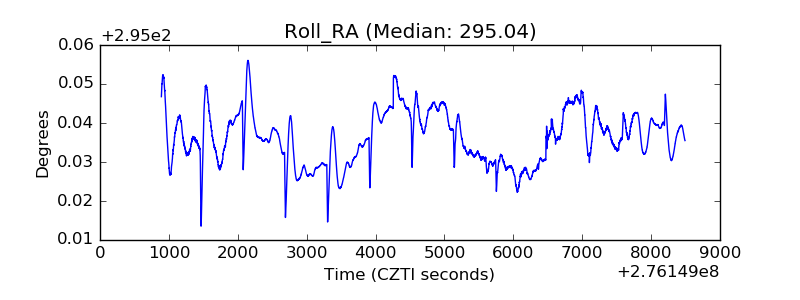 |
| Veto Counter | 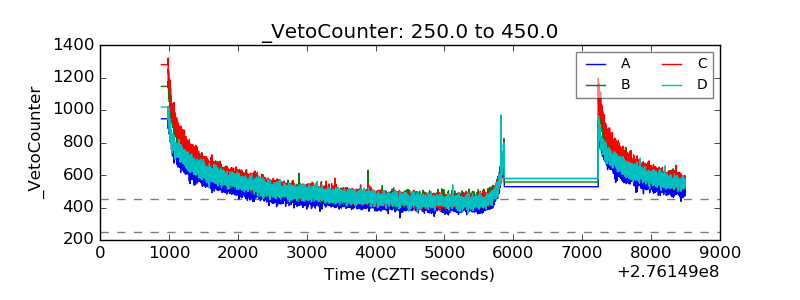 |