| Param | Original file | Final file |
|---|---|---|
| Filename | modeM0/AS1A05_072T05_9000002394_16285cztM0_level2.evt | modeM0/AS1A05_072T05_9000002394_16285cztM0_level2_quad_clean.evt |
| Size (bytes) | 493,375,680 | 91,762,560 |
| Size | 470.5 MB | 87.5 MB |
| Events in quadrant A | 3,558,583 | 579,158 |
| Events in quadrant B | 3,533,321 | 594,661 |
| Events in quadrant C | 3,411,507 | 585,736 |
| Events in quadrant D | 4,003,142 | 572,032 |
| Mode SS | |||
|---|---|---|---|
| Quadrant | BADHDUFLAG | Total packets | Discarded packets |
| A | 0 | 130 | 0 |
| B | 0 | 130 | 0 |
| C | 0 | 130 | 0 |
| D | 0 | 130 | 0 |
| Mode M9 | |||
|---|---|---|---|
| Quadrant | BADHDUFLAG | Total packets | Discarded packets |
| A | 0 | 17 | 0 |
| B | 0 | 17 | 0 |
| C | 0 | 17 | 0 |
| D | 0 | 18 | 0 |
| Mode M0 | |||
|---|---|---|---|
| Quadrant | BADHDUFLAG | Total packets | Discarded packets |
| A | 0 | 14367 | 3 |
| B | 0 | 14274 | 2 |
| C | 0 | 13872 | 2 |
| D | 0 | 15897 | 2 |
| Quadrant | Total seconds | Saturated seconds | Saturation percentage |
|---|---|---|---|
| A | 6412 | 217 | 3.384279% |
| B | 6412 | 175 | 2.729258% |
| C | 6412 | 195 | 3.041173% |
| D | 6412 | 173 | 2.698066% |
Noise dominated data is calculated using 1-second bins in cleaned event files. If a bin has >2000 counts, and if more than 50% of those come from <1% of pixels, then it is considered to be noise-dominated and hence unusable.
| Quadrant | # 1 sec bins | Bins with >0 counts | Bins with >2000 counts | High rate bins dominated by noise | Noise dominated (total time) | Noise dominated (detector-on time) | Marked lightcurve |
|---|---|---|---|---|---|---|---|
| A | 7578 | 6414 | 52 | 52 | 0.69% | 0.81% | 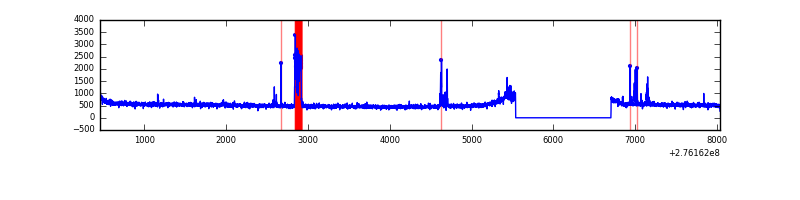 |
| B | 7578 | 6414 | 3 | 3 | 0.04% | 0.05% | 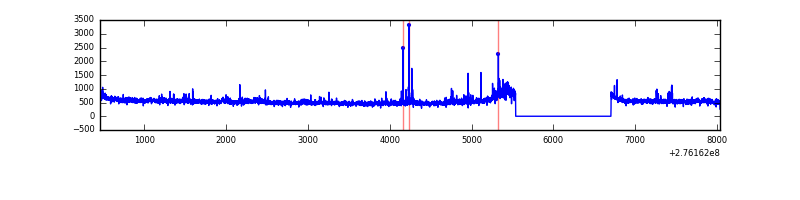 |
| C | 7578 | 6414 | 0 | 0 | 0.00% | 0.00% | 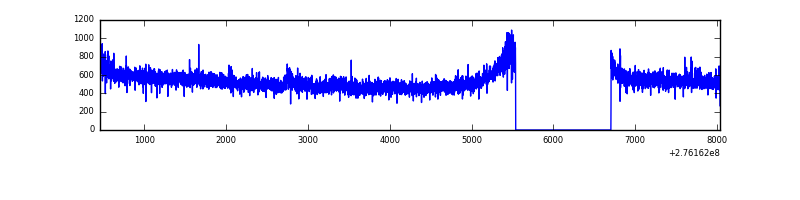 |
| D | 7578 | 6414 | 63 | 63 | 0.83% | 0.98% | 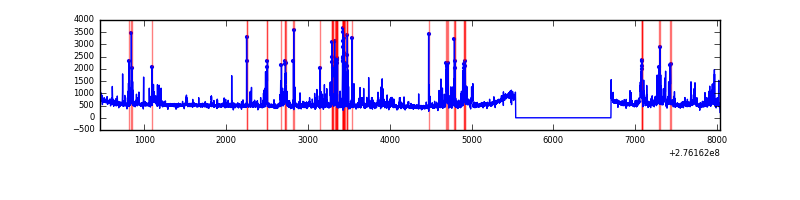 |
Top three noisy pixels from each quadrant. If the there are fewer than three noisy pixels in the level2.evt file, extra rows are filled as -1
| Pixel properties | Quadrant properties | ||||||
|---|---|---|---|---|---|---|---|
| Quadrant | DetID | PixID | Counts | Sigma | Mean | Median | Sigma |
| A | 15 | 174 | 257278 | 1483.78 | 858 | 842 | 172.8 |
| A | 0 | 226 | 7569 | 38.92 | 858 | 842 | 172.8 |
| A | 12 | 194 | 6312 | 31.65 | 858 | 842 | 172.8 |
| B | 0 | 189 | 71103 | 431.69 | 859 | 839 | 162.8 |
| B | 15 | 35 | 59458 | 360.15 | 859 | 839 | 162.8 |
| B | 0 | 198 | 30710 | 183.52 | 859 | 839 | 162.8 |
| C | 14 | 238 | 130444 | 677.0 | 829 | 834 | 191.4 |
| C | 3 | 233 | 40476 | 207.07 | 829 | 834 | 191.4 |
| C | 0 | 207 | 7350 | 34.04 | 829 | 834 | 191.4 |
| D | 1 | 52 | 723344 | 3519.11 | 847 | 825 | 205.3 |
| D | 10 | 70 | 67238 | 323.47 | 847 | 825 | 205.3 |
| D | 2 | 234 | 22247 | 104.34 | 847 | 825 | 205.3 |
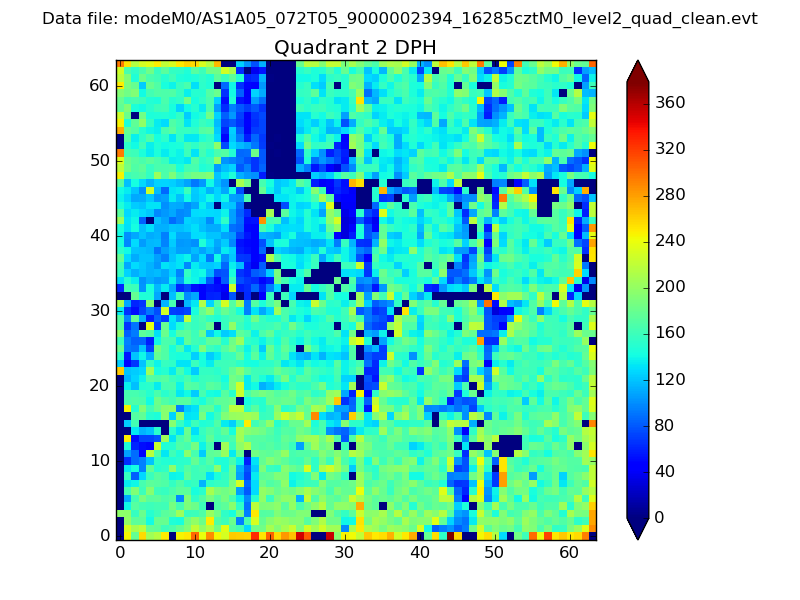
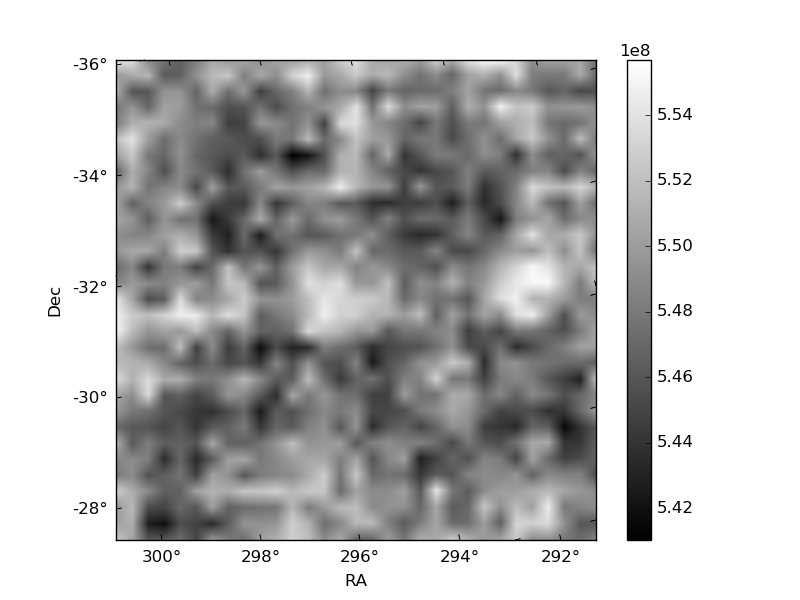
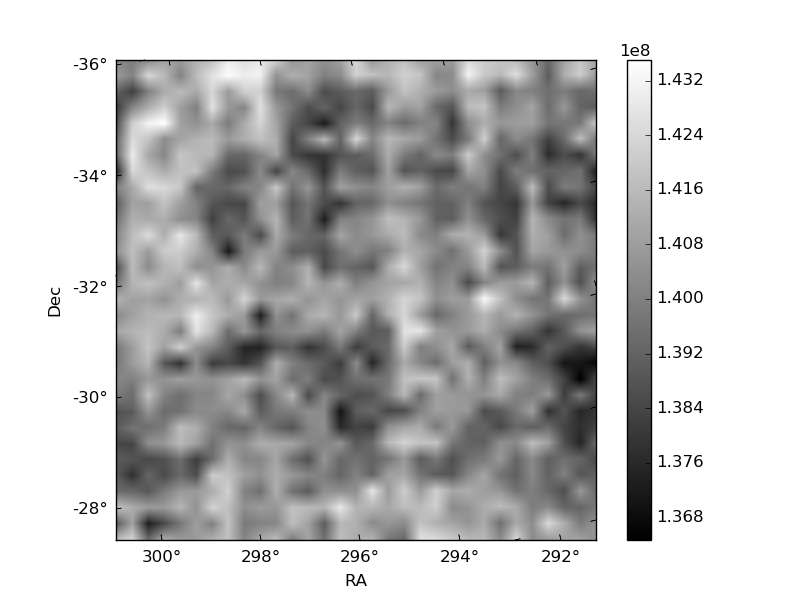
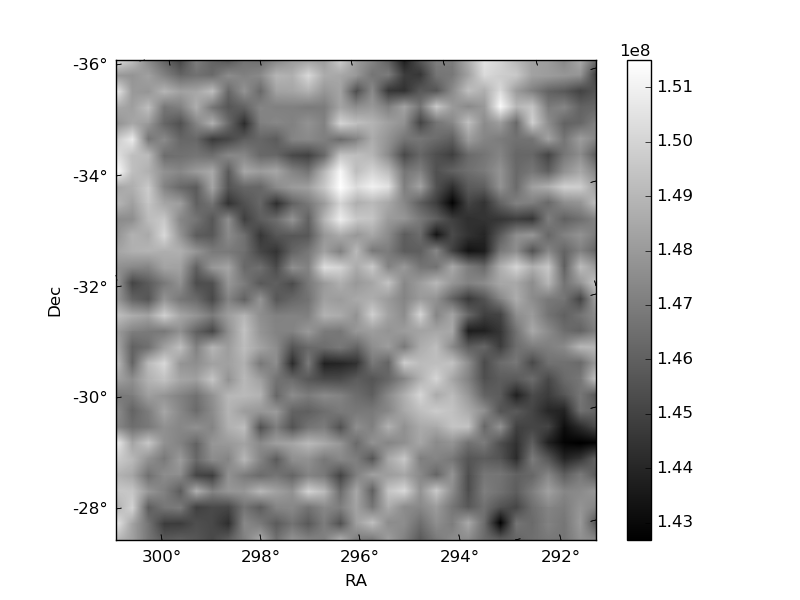
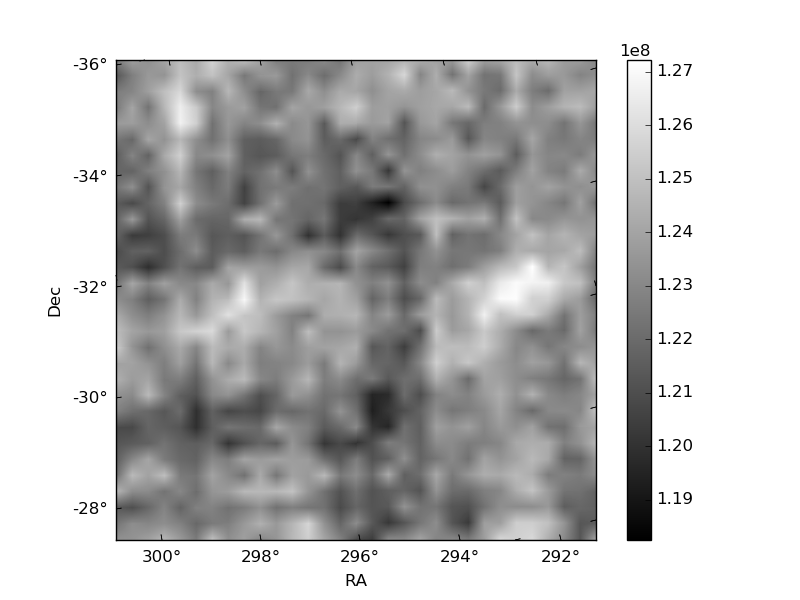
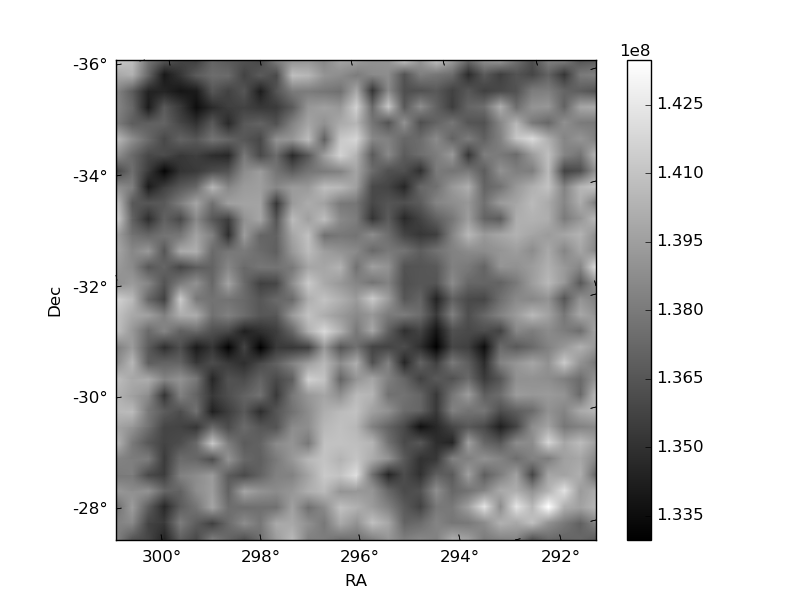
Histogram calculated using DETX and DETY for each event in the final _common_clean file
| Quadrant A | 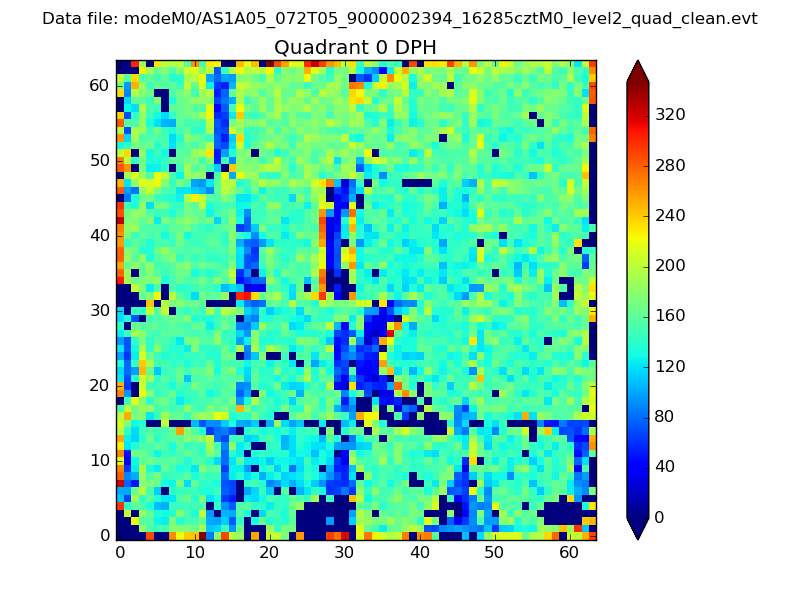 |
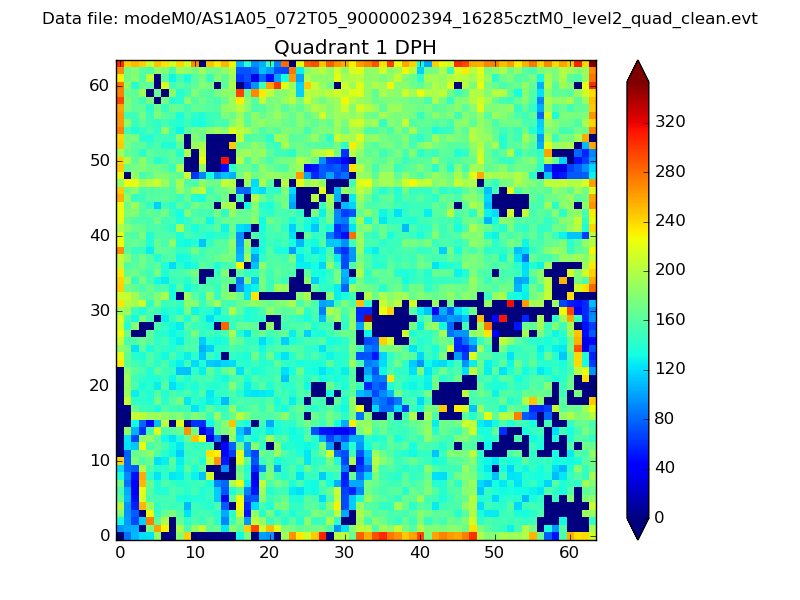 |
Quadrant B |
|---|---|---|---|
| Quadrant D | 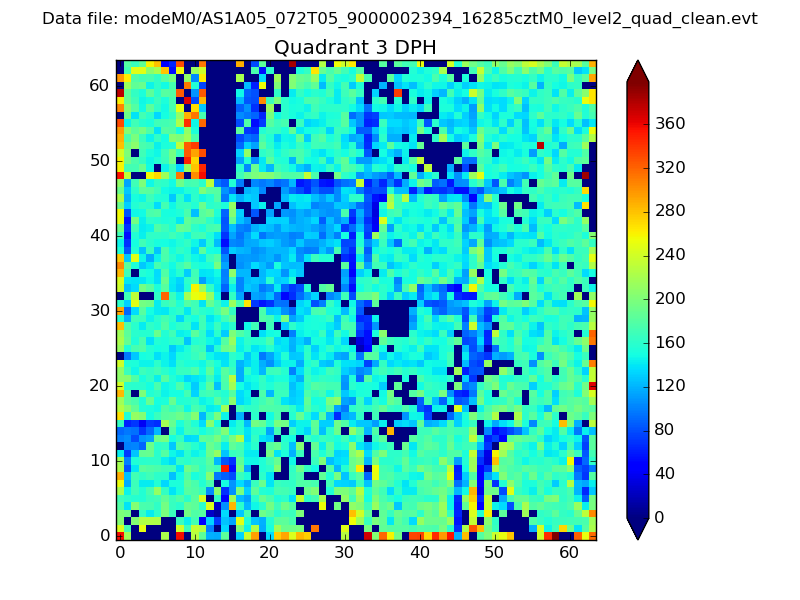 |
 |
Quadrant C |
| Plot type | Count rate plots | Images |
|---|---|---|
| Comparison with Poisson distribution Blue bars denote a histogram of data divided into 1 sec bins. Red curve is a Poisson curve with rate = median count rate of data. |
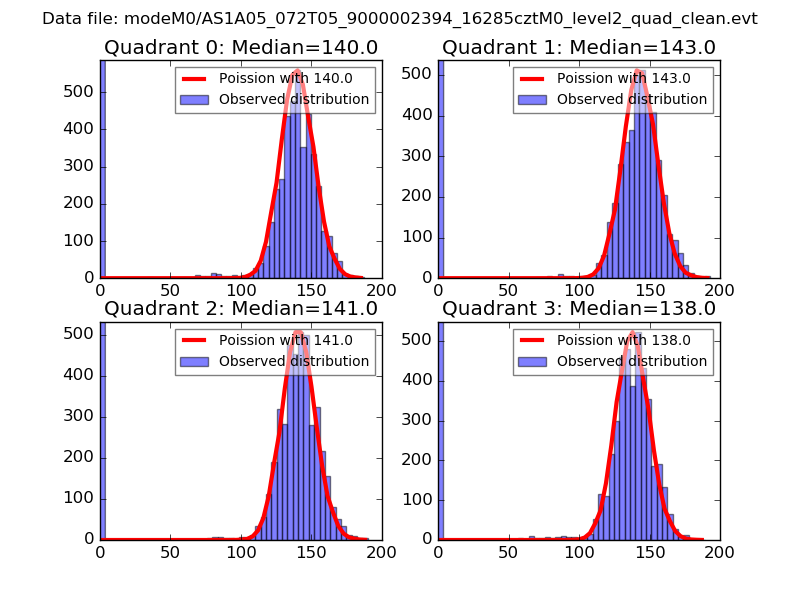 |
 |
| Quadrant-wise count rates Data is divided into 100 sec bins |
 |
|
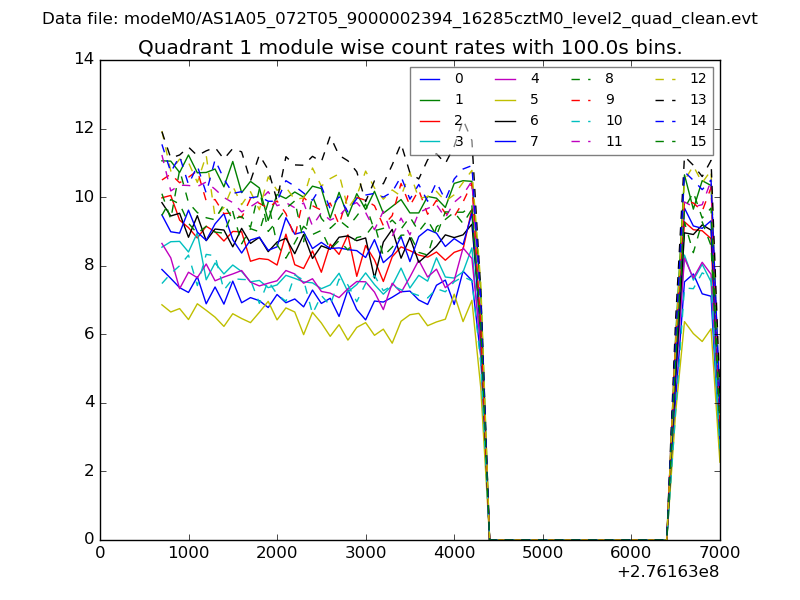
| Module-wise count rates for Quadrant A Data is divided into 100 sec bins |
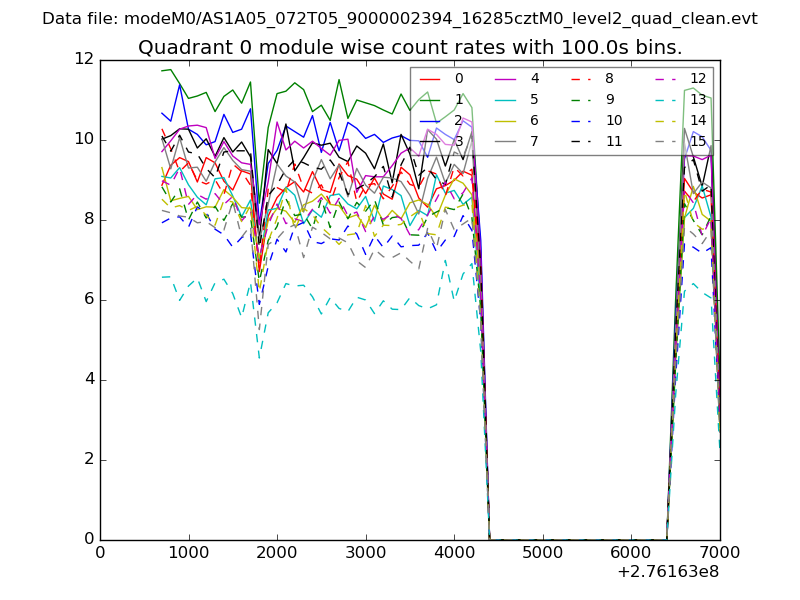 |
 |
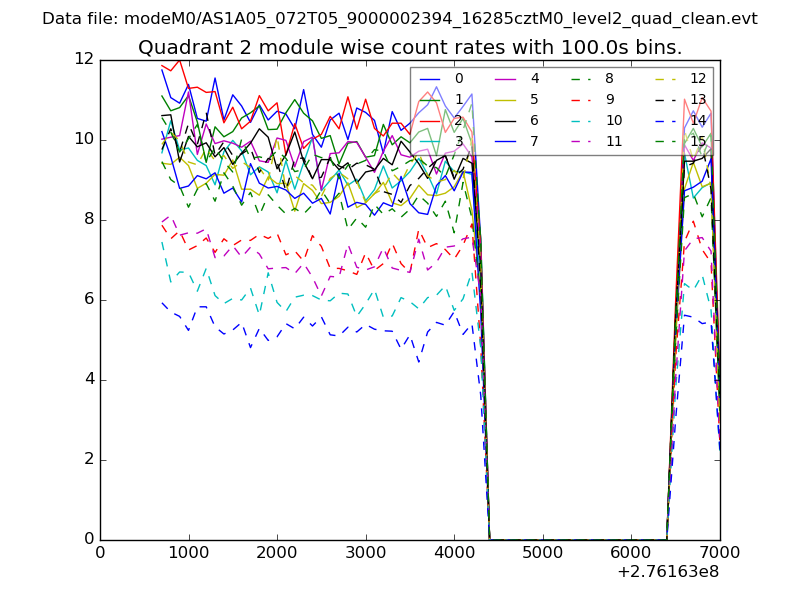
| Module-wise count rates for Quadrant B Data is divided into 100 sec bins |
 |
 |
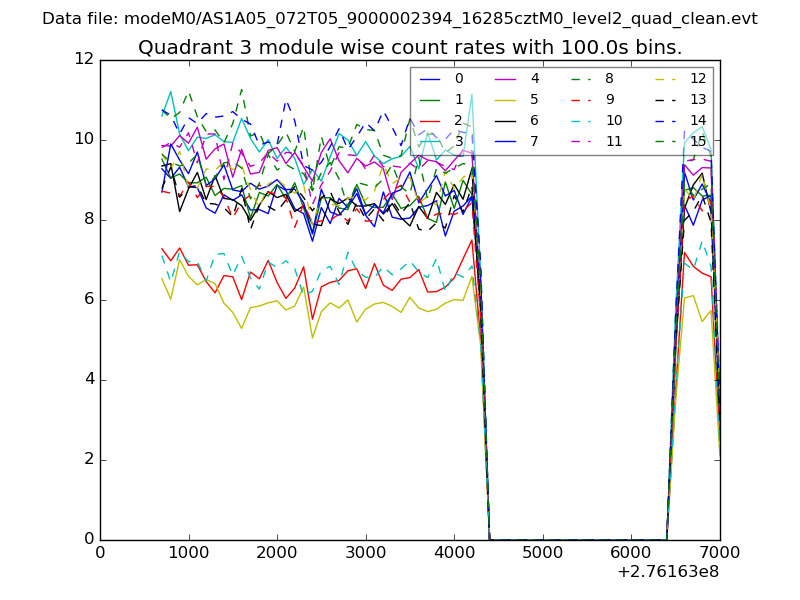
| Module-wise count rates for Quadrant C Data is divided into 100 sec bins |
 |
 |
| Module-wise count rates for Quadrant D Data is divided into 100 sec bins |
 |
 |
| Parameter | Plot |
|---|---|
| CZT HV Monitor | 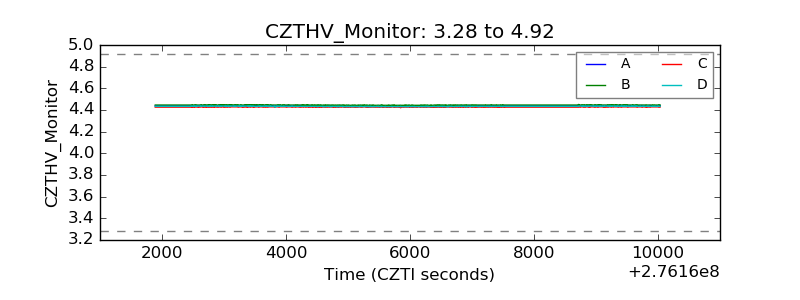 |
| D_VDD | 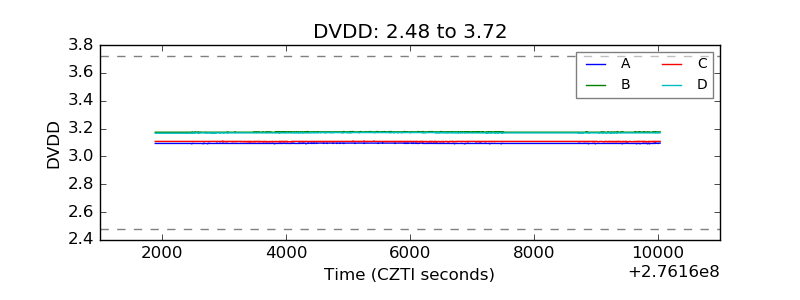 |
| Temperature 1 | 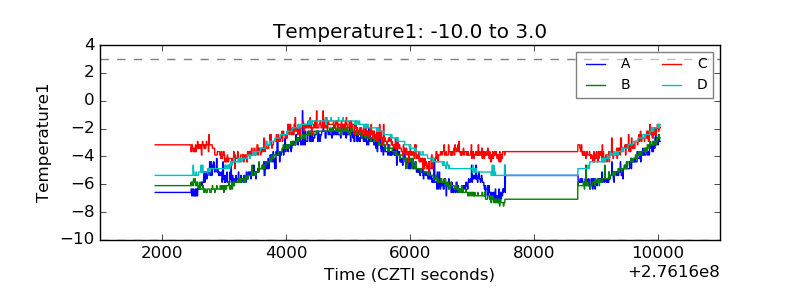 |
| Veto HV Monitor |  |
| Veto LLD | 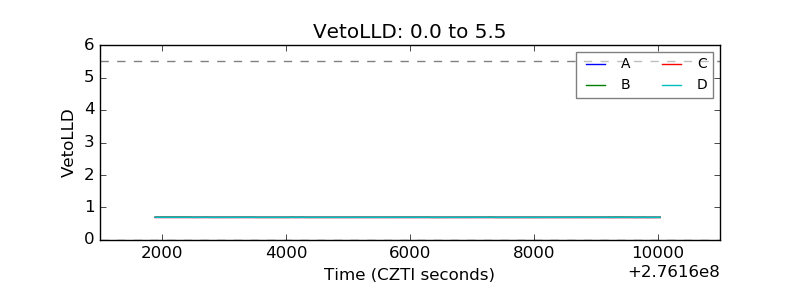 |
| Alpha Counter |  |
| _CPM_Rate |  |
| CZT Counter | 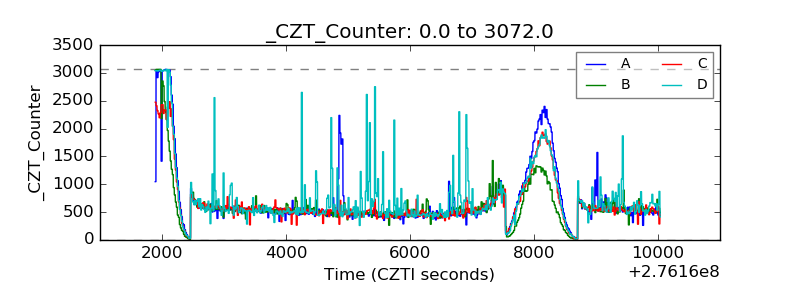 |
| +2.5 Volts monitor | 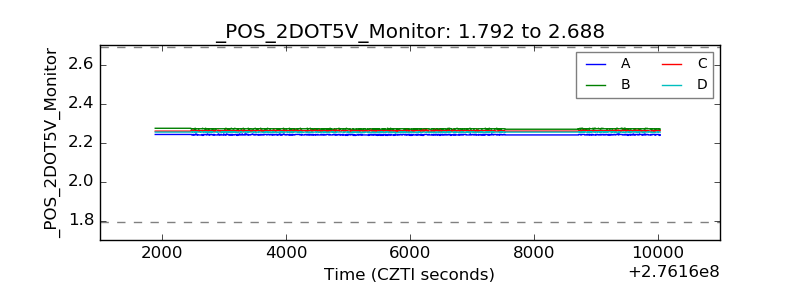 |
| +5 Volts monitor |  |
| _ROLL_ROT | 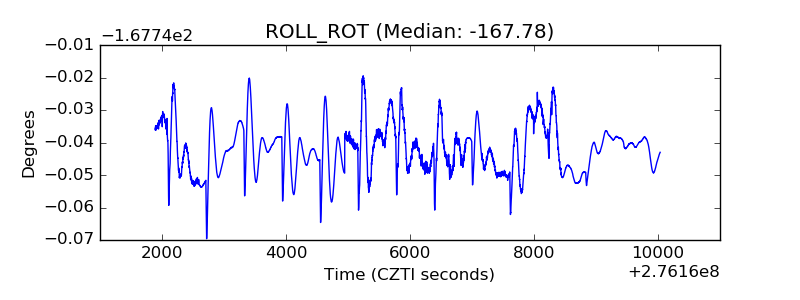 |
| _Roll_DEC | 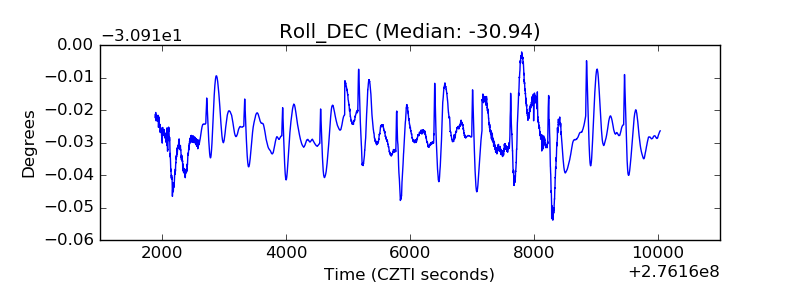 |
| _Roll_RA | 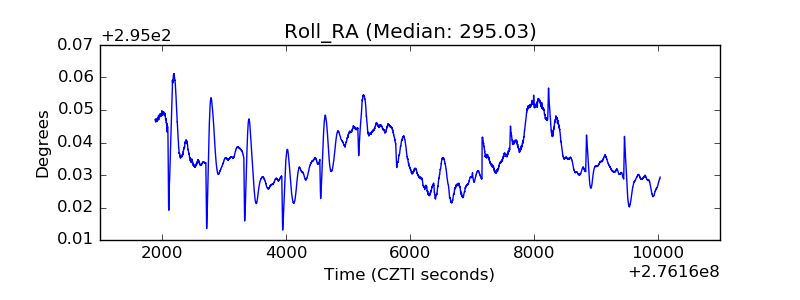 |
| Veto Counter | 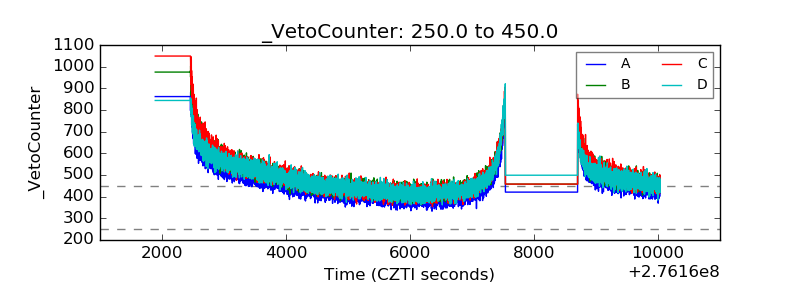 |