| Param | Original file | Final file |
|---|---|---|
| Filename | modeM0/AS1A05_182T02_9000002392_16267cztM0_level2.evt | modeM0/AS1A05_182T02_9000002392_16267cztM0_level2_quad_clean.evt |
| Size (bytes) | 119,594,880 | 33,356,160 |
| Size | 114.1 MB | 31.8 MB |
| Events in quadrant A | 798,892 | 232,511 |
| Events in quadrant B | 1,267,016 | 222,434 |
| Events in quadrant C | 751,606 | 224,593 |
| Events in quadrant D | 703,702 | 223,065 |
| Mode M0 | |||
|---|---|---|---|
| Quadrant | BADHDUFLAG | Total packets | Discarded packets |
| A | 0 | 3234 | 2 |
| B | 0 | 4738 | 1 |
| C | 0 | 3098 | 1 |
| D | 0 | 3012 | 1 |
| Mode SS | |||
|---|---|---|---|
| Quadrant | BADHDUFLAG | Total packets | Discarded packets |
| A | 0 | 28 | 0 |
| B | 0 | 28 | 0 |
| C | 0 | 28 | 0 |
| D | 0 | 28 | 0 |
| Mode M9 | |||
|---|---|---|---|
| Quadrant | BADHDUFLAG | Total packets | Discarded packets |
| A | 0 | 5 | 0 |
| B | 0 | 5 | 0 |
| C | 0 | 5 | 0 |
| D | 0 | 5 | 0 |
| Quadrant | Total seconds | Saturated seconds | Saturation percentage |
|---|---|---|---|
| A | 1445 | 10 | 0.692042% |
| B | 1445 | 166 | 11.487889% |
| C | 1445 | 10 | 0.692042% |
| D | 1445 | 1 | 0.069204% |
Noise dominated data is calculated using 1-second bins in cleaned event files. If a bin has >2000 counts, and if more than 50% of those come from <1% of pixels, then it is considered to be noise-dominated and hence unusable.
| Quadrant | # 1 sec bins | Bins with >0 counts | Bins with >2000 counts | High rate bins dominated by noise | Noise dominated (total time) | Noise dominated (detector-on time) | Marked lightcurve |
|---|---|---|---|---|---|---|---|
| A | 1446 | 1446 | 2 | 2 | 0.14% | 0.14% | 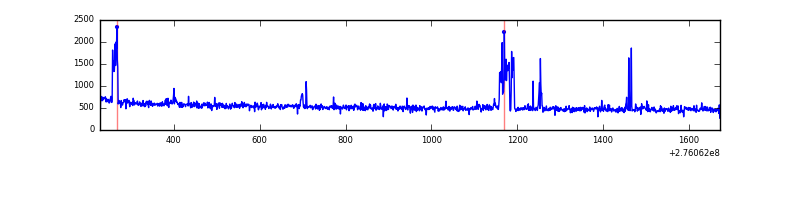 |
| B | 1446 | 1446 | 110 | 110 | 7.61% | 7.61% | 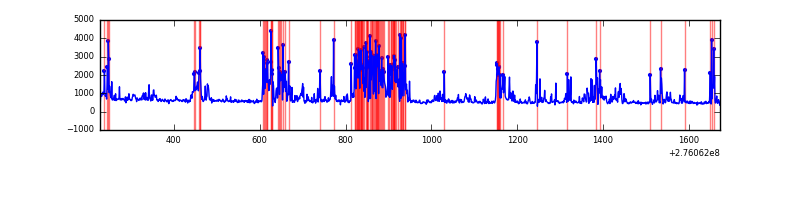 |
| C | 1446 | 1446 | 0 | 0 | 0.00% | 0.00% | 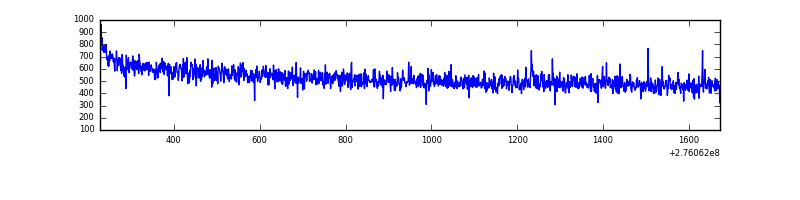 |
| D | 1446 | 1446 | 0 | 0 | 0.00% | 0.00% | 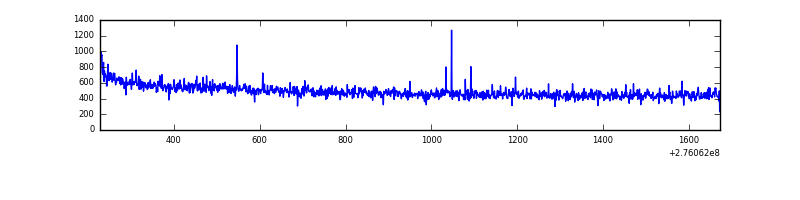 |
Top three noisy pixels from each quadrant. If the there are fewer than three noisy pixels in the level2.evt file, extra rows are filled as -1
| Pixel properties | Quadrant properties | ||||||
|---|---|---|---|---|---|---|---|
| Quadrant | DetID | PixID | Counts | Sigma | Mean | Median | Sigma |
| A | 15 | 174 | 31055 | 788.73 | 192 | 190 | 39.1 |
| A | 14 | 4 | 17553 | 443.69 | 192 | 190 | 39.1 |
| A | 9 | 143 | 11344 | 285.03 | 192 | 190 | 39.1 |
| B | 3 | 112 | 537463 | 14801.31 | 184 | 181 | 36.3 |
| B | 0 | 189 | 5197 | 138.18 | 184 | 181 | 36.3 |
| B | 12 | 111 | 3644 | 95.4 | 184 | 181 | 36.3 |
| C | 14 | 238 | 30510 | 695.04 | 182 | 184 | 43.6 |
| C | 3 | 233 | 9071 | 203.68 | 182 | 184 | 43.6 |
| C | 13 | 61 | 1332 | 26.31 | 182 | 184 | 43.6 |
| D | 2 | 120 | 6866 | 148.49 | 182 | 177 | 45.0 |
| D | 1 | 52 | 4923 | 105.36 | 182 | 177 | 45.0 |
| D | 2 | 234 | 3444 | 72.53 | 182 | 177 | 45.0 |
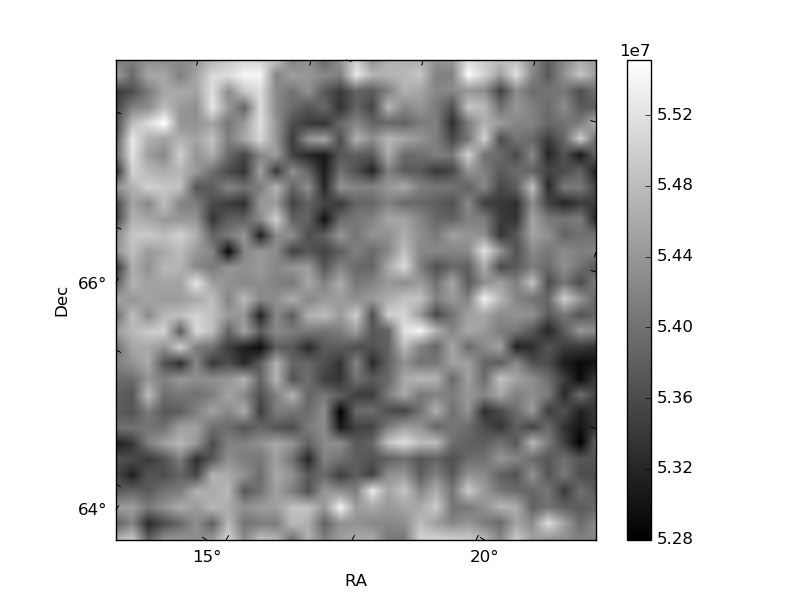
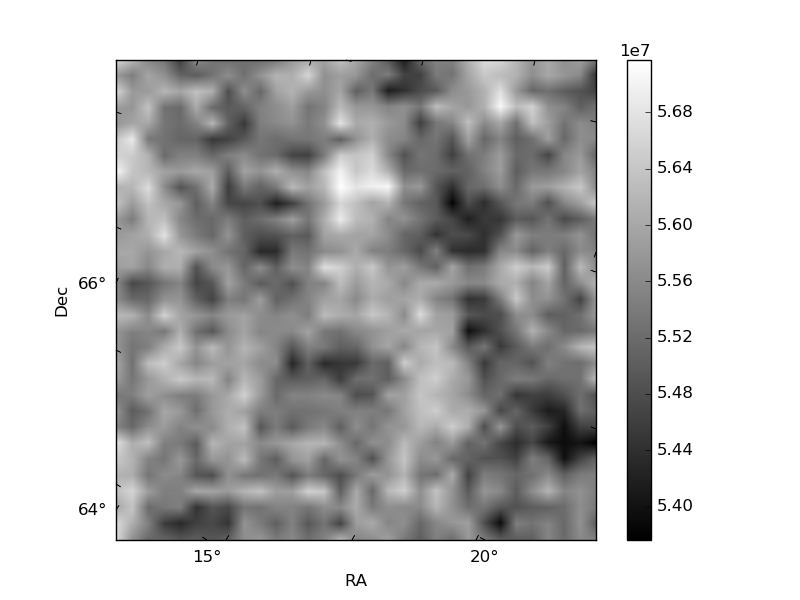
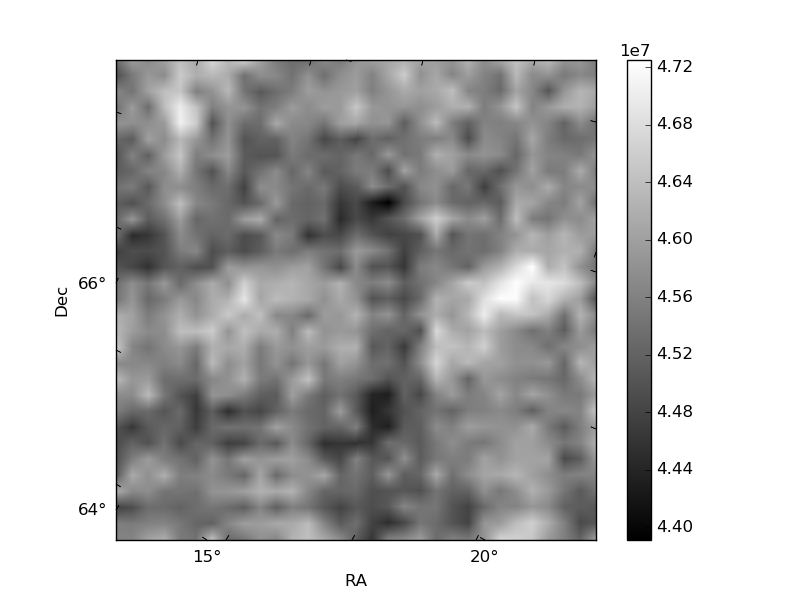
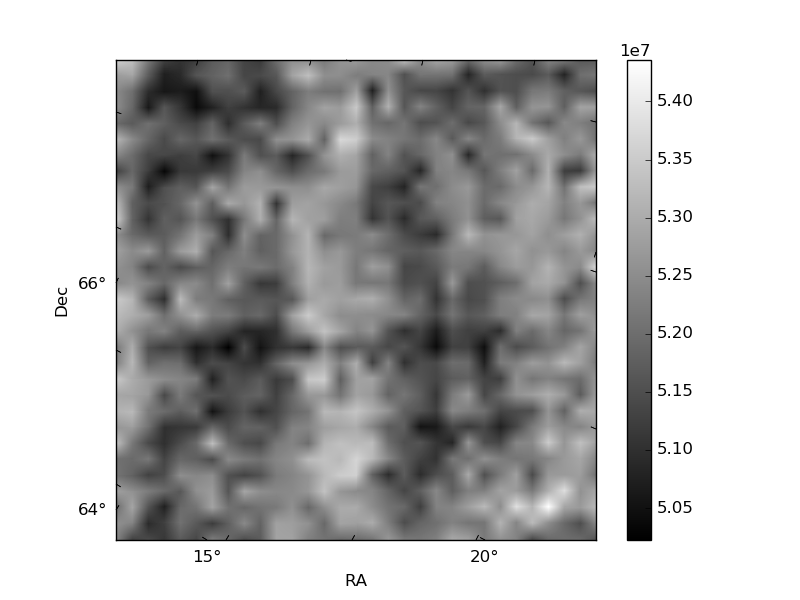
Histogram calculated using DETX and DETY for each event in the final _common_clean file
| Quadrant A | 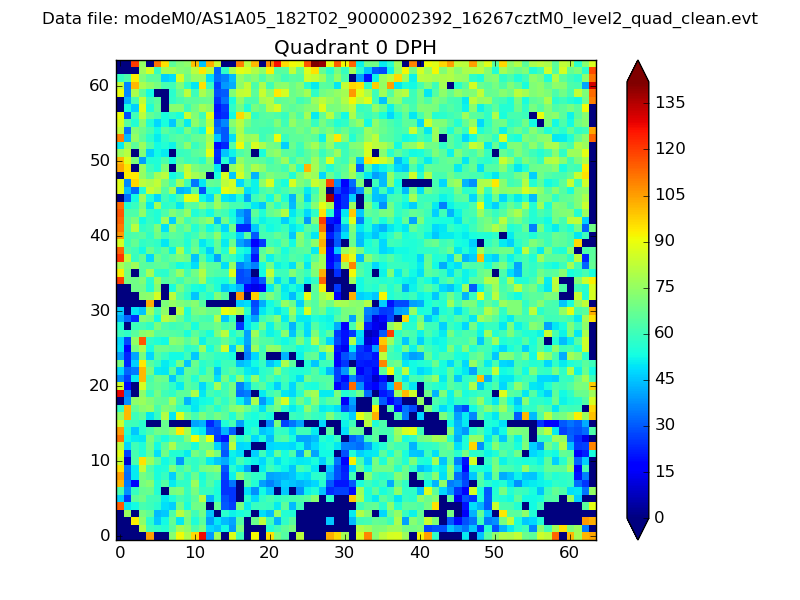 |
 |
Quadrant B |
|---|---|---|---|
| Quadrant D |  |
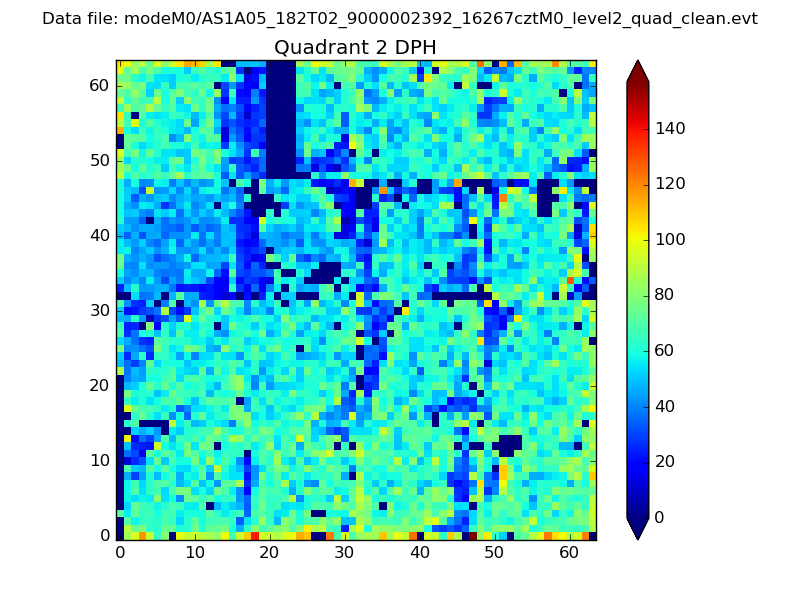 |
Quadrant C |
| Plot type | Count rate plots | Images |
|---|---|---|
| Comparison with Poisson distribution Blue bars denote a histogram of data divided into 1 sec bins. Red curve is a Poisson curve with rate = median count rate of data. |
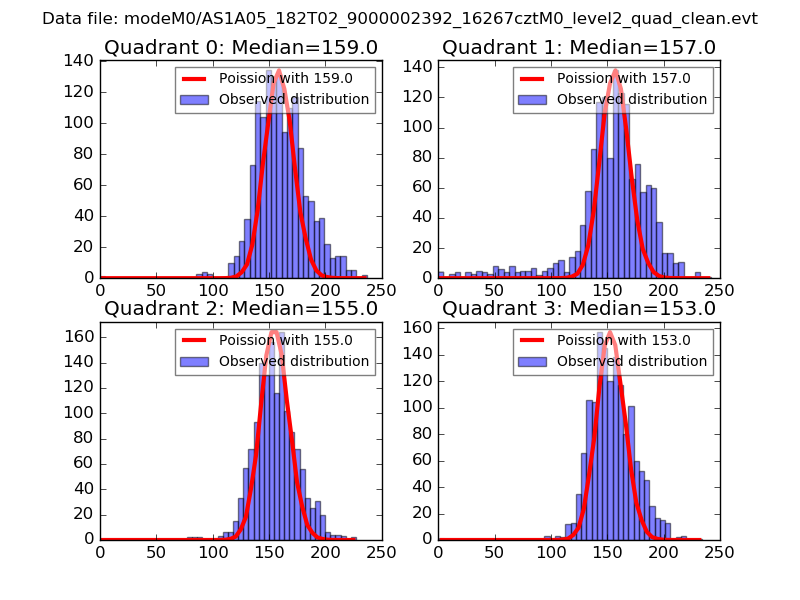 |
 |
| Quadrant-wise count rates Data is divided into 100 sec bins |
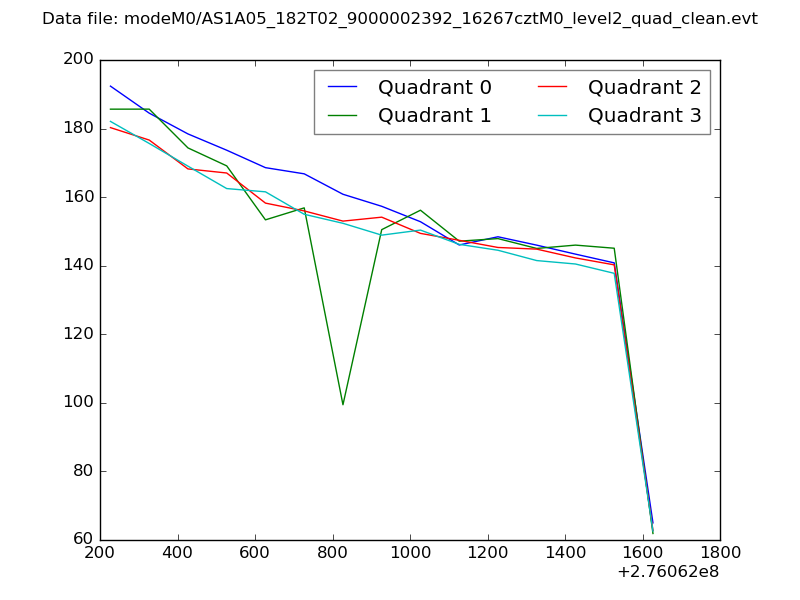 |
|
| Module-wise count rates for Quadrant A Data is divided into 100 sec bins |
 |
 |
| Module-wise count rates for Quadrant B Data is divided into 100 sec bins |
 |
 |
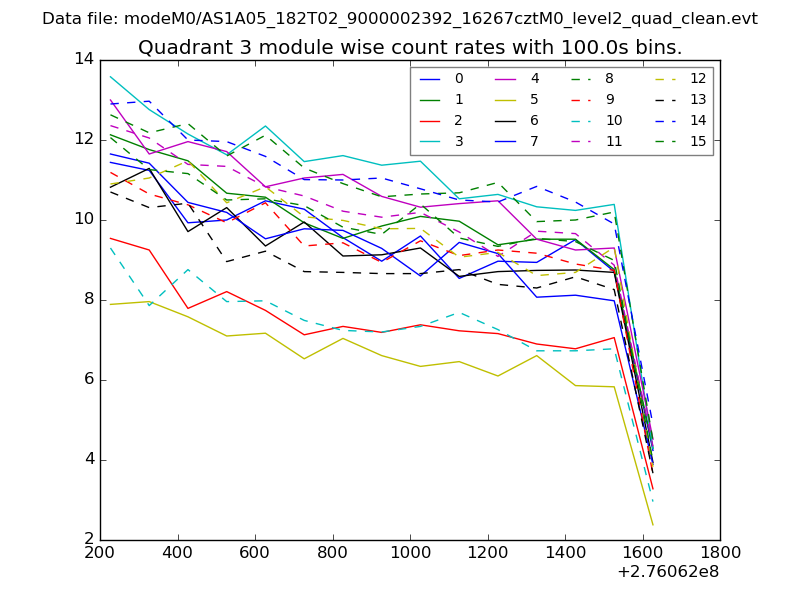
| Module-wise count rates for Quadrant C Data is divided into 100 sec bins |
 |
 |
| Module-wise count rates for Quadrant D Data is divided into 100 sec bins |
 |
 |
| Parameter | Plot |
|---|---|
| CZT HV Monitor |  |
| D_VDD | 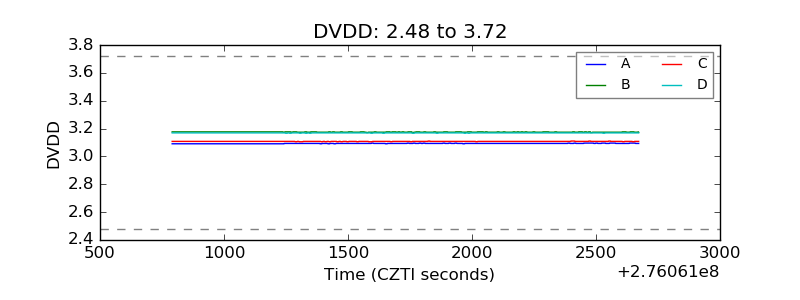 |
| Temperature 1 | 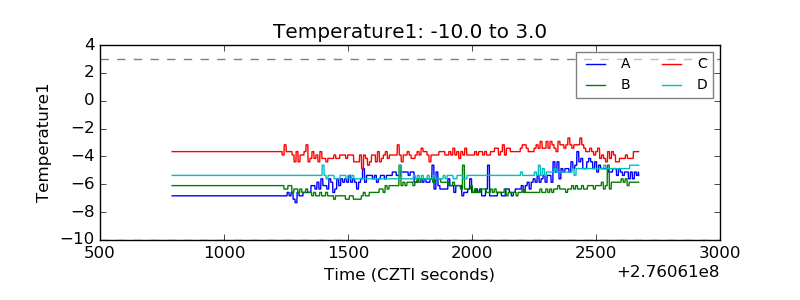 |
| Veto HV Monitor | 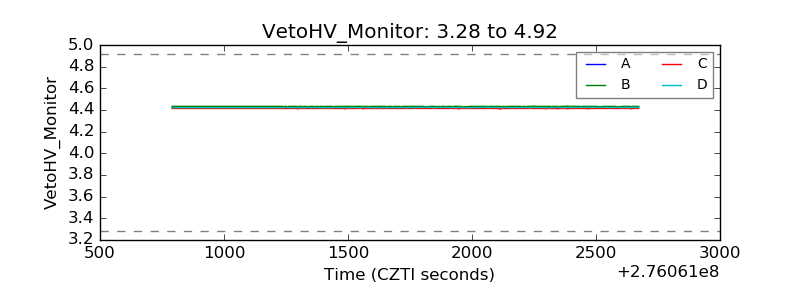 |
| Veto LLD | 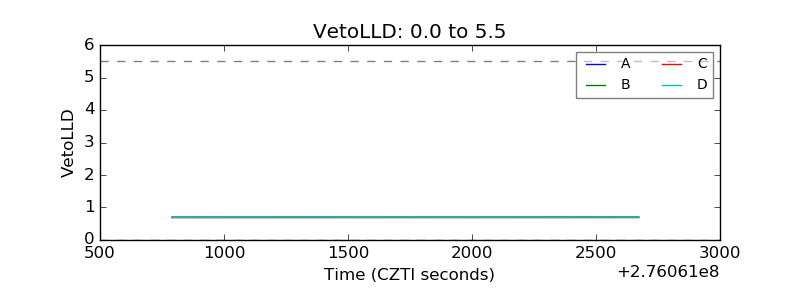 |
| Alpha Counter | 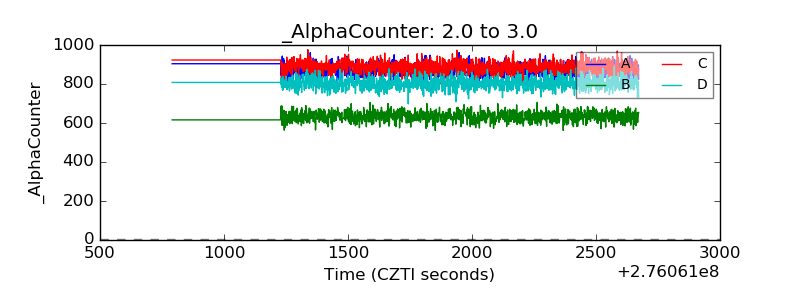 |
| _CPM_Rate | 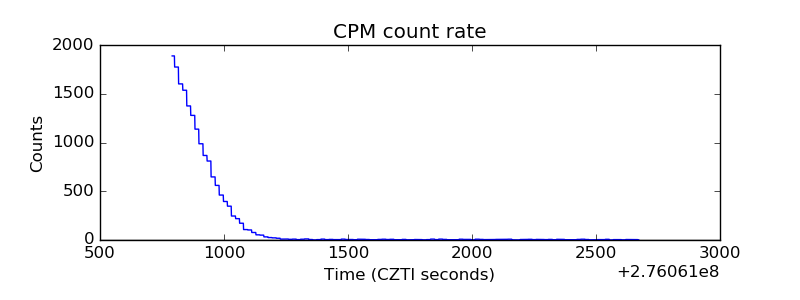 |
| CZT Counter | 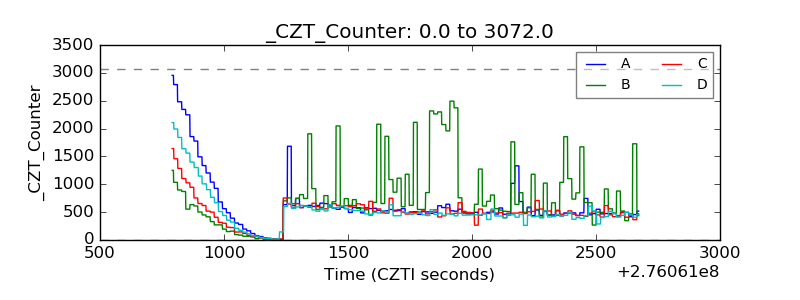 |
| +2.5 Volts monitor |  |
| +5 Volts monitor |  |
| _ROLL_ROT | 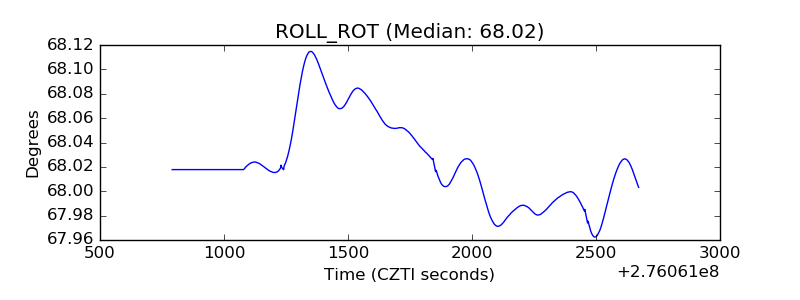 |
| _Roll_DEC | 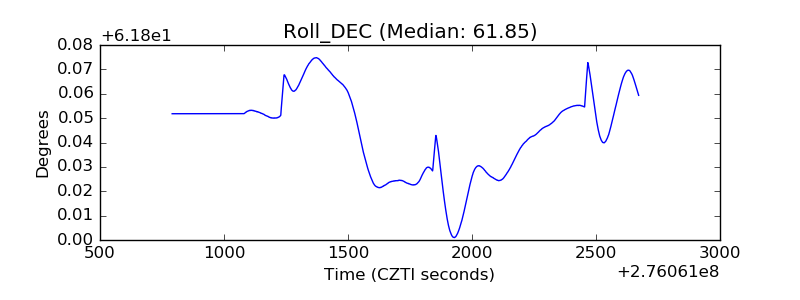 |
| _Roll_RA | 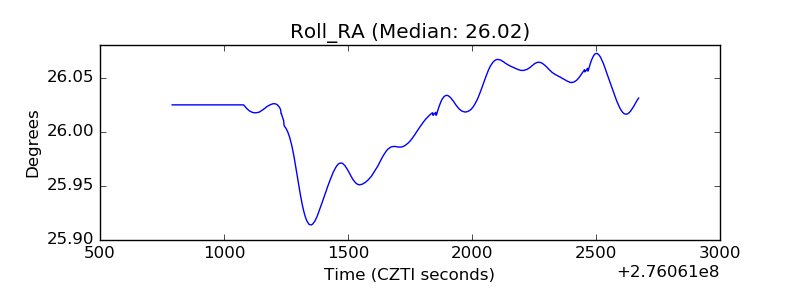 |
| Veto Counter |  |