| Param | Original file | Final file |
|---|---|---|
| Filename | modeM0/AS1A05_182T02_9000002392_16268cztM0_level2.evt | modeM0/AS1A05_182T02_9000002392_16268cztM0_level2_quad_clean.evt |
| Size (bytes) | 520,594,560 | 117,720,000 |
| Size | 496.5 MB | 112.3 MB |
| Events in quadrant A | 3,170,341 | 809,852 |
| Events in quadrant B | 5,420,682 | 773,235 |
| Events in quadrant C | 3,191,968 | 780,001 |
| Events in quadrant D | 3,561,274 | 767,897 |
| Mode M0 | |||
|---|---|---|---|
| Quadrant | BADHDUFLAG | Total packets | Discarded packets |
| A | 0 | 13119 | 3 |
| B | 0 | 20189 | 2 |
| C | 0 | 13268 | 2 |
| D | 0 | 14662 | 2 |
| Mode SS | |||
|---|---|---|---|
| Quadrant | BADHDUFLAG | Total packets | Discarded packets |
| A | 0 | 126 | 0 |
| B | 0 | 126 | 0 |
| C | 0 | 126 | 0 |
| D | 0 | 126 | 0 |
| Mode M9 | |||
|---|---|---|---|
| Quadrant | BADHDUFLAG | Total packets | Discarded packets |
| A | 0 | 14 | 0 |
| B | 0 | 14 | 0 |
| C | 0 | 14 | 0 |
| D | 0 | 15 | 0 |
| Quadrant | Total seconds | Saturated seconds | Saturation percentage |
|---|---|---|---|
| A | 6225 | 37 | 0.594378% |
| B | 6225 | 713 | 11.453815% |
| C | 6225 | 54 | 0.867470% |
| D | 6225 | 91 | 1.461847% |
Noise dominated data is calculated using 1-second bins in cleaned event files. If a bin has >2000 counts, and if more than 50% of those come from <1% of pixels, then it is considered to be noise-dominated and hence unusable.
| Quadrant | # 1 sec bins | Bins with >0 counts | Bins with >2000 counts | High rate bins dominated by noise | Noise dominated (total time) | Noise dominated (detector-on time) | Marked lightcurve |
|---|---|---|---|---|---|---|---|
| A | 7561 | 6227 | 2 | 2 | 0.03% | 0.03% | 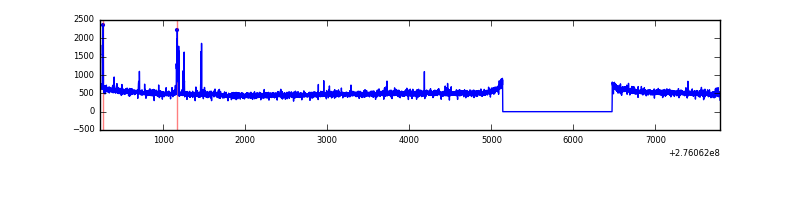 |
| B | 7561 | 6227 | 457 | 457 | 6.04% | 7.34% | 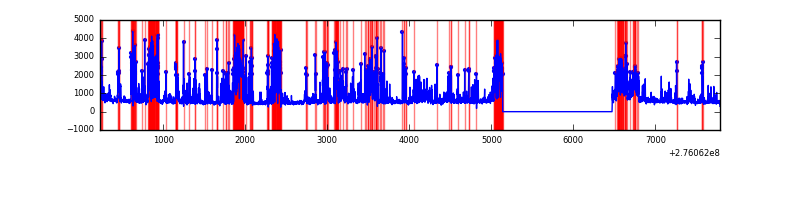 |
| C | 7561 | 6227 | 0 | 0 | 0.00% | 0.00% | 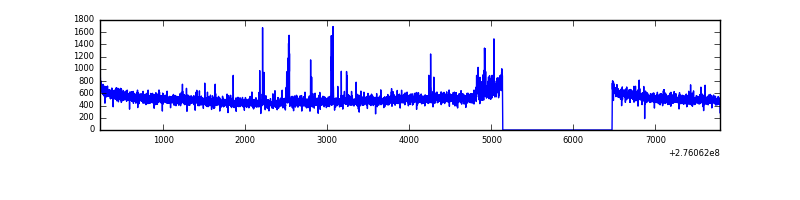 |
| D | 7561 | 6227 | 72 | 72 | 0.95% | 1.16% | 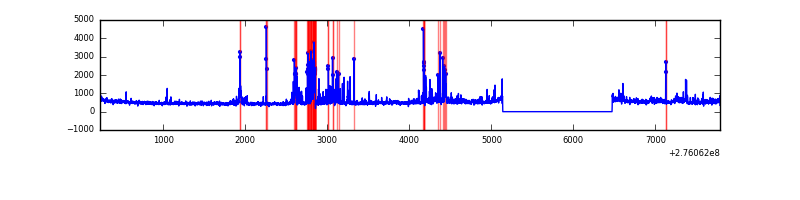 |
Top three noisy pixels from each quadrant. If the there are fewer than three noisy pixels in the level2.evt file, extra rows are filled as -1
| Pixel properties | Quadrant properties | ||||||
|---|---|---|---|---|---|---|---|
| Quadrant | DetID | PixID | Counts | Sigma | Mean | Median | Sigma |
| A | 15 | 174 | 42511 | 262.47 | 805 | 794 | 158.9 |
| A | 14 | 4 | 18285 | 110.05 | 805 | 794 | 158.9 |
| A | 9 | 143 | 13759 | 81.57 | 805 | 794 | 158.9 |
| B | 3 | 112 | 2249516 | 15953.35 | 762 | 745 | 141.0 |
| B | 0 | 198 | 48628 | 339.69 | 762 | 745 | 141.0 |
| B | 0 | 189 | 43040 | 300.05 | 762 | 745 | 141.0 |
| C | 14 | 238 | 124334 | 715.26 | 758 | 764 | 172.8 |
| C | 0 | 207 | 84424 | 484.25 | 758 | 764 | 172.8 |
| C | 3 | 233 | 28072 | 158.06 | 758 | 764 | 172.8 |
| D | 1 | 52 | 491386 | 2693.85 | 765 | 742 | 182.1 |
| D | 10 | 70 | 103033 | 561.62 | 765 | 742 | 182.1 |
| D | 15 | 0 | 49007 | 265.0 | 765 | 742 | 182.1 |
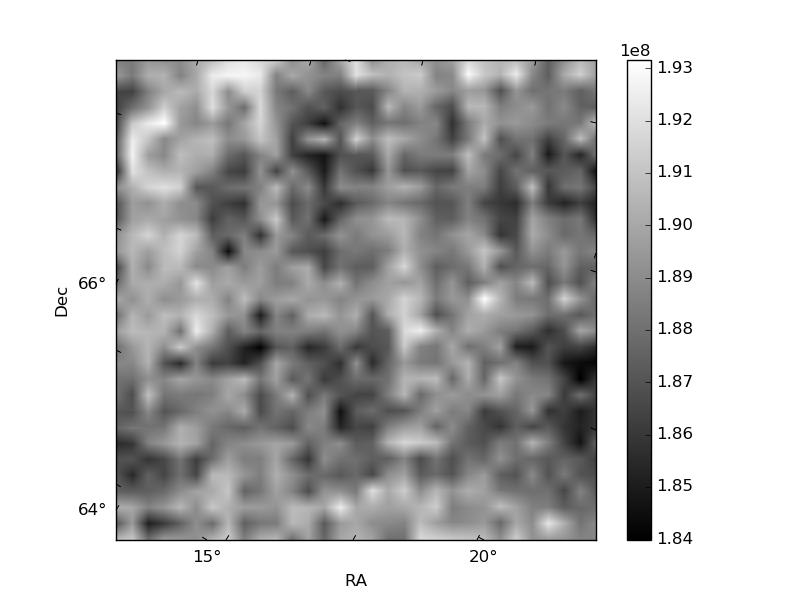
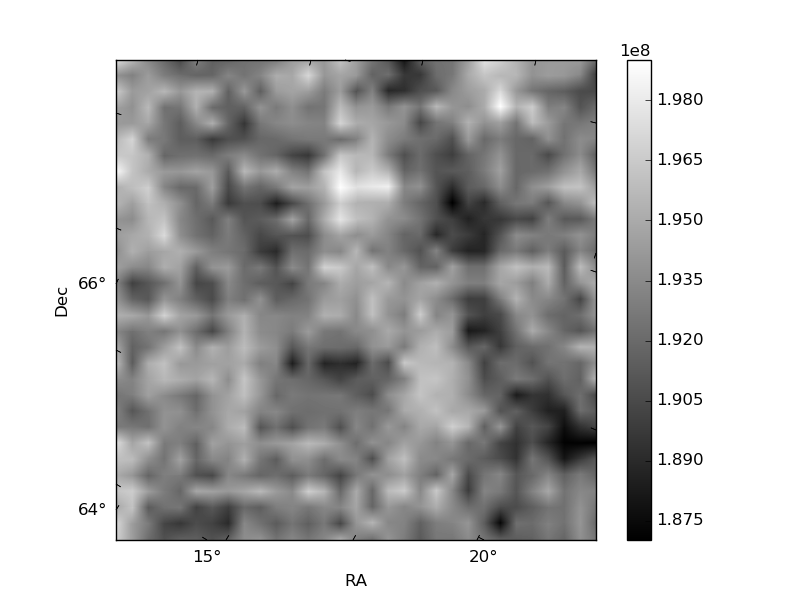
Histogram calculated using DETX and DETY for each event in the final _common_clean file
| Quadrant A |  |
 |
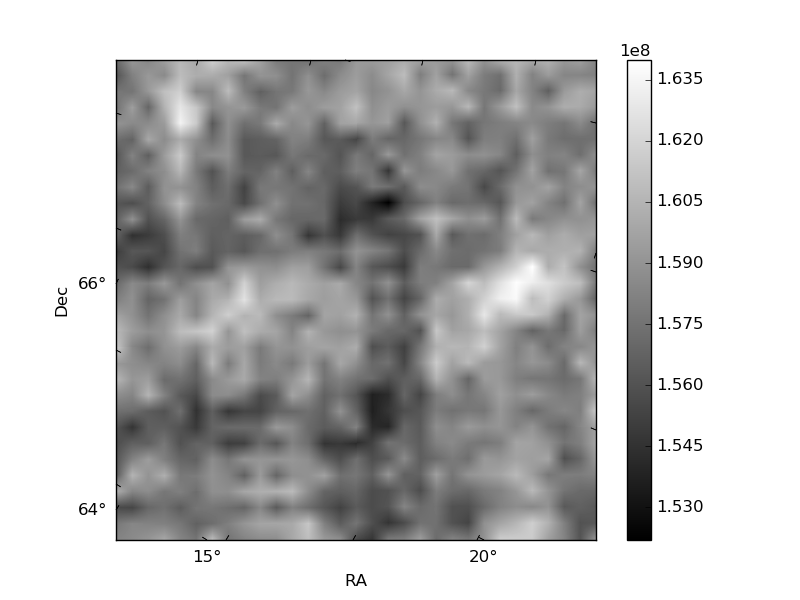
Quadrant B |
|---|---|---|---|
| Quadrant D |  |
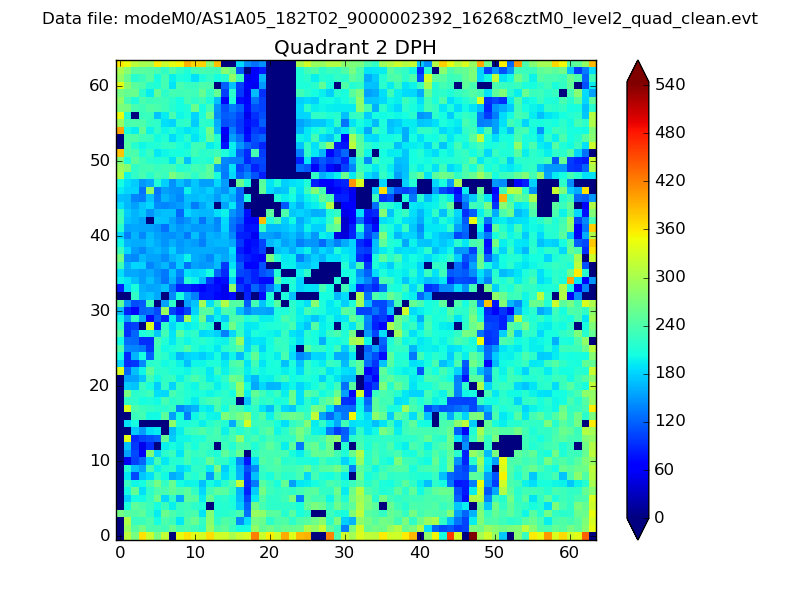 |
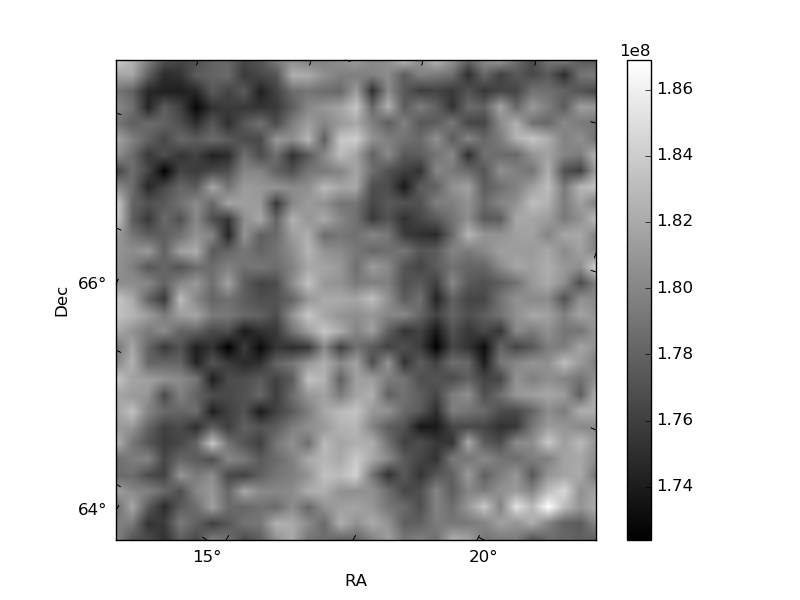
Quadrant C |
| Plot type | Count rate plots | Images |
|---|---|---|
| Comparison with Poisson distribution Blue bars denote a histogram of data divided into 1 sec bins. Red curve is a Poisson curve with rate = median count rate of data. |
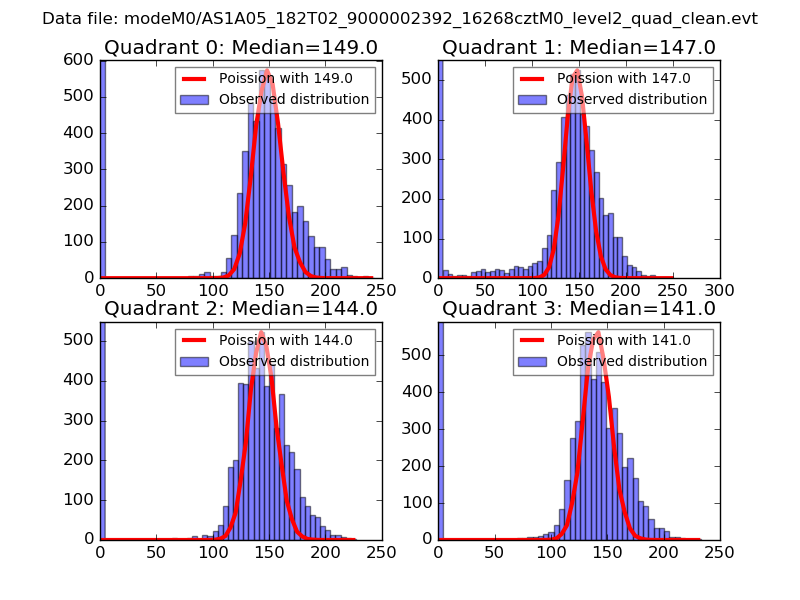 |
 |
| Quadrant-wise count rates Data is divided into 100 sec bins |
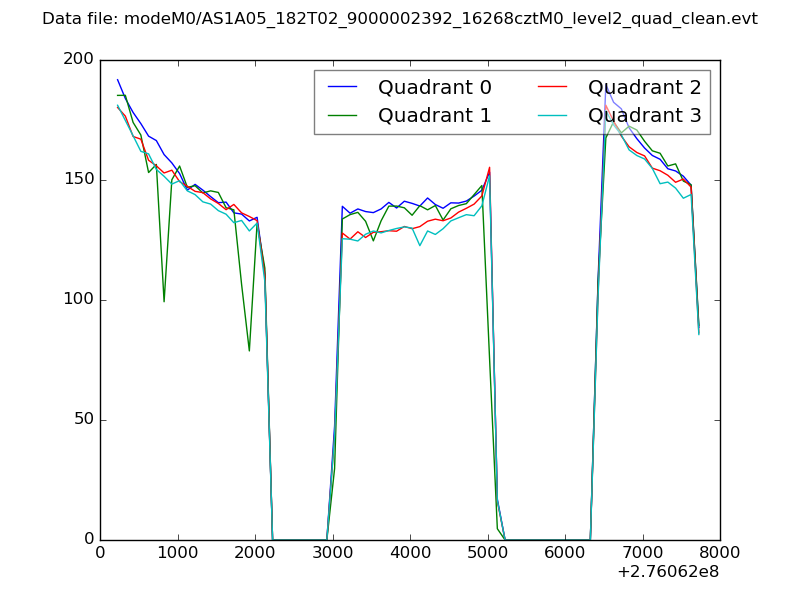 |
|
| Module-wise count rates for Quadrant A Data is divided into 100 sec bins |
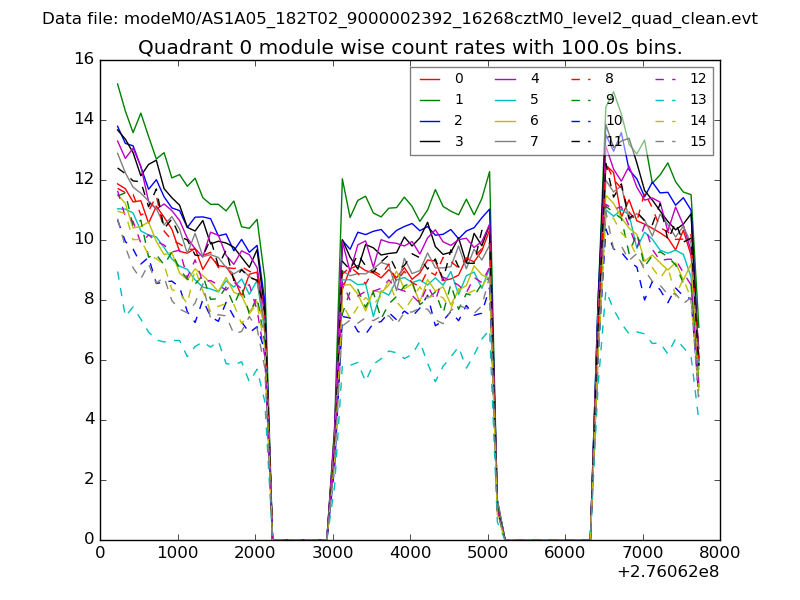 |
 |
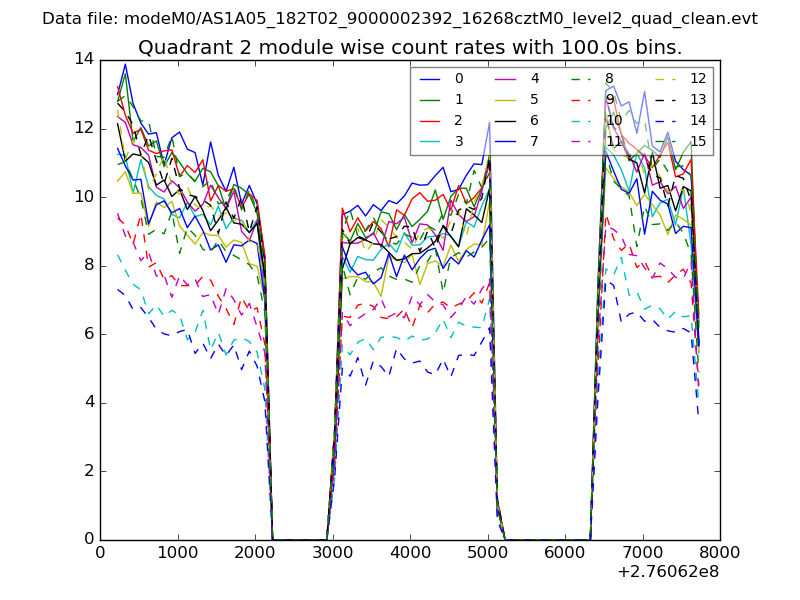
| Module-wise count rates for Quadrant B Data is divided into 100 sec bins |
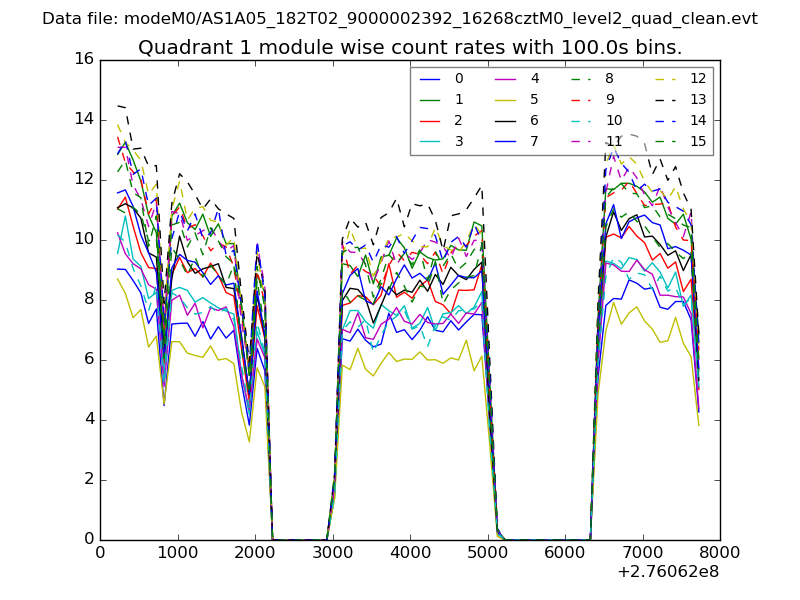 |
 |
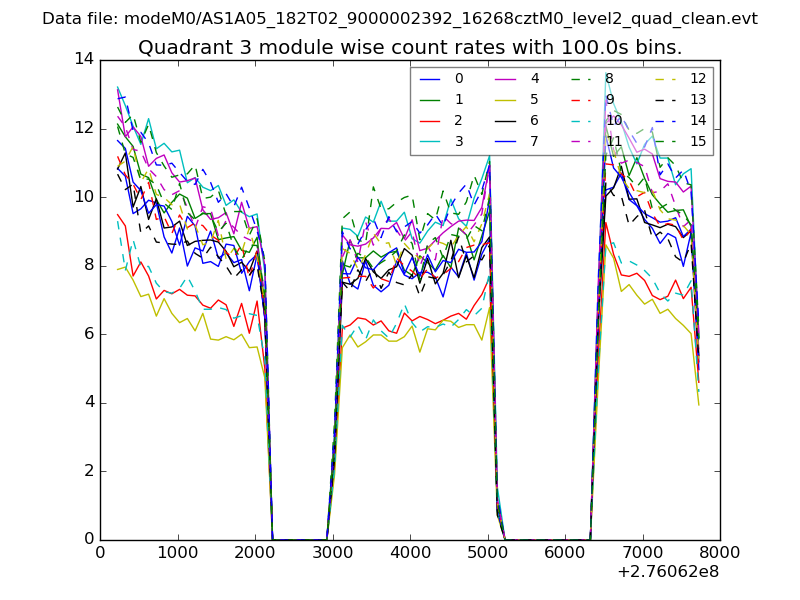
| Module-wise count rates for Quadrant C Data is divided into 100 sec bins |
 |
 |
| Module-wise count rates for Quadrant D Data is divided into 100 sec bins |
 |
 |
| Parameter | Plot |
|---|---|
| CZT HV Monitor | 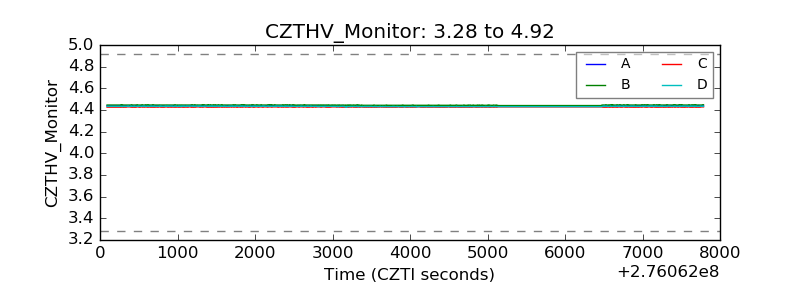 |
| D_VDD | 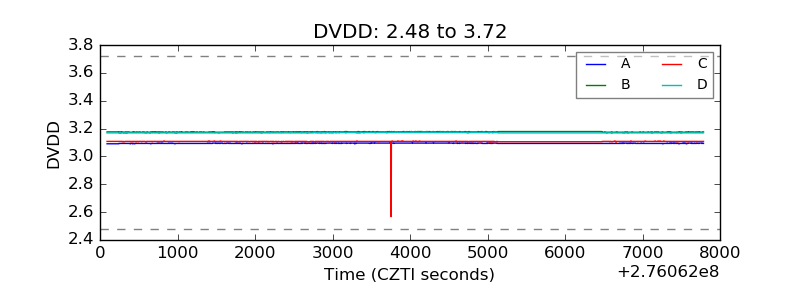 |
| Temperature 1 | 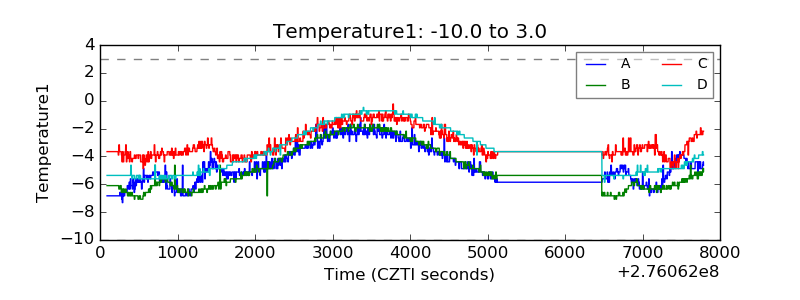 |
| Veto HV Monitor | 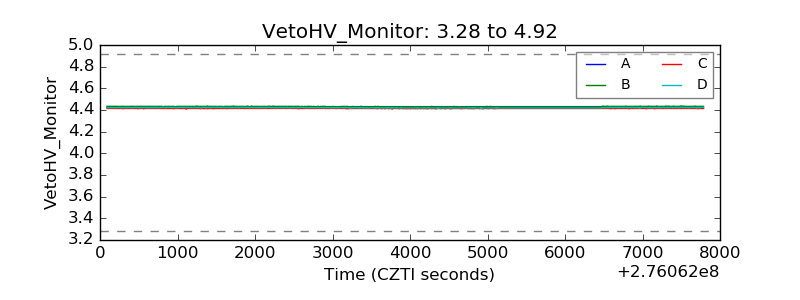 |
| Veto LLD |  |
| Alpha Counter | 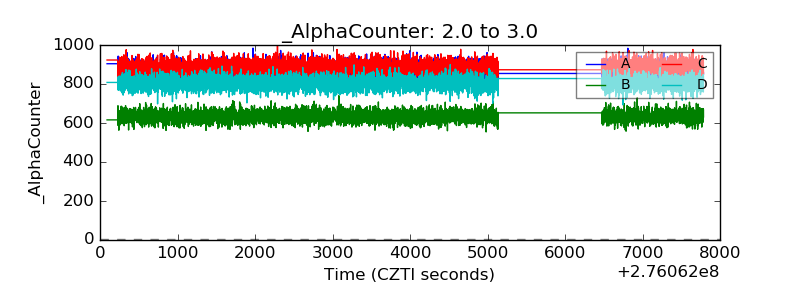 |
| _CPM_Rate | 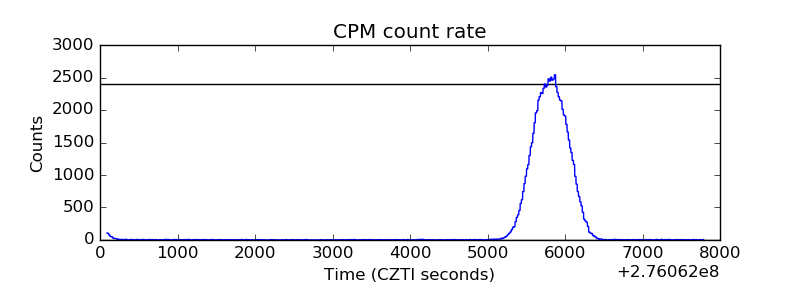 |
| CZT Counter | 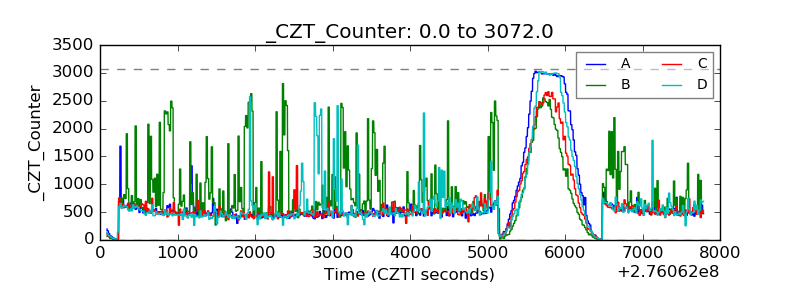 |
| +2.5 Volts monitor |  |
| +5 Volts monitor | 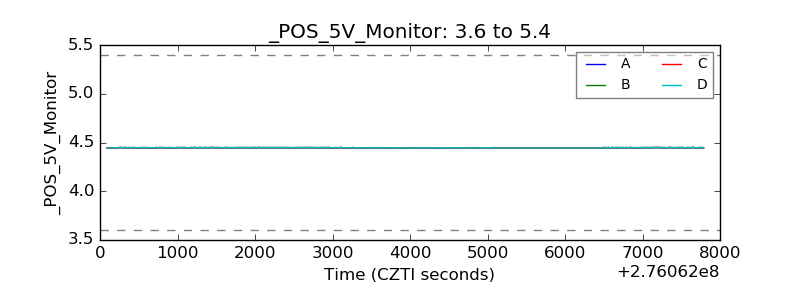 |
| _ROLL_ROT | 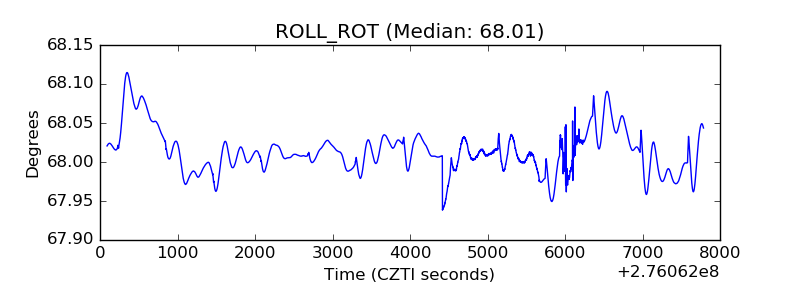 |
| _Roll_DEC | 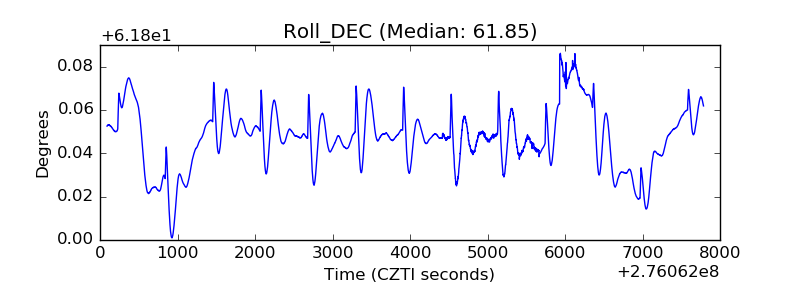 |
| _Roll_RA | 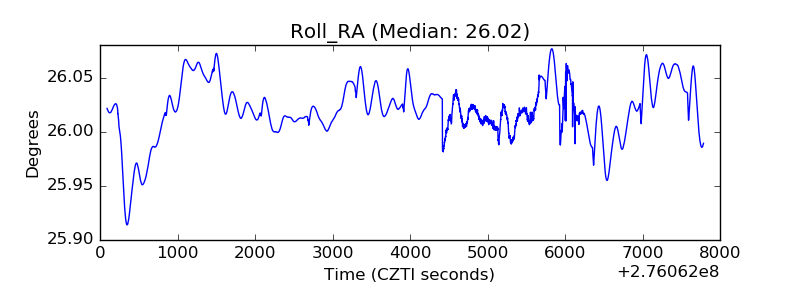 |
| Veto Counter | 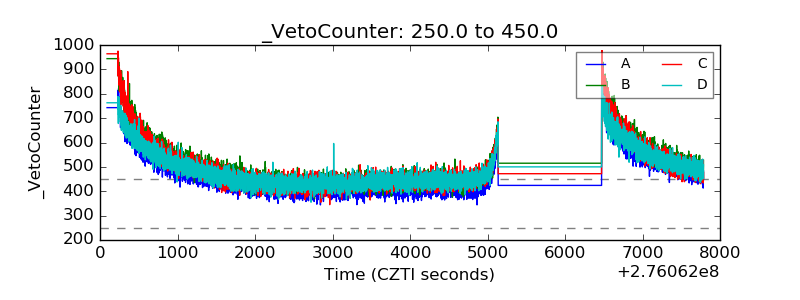 |