| Param | Original file | Final file |
|---|---|---|
| Filename | modeM0/AS1A05_182T02_9000002392_16269cztM0_level2.evt | modeM0/AS1A05_182T02_9000002392_16269cztM0_level2_quad_clean.evt |
| Size (bytes) | 486,172,800 | 101,036,160 |
| Size | 463.7 MB | 96.4 MB |
| Events in quadrant A | 3,038,433 | 694,552 |
| Events in quadrant B | 5,429,152 | 648,667 |
| Events in quadrant C | 2,864,650 | 666,116 |
| Events in quadrant D | 3,011,596 | 658,839 |
| Mode M0 | |||
|---|---|---|---|
| Quadrant | BADHDUFLAG | Total packets | Discarded packets |
| A | 0 | 12327 | 2 |
| B | 0 | 19809 | 1 |
| C | 0 | 11755 | 1 |
| D | 0 | 12438 | 1 |
| Mode SS | |||
|---|---|---|---|
| Quadrant | BADHDUFLAG | Total packets | Discarded packets |
| A | 0 | 112 | 0 |
| B | 0 | 112 | 0 |
| C | 0 | 112 | 0 |
| D | 0 | 112 | 0 |
| Mode M9 | |||
|---|---|---|---|
| Quadrant | BADHDUFLAG | Total packets | Discarded packets |
| A | 0 | 14 | 0 |
| B | 0 | 14 | 0 |
| C | 0 | 14 | 0 |
| D | 0 | 14 | 0 |
| Quadrant | Total seconds | Saturated seconds | Saturation percentage |
|---|---|---|---|
| A | 5603 | 49 | 0.874532% |
| B | 5603 | 858 | 15.313225% |
| C | 5603 | 70 | 1.249331% |
| D | 5603 | 41 | 0.731751% |
Noise dominated data is calculated using 1-second bins in cleaned event files. If a bin has >2000 counts, and if more than 50% of those come from <1% of pixels, then it is considered to be noise-dominated and hence unusable.
| Quadrant | # 1 sec bins | Bins with >0 counts | Bins with >2000 counts | High rate bins dominated by noise | Noise dominated (total time) | Noise dominated (detector-on time) | Marked lightcurve |
|---|---|---|---|---|---|---|---|
| A | 6964 | 5605 | 5 | 5 | 0.07% | 0.09% | 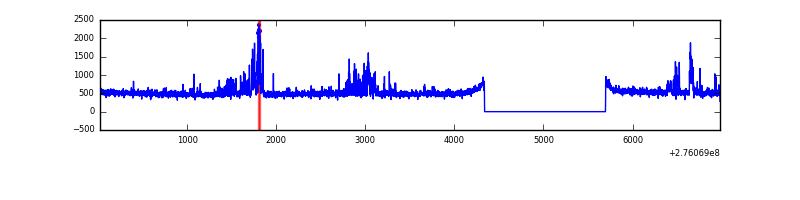 |
| B | 6964 | 5605 | 518 | 518 | 7.44% | 9.24% | 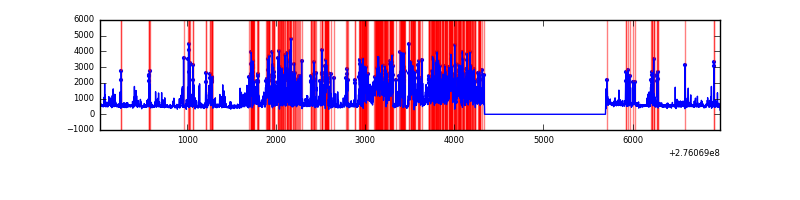 |
| C | 6964 | 5605 | 0 | 0 | 0.00% | 0.00% | 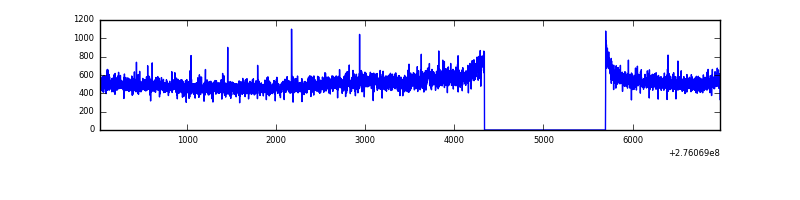 |
| D | 6964 | 5605 | 17 | 17 | 0.24% | 0.30% | 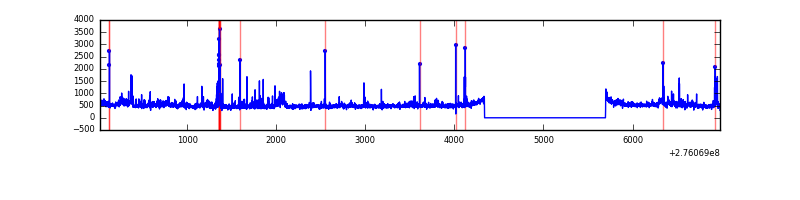 |
Top three noisy pixels from each quadrant. If the there are fewer than three noisy pixels in the level2.evt file, extra rows are filled as -1
| Pixel properties | Quadrant properties | ||||||
|---|---|---|---|---|---|---|---|
| Quadrant | DetID | PixID | Counts | Sigma | Mean | Median | Sigma |
| A | 15 | 174 | 173162 | 1208.0 | 723 | 711 | 142.8 |
| A | 9 | 143 | 83212 | 577.91 | 723 | 711 | 142.8 |
| A | 0 | 226 | 6605 | 41.29 | 723 | 711 | 142.8 |
| B | 3 | 112 | 2632830 | 20925.11 | 677 | 662 | 125.8 |
| B | 0 | 198 | 44076 | 345.13 | 677 | 662 | 125.8 |
| B | 0 | 189 | 37876 | 295.84 | 677 | 662 | 125.8 |
| C | 14 | 238 | 111068 | 707.03 | 679 | 684 | 156.1 |
| C | 3 | 233 | 102630 | 652.99 | 679 | 684 | 156.1 |
| C | 13 | 61 | 5010 | 27.71 | 679 | 684 | 156.1 |
| D | 1 | 52 | 252438 | 1507.77 | 695 | 675 | 167.0 |
| D | 10 | 70 | 89961 | 534.72 | 695 | 675 | 167.0 |
| D | 2 | 120 | 29830 | 174.6 | 695 | 675 | 167.0 |
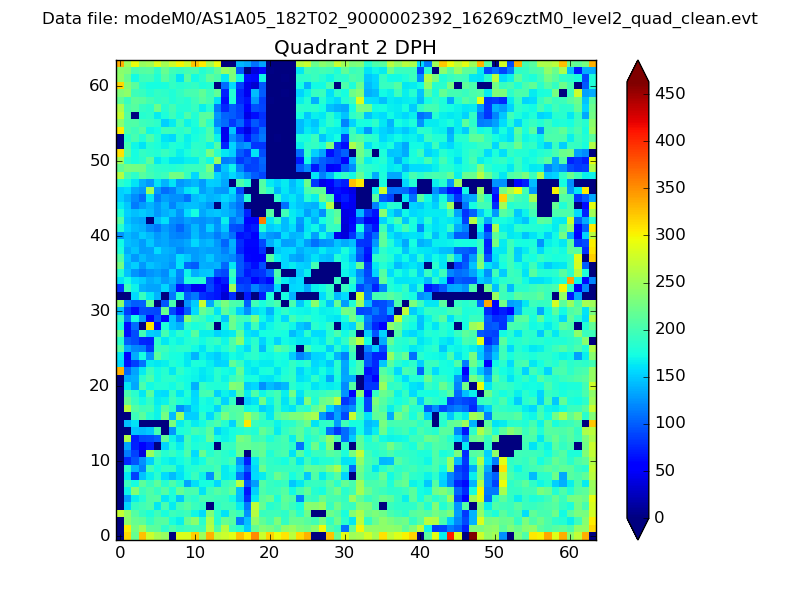
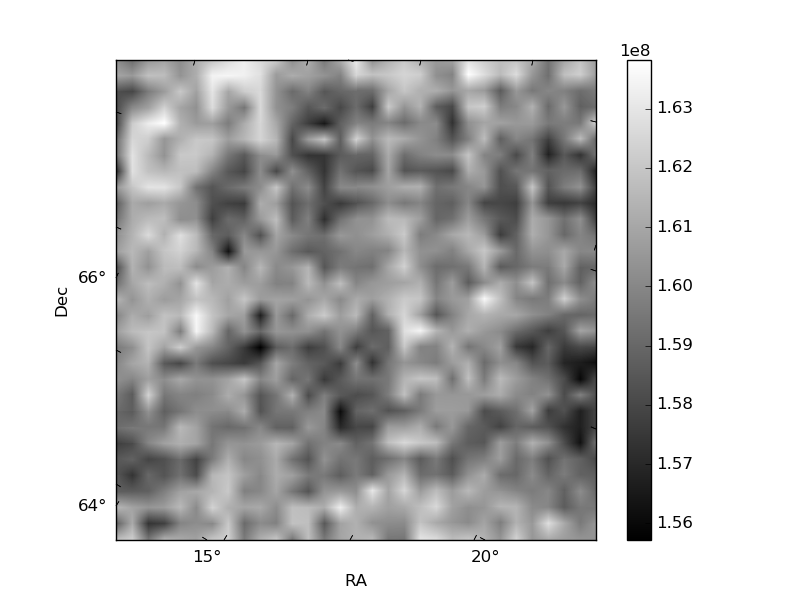
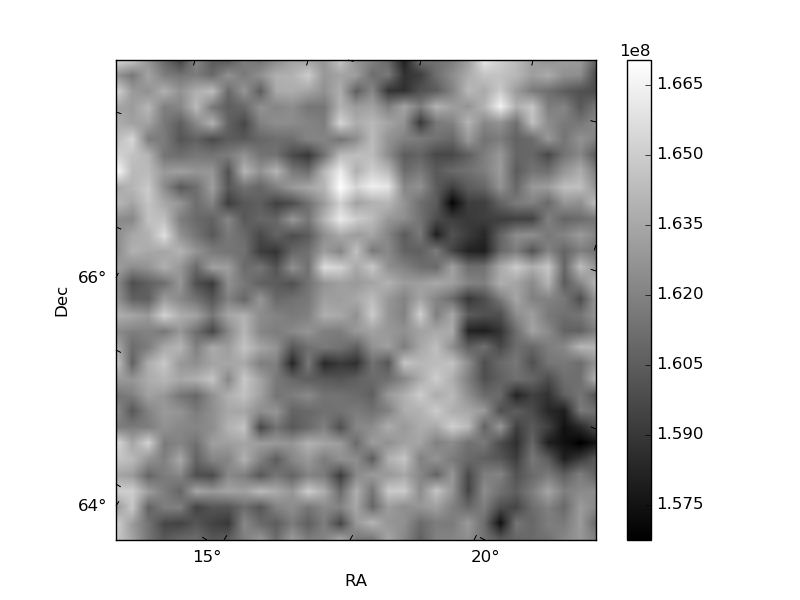
Histogram calculated using DETX and DETY for each event in the final _common_clean file
| Quadrant A | 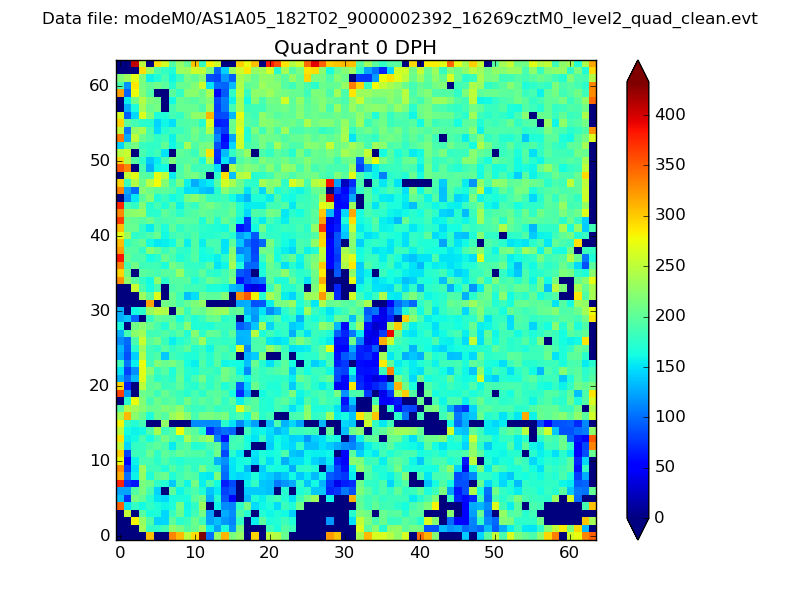 |
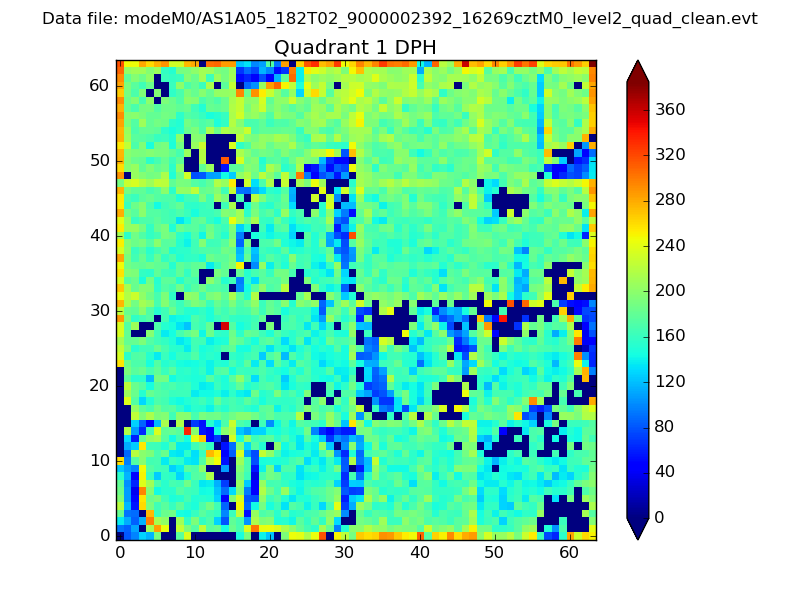 |
Quadrant B |
|---|---|---|---|
| Quadrant D | 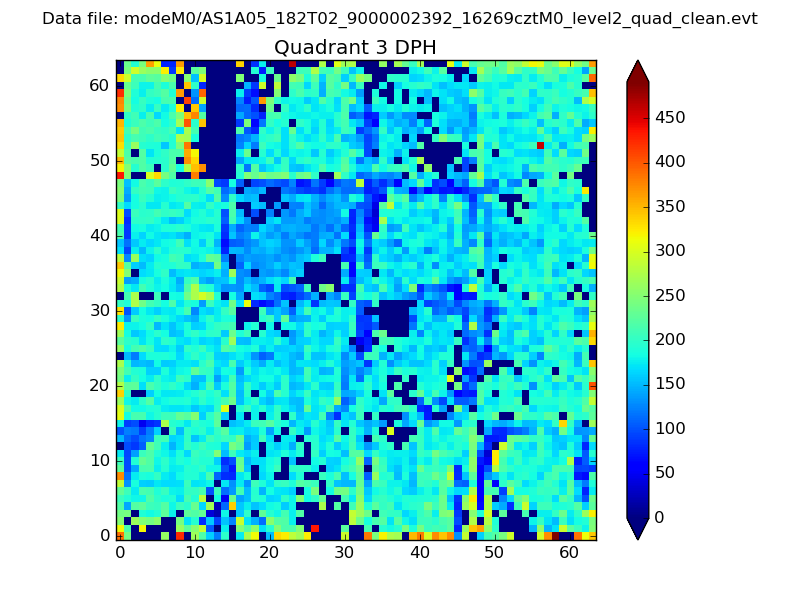 |
 |
Quadrant C |
| Plot type | Count rate plots | Images |
|---|---|---|
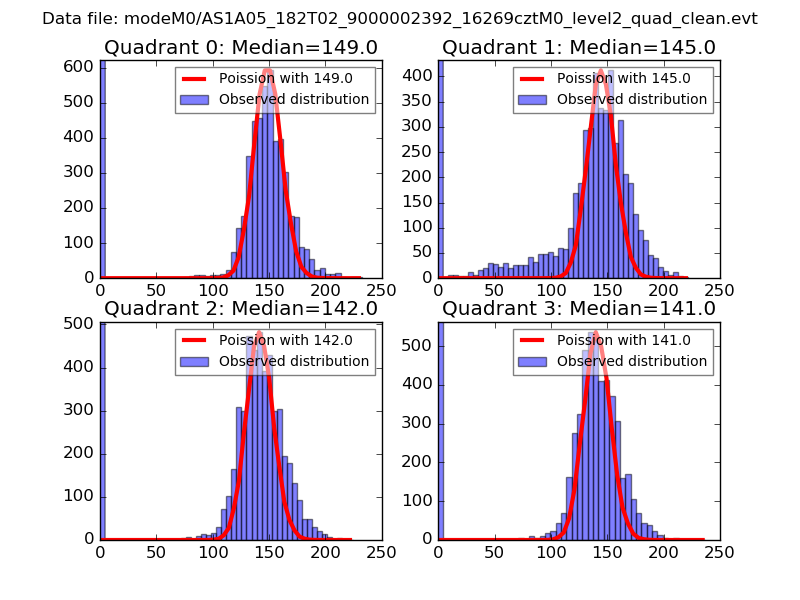
| Comparison with Poisson distribution Blue bars denote a histogram of data divided into 1 sec bins. Red curve is a Poisson curve with rate = median count rate of data. |
 |
 |
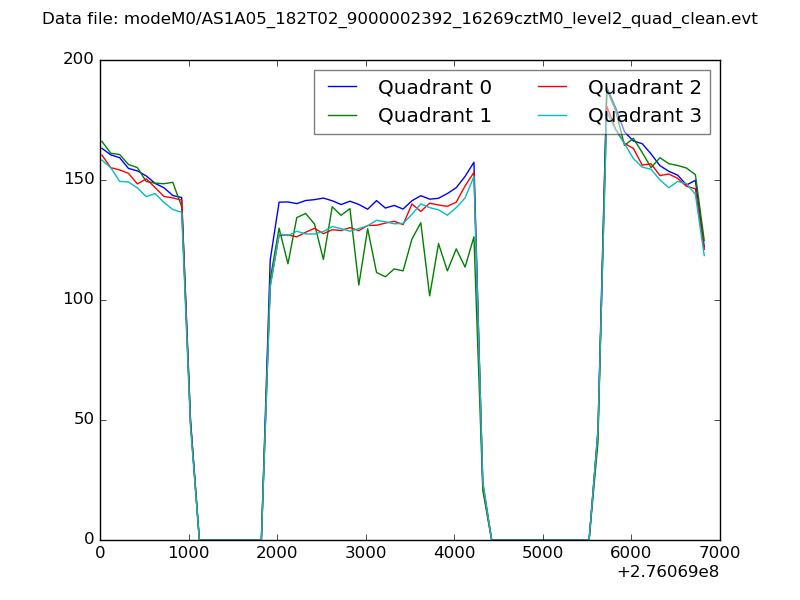
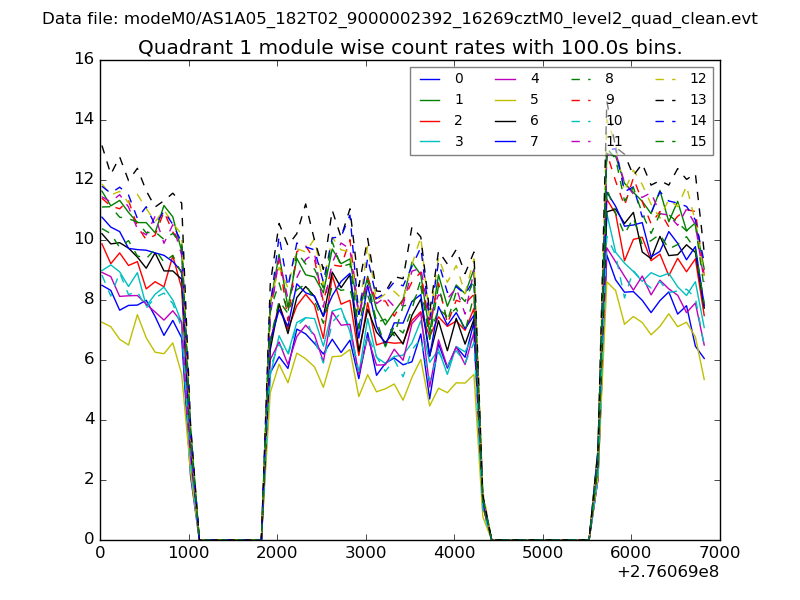
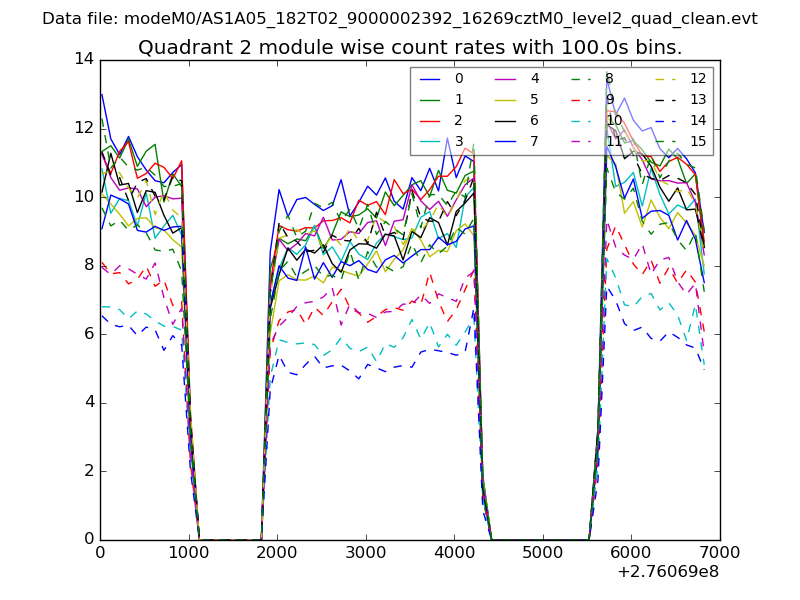
| Quadrant-wise count rates Data is divided into 100 sec bins |
 |
|
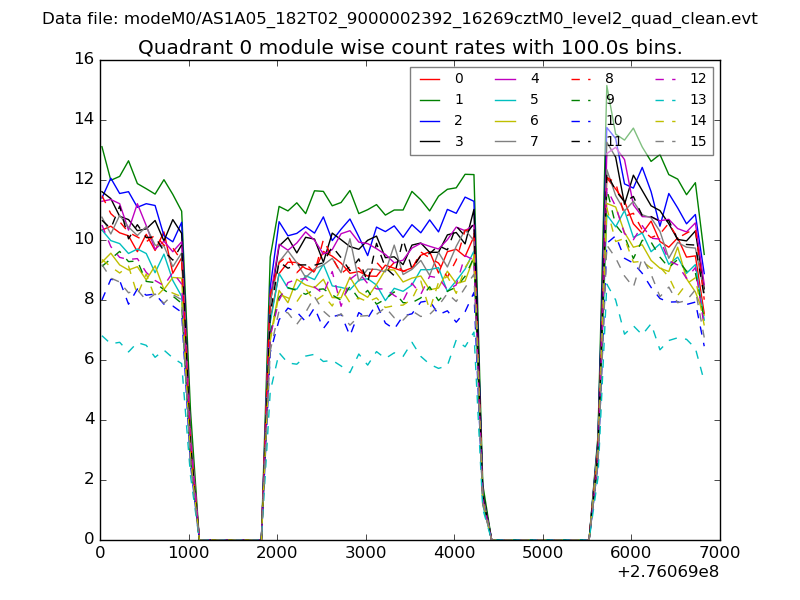
| Module-wise count rates for Quadrant A Data is divided into 100 sec bins |
 |
 |
| Module-wise count rates for Quadrant B Data is divided into 100 sec bins |
 |
 |
| Module-wise count rates for Quadrant C Data is divided into 100 sec bins |
 |
 |
| Module-wise count rates for Quadrant D Data is divided into 100 sec bins |
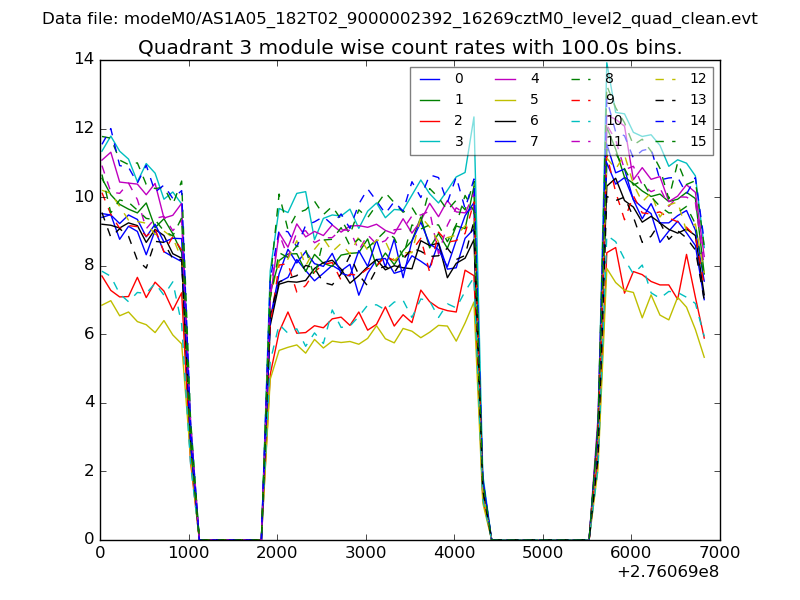 |
 |
| Parameter | Plot |
|---|---|
| CZT HV Monitor | 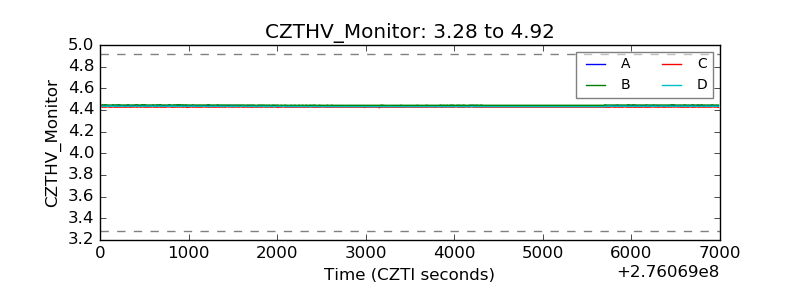 |
| D_VDD | 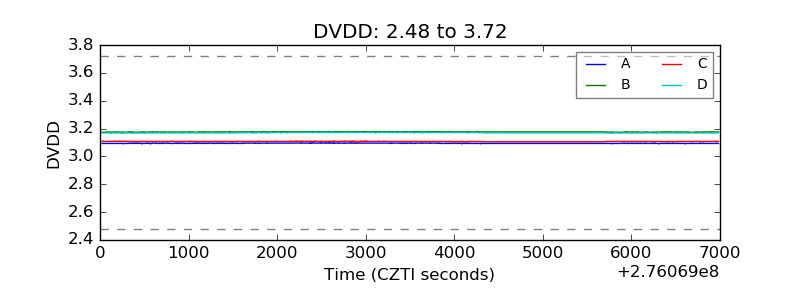 |
| Temperature 1 | 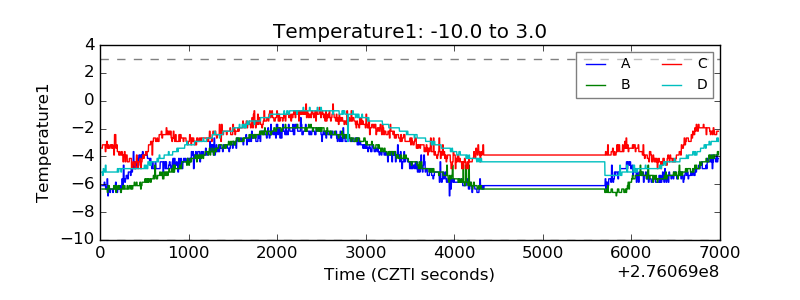 |
| Veto HV Monitor | 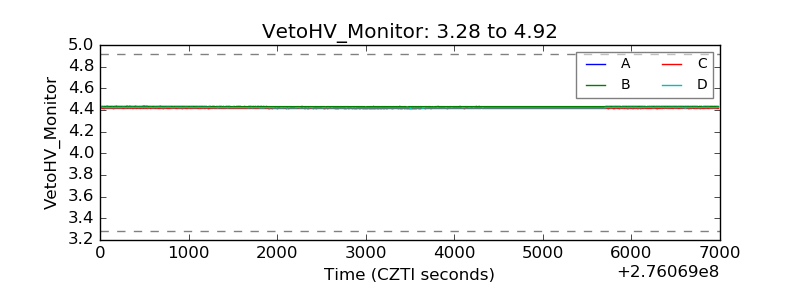 |
| Veto LLD | 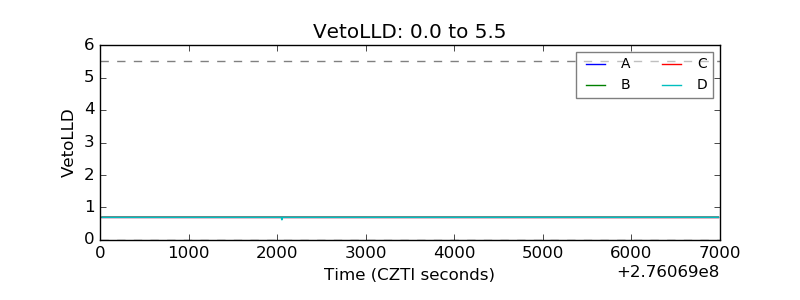 |
| Alpha Counter |  |
| _CPM_Rate | 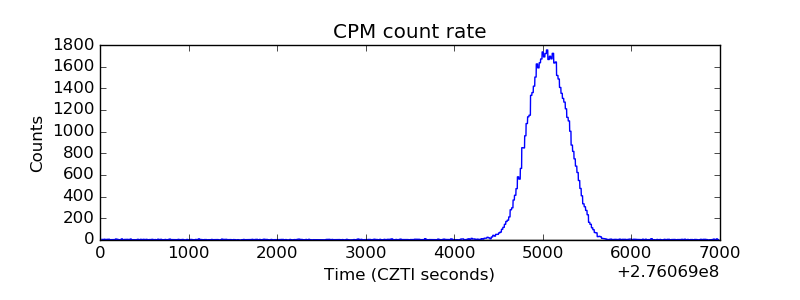 |
| CZT Counter |  |
| +2.5 Volts monitor |  |
| +5 Volts monitor |  |
| _ROLL_ROT | 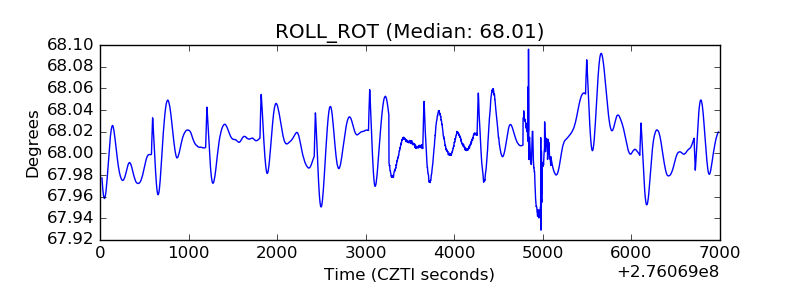 |
| _Roll_DEC | 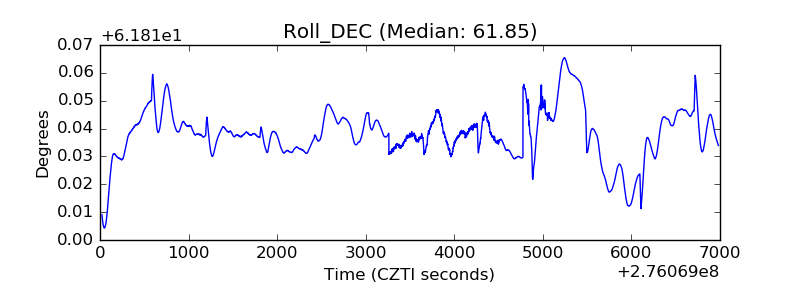 |
| _Roll_RA |  |
| Veto Counter | 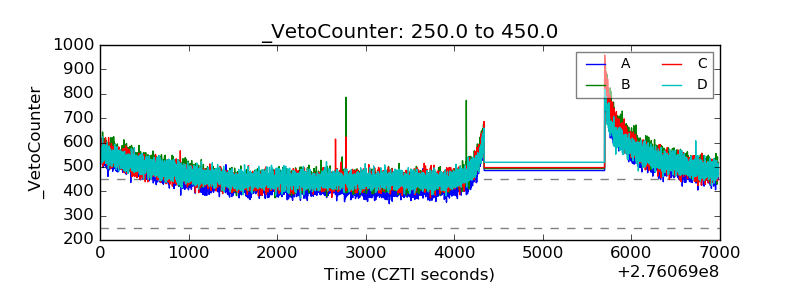 |