| Param | Original file | Final file |
|---|---|---|
| Filename | modeM0/AS1A05_182T02_9000002392_16270cztM0_level2.evt | modeM0/AS1A05_182T02_9000002392_16270cztM0_level2_quad_clean.evt |
| Size (bytes) | 507,168,000 | 101,102,400 |
| Size | 483.7 MB | 96.4 MB |
| Events in quadrant A | 3,259,819 | 675,642 |
| Events in quadrant B | 5,078,094 | 662,449 |
| Events in quadrant C | 3,110,448 | 653,368 |
| Events in quadrant D | 3,498,147 | 645,221 |
| Mode M0 | |||
|---|---|---|---|
| Quadrant | BADHDUFLAG | Total packets | Discarded packets |
| A | 0 | 13310 | 2 |
| B | 0 | 19037 | 1 |
| C | 0 | 12747 | 1 |
| D | 0 | 14214 | 1 |
| Mode SS | |||
|---|---|---|---|
| Quadrant | BADHDUFLAG | Total packets | Discarded packets |
| A | 0 | 124 | 0 |
| B | 0 | 124 | 0 |
| C | 0 | 124 | 0 |
| D | 0 | 124 | 0 |
| Mode M9 | |||
|---|---|---|---|
| Quadrant | BADHDUFLAG | Total packets | Discarded packets |
| A | 0 | 13 | 0 |
| B | 0 | 13 | 0 |
| C | 0 | 13 | 0 |
| D | 0 | 13 | 0 |
| Quadrant | Total seconds | Saturated seconds | Saturation percentage |
|---|---|---|---|
| A | 6087 | 124 | 2.037128% |
| B | 6087 | 609 | 10.004929% |
| C | 6087 | 126 | 2.069985% |
| D | 6087 | 101 | 1.659274% |
Noise dominated data is calculated using 1-second bins in cleaned event files. If a bin has >2000 counts, and if more than 50% of those come from <1% of pixels, then it is considered to be noise-dominated and hence unusable.
| Quadrant | # 1 sec bins | Bins with >0 counts | Bins with >2000 counts | High rate bins dominated by noise | Noise dominated (total time) | Noise dominated (detector-on time) | Marked lightcurve |
|---|---|---|---|---|---|---|---|
| A | 7363 | 6089 | 11 | 11 | 0.15% | 0.18% | 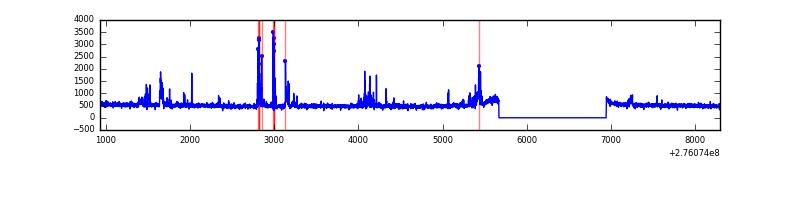 |
| B | 7363 | 6089 | 329 | 329 | 4.47% | 5.40% | 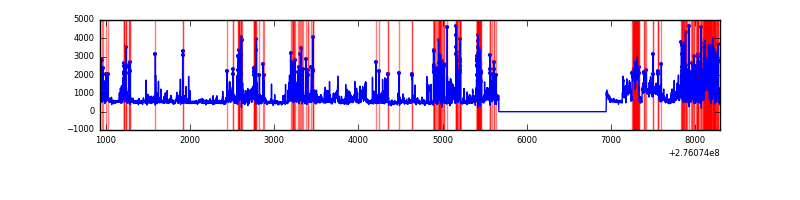 |
| C | 7363 | 6089 | 0 | 0 | 0.00% | 0.00% | 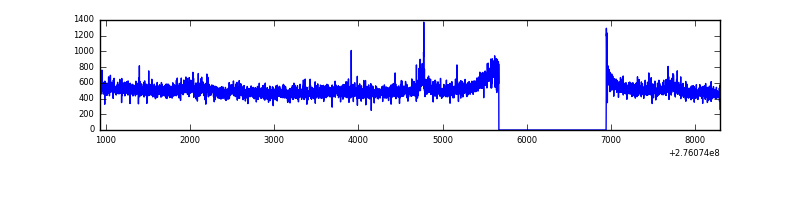 |
| D | 7363 | 6089 | 24 | 24 | 0.33% | 0.39% | 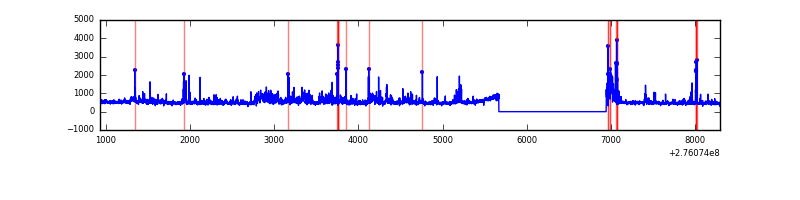 |
Top three noisy pixels from each quadrant. If the there are fewer than three noisy pixels in the level2.evt file, extra rows are filled as -1
| Pixel properties | Quadrant properties | ||||||
|---|---|---|---|---|---|---|---|
| Quadrant | DetID | PixID | Counts | Sigma | Mean | Median | Sigma |
| A | 9 | 143 | 167459 | 1074.39 | 780 | 765 | 155.2 |
| A | 15 | 174 | 92164 | 589.09 | 780 | 765 | 155.2 |
| A | 0 | 226 | 7017 | 40.29 | 780 | 765 | 155.2 |
| B | 3 | 112 | 1856409 | 13391.35 | 747 | 730 | 138.6 |
| B | 4 | 216 | 112059 | 803.4 | 747 | 730 | 138.6 |
| B | 0 | 189 | 62699 | 447.19 | 747 | 730 | 138.6 |
| C | 14 | 238 | 119033 | 701.16 | 734 | 738 | 168.7 |
| C | 3 | 233 | 118314 | 696.9 | 734 | 738 | 168.7 |
| C | 7 | 247 | 7689 | 41.2 | 734 | 738 | 168.7 |
| D | 1 | 52 | 449746 | 2511.77 | 751 | 731 | 178.8 |
| D | 10 | 70 | 172775 | 962.41 | 751 | 731 | 178.8 |
| D | 2 | 234 | 19493 | 104.95 | 751 | 731 | 178.8 |
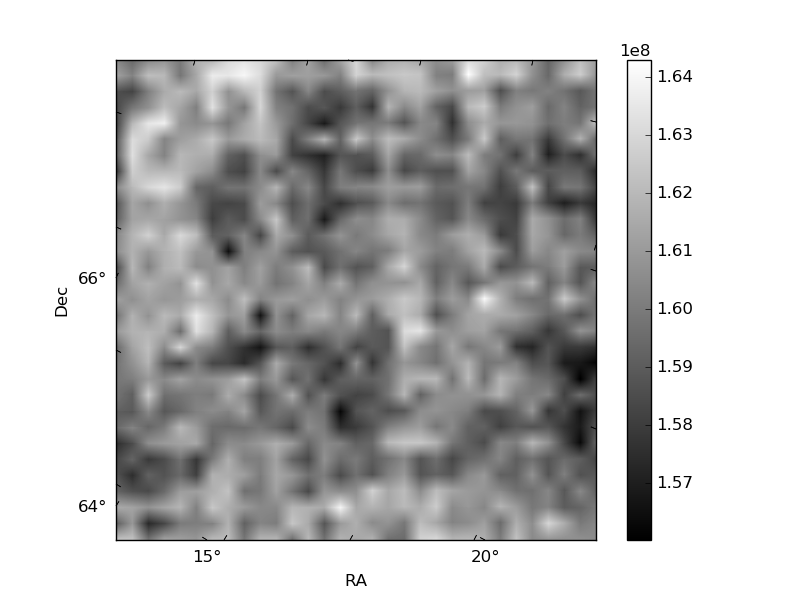
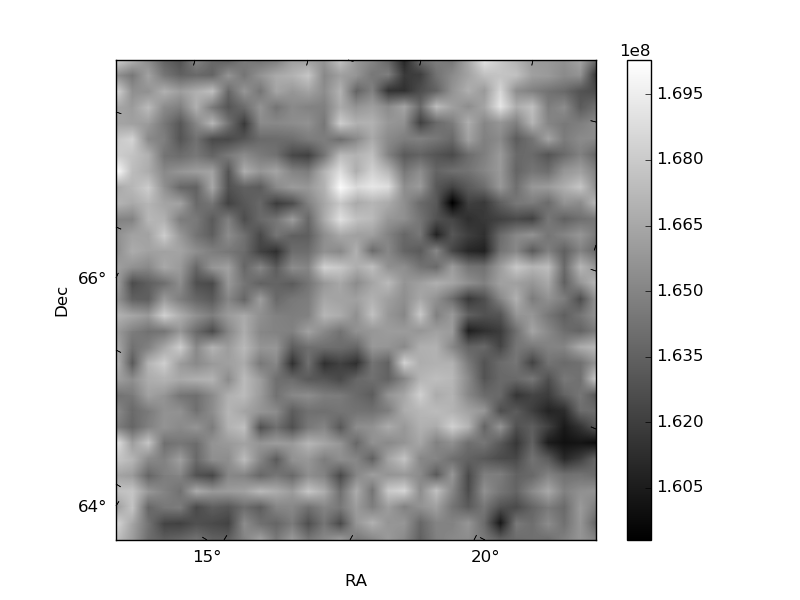
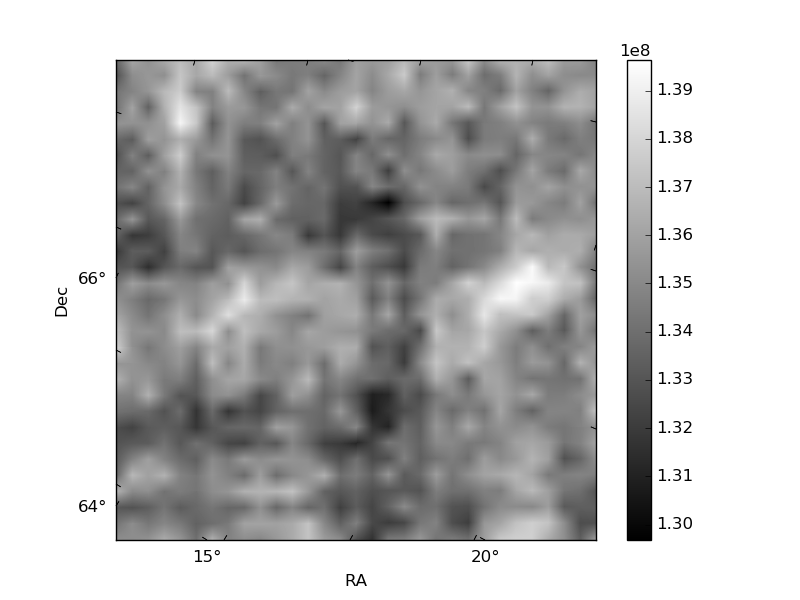
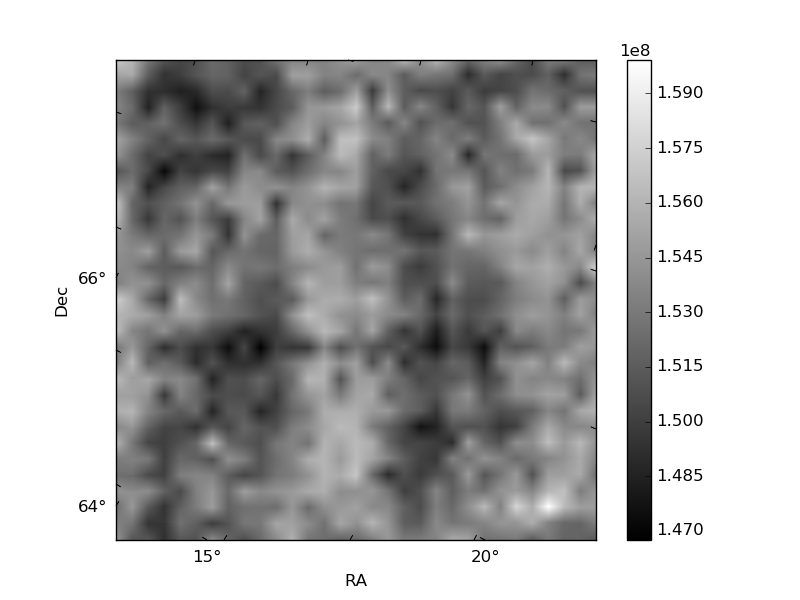
Histogram calculated using DETX and DETY for each event in the final _common_clean file
| Quadrant A | 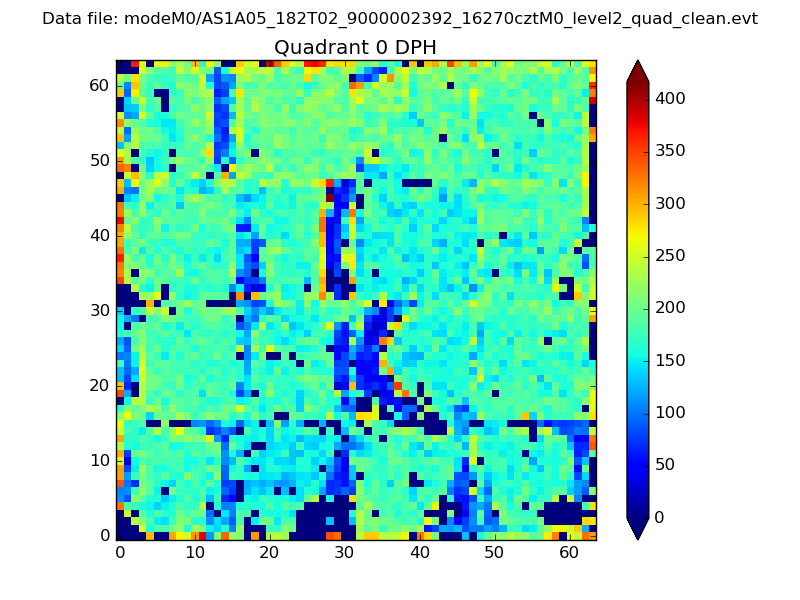 |
 |
Quadrant B |
|---|---|---|---|
| Quadrant D |  |
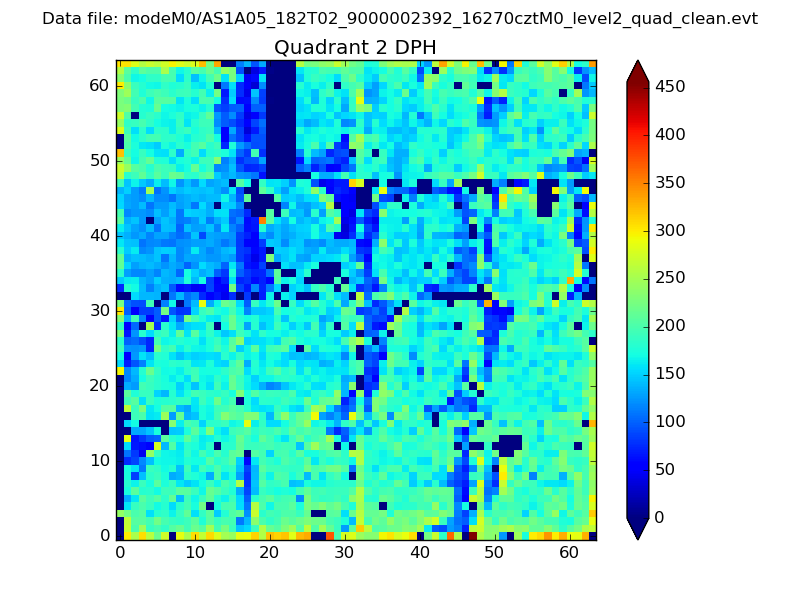 |
Quadrant C |
| Plot type | Count rate plots | Images |
|---|---|---|
| Comparison with Poisson distribution Blue bars denote a histogram of data divided into 1 sec bins. Red curve is a Poisson curve with rate = median count rate of data. |
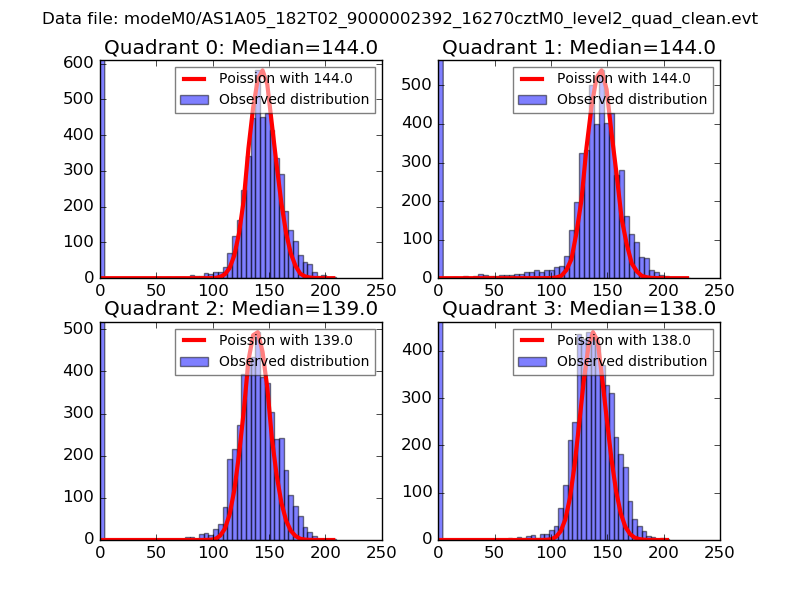 |
 |
| Quadrant-wise count rates Data is divided into 100 sec bins |
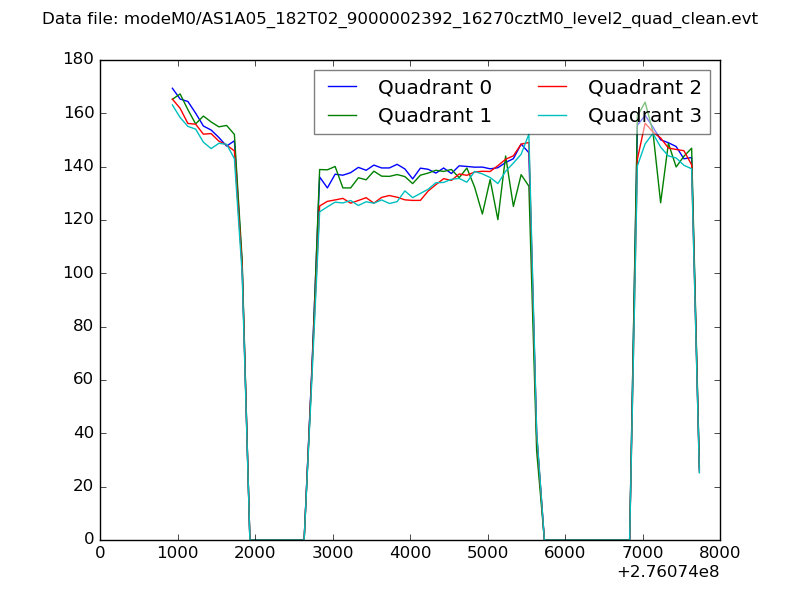 |
|
| Module-wise count rates for Quadrant A Data is divided into 100 sec bins |
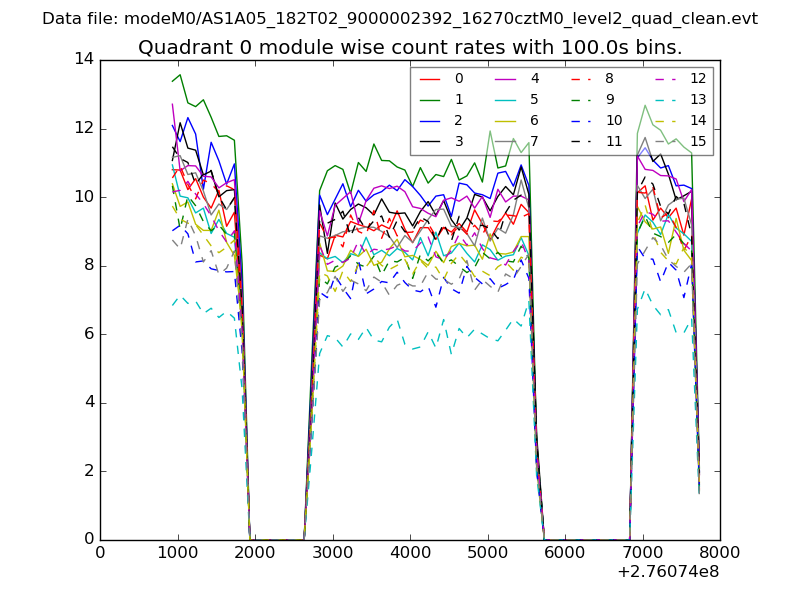 |
 |
| Module-wise count rates for Quadrant B Data is divided into 100 sec bins |
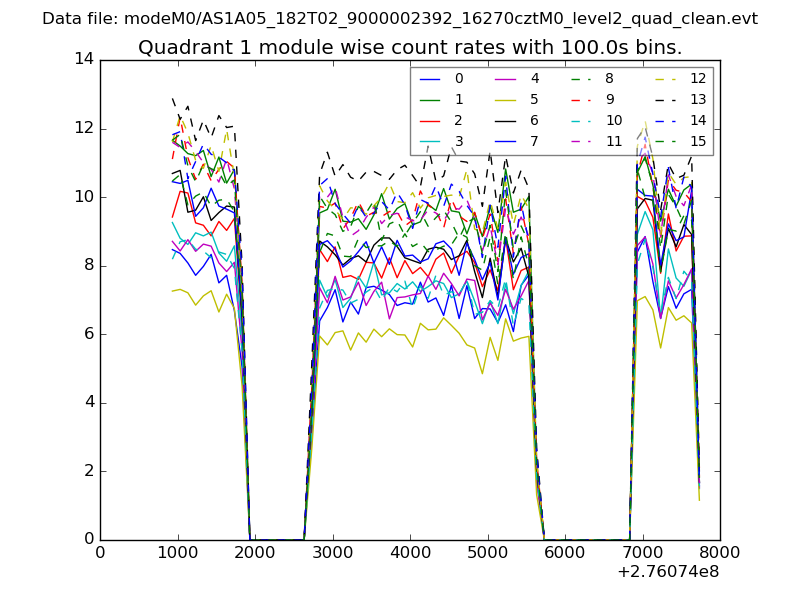 |
 |
| Module-wise count rates for Quadrant C Data is divided into 100 sec bins |
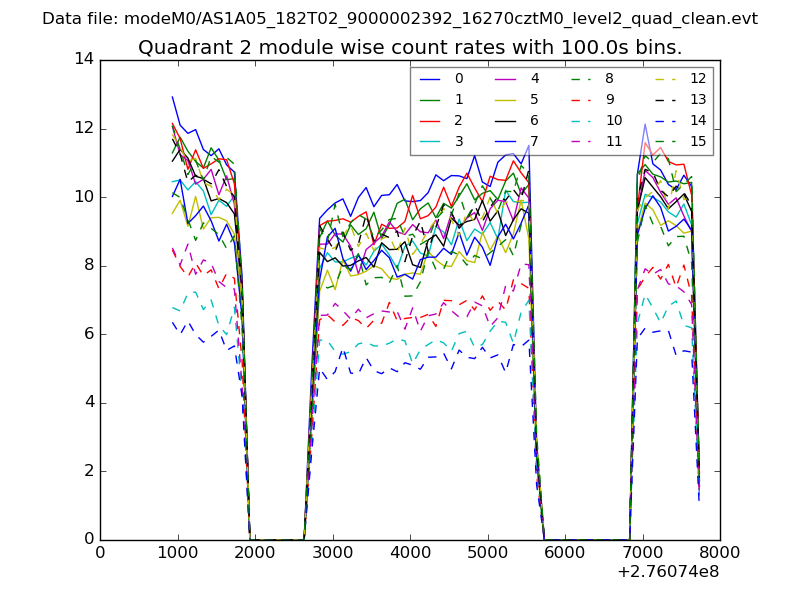 |
 |
| Module-wise count rates for Quadrant D Data is divided into 100 sec bins |
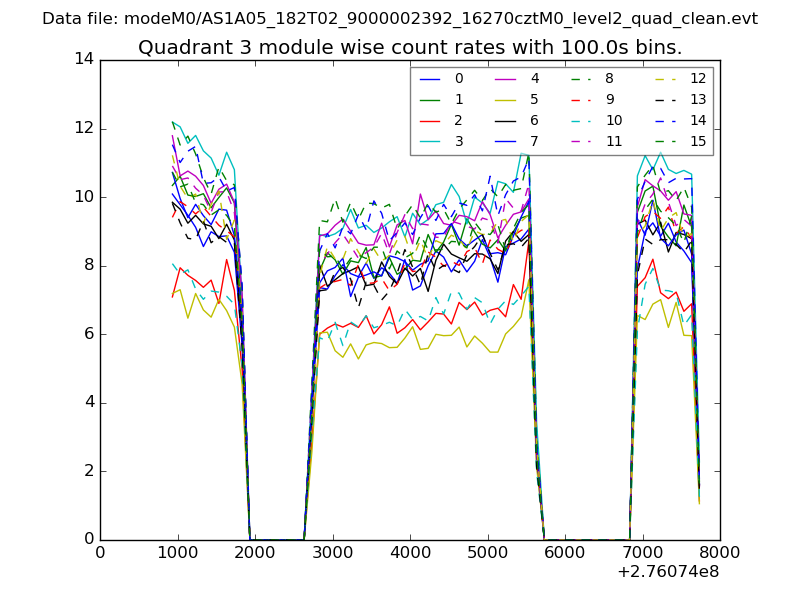 |
 |
| Parameter | Plot |
|---|---|
| CZT HV Monitor | 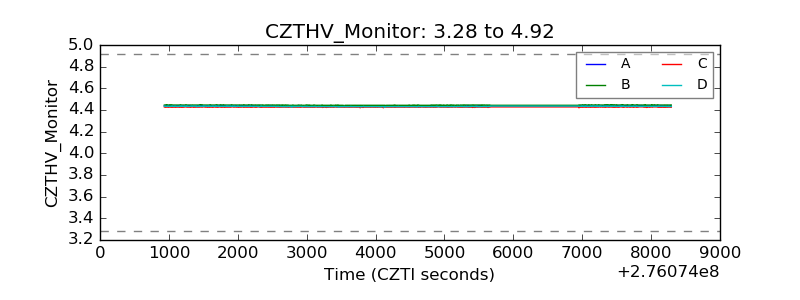 |
| D_VDD | 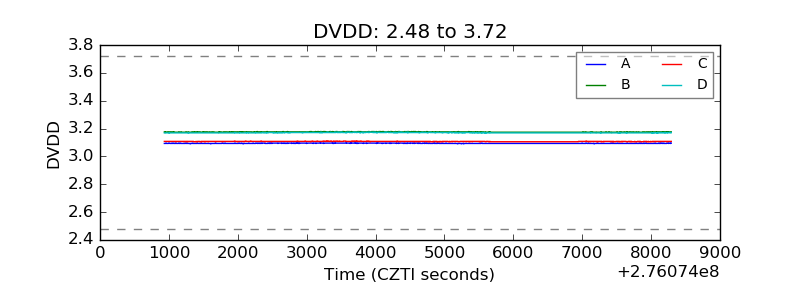 |
| Temperature 1 | 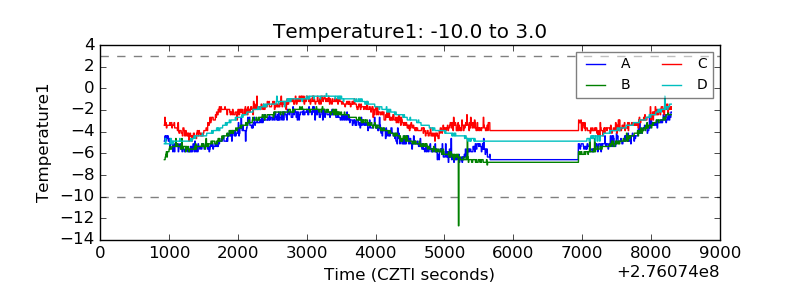 |
| Veto HV Monitor | 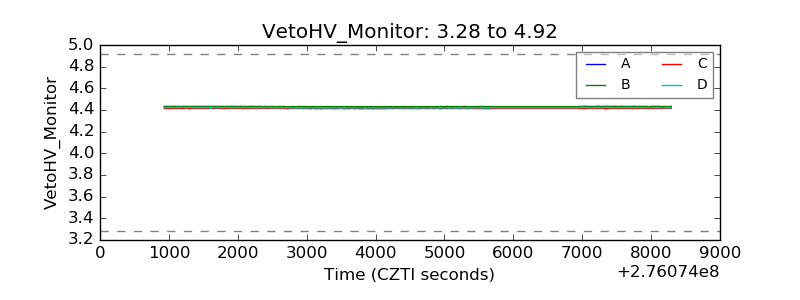 |
| Veto LLD | 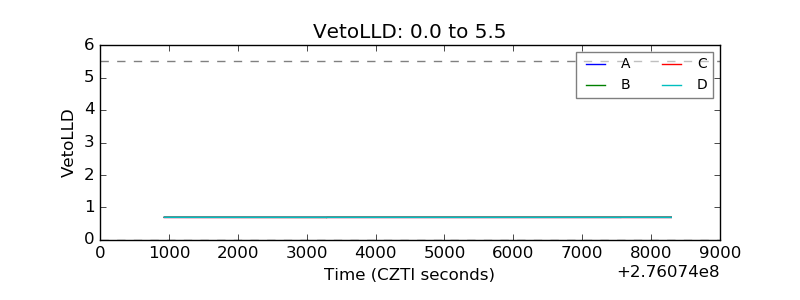 |
| Alpha Counter | 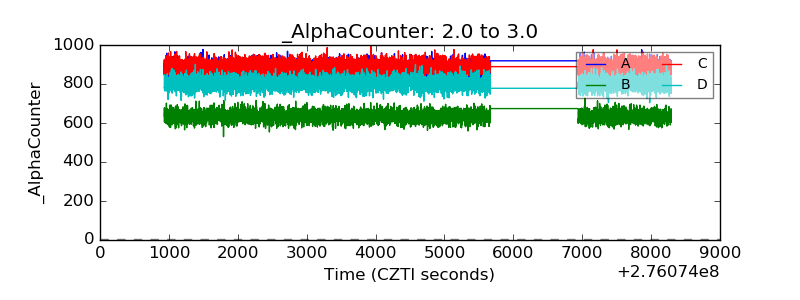 |
| _CPM_Rate | 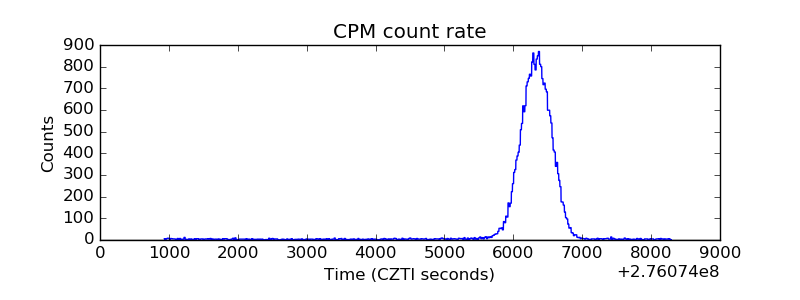 |
| CZT Counter | 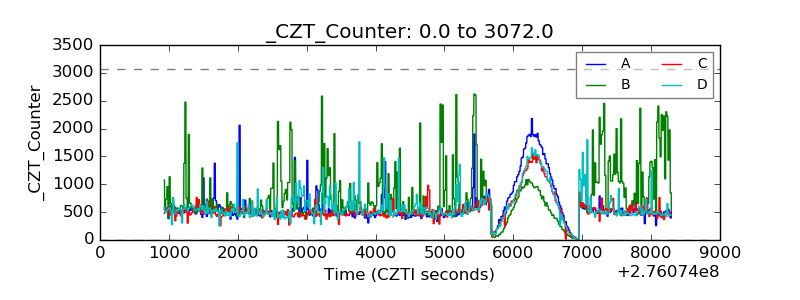 |
| +2.5 Volts monitor |  |
| +5 Volts monitor | 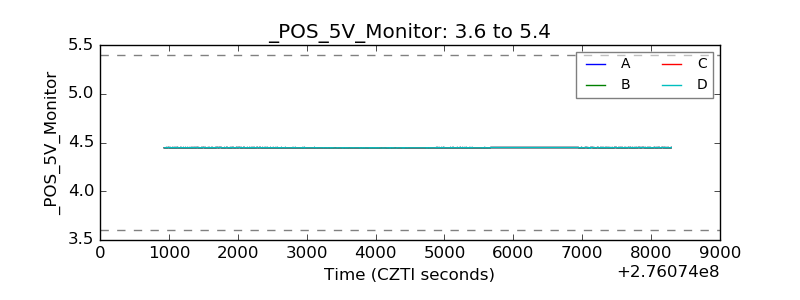 |
| _ROLL_ROT | 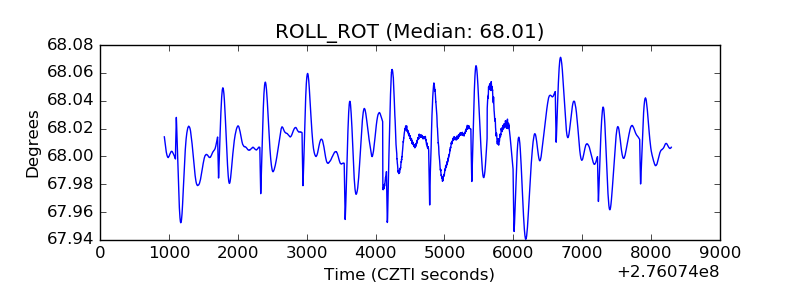 |
| _Roll_DEC | 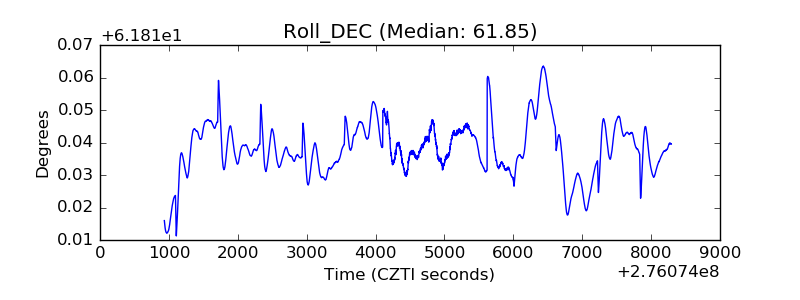 |
| _Roll_RA | 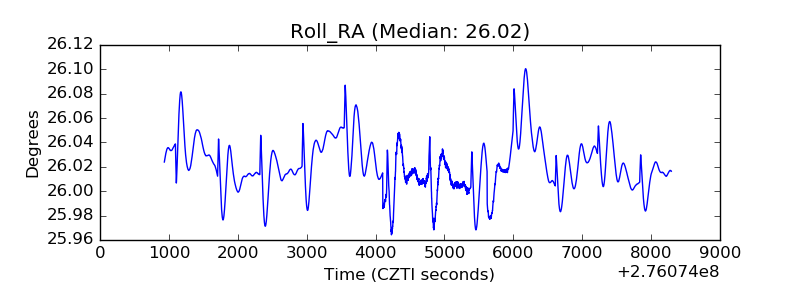 |
| Veto Counter | 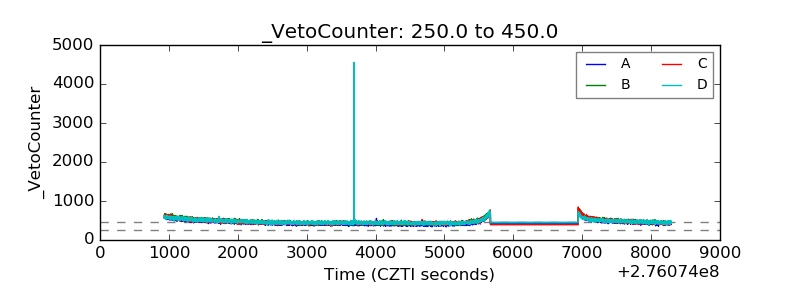 |