| Param | Original file | Final file |
|---|---|---|
| Filename | modeM0/AS1A05_182T02_9000002392_16271cztM0_level2.evt | modeM0/AS1A05_182T02_9000002392_16271cztM0_level2_quad_clean.evt |
| Size (bytes) | 277,928,640 | 44,496,000 |
| Size | 265.1 MB | 42.4 MB |
| Events in quadrant A | 1,459,790 | 300,579 |
| Events in quadrant B | 3,705,332 | 263,867 |
| Events in quadrant C | 1,543,199 | 282,798 |
| Events in quadrant D | 1,500,096 | 282,485 |
| Mode M0 | |||
|---|---|---|---|
| Quadrant | BADHDUFLAG | Total packets | Discarded packets |
| A | 0 | 6168 | 0 |
| B | 0 | 13073 | 0 |
| C | 0 | 6423 | 0 |
| D | 0 | 6456 | 0 |
| Mode SS | |||
|---|---|---|---|
| Quadrant | BADHDUFLAG | Total packets | Discarded packets |
| A | 0 | 62 | 0 |
| B | 0 | 62 | 0 |
| C | 0 | 62 | 0 |
| D | 0 | 62 | 0 |
| Quadrant | Total seconds | Saturated seconds | Saturation percentage |
|---|---|---|---|
| A | 3046 | 5 | 0.164150% |
| B | 3046 | 752 | 24.688116% |
| C | 3046 | 14 | 0.459619% |
| D | 3046 | 7 | 0.229810% |
Noise dominated data is calculated using 1-second bins in cleaned event files. If a bin has >2000 counts, and if more than 50% of those come from <1% of pixels, then it is considered to be noise-dominated and hence unusable.
| Quadrant | # 1 sec bins | Bins with >0 counts | Bins with >2000 counts | High rate bins dominated by noise | Noise dominated (total time) | Noise dominated (detector-on time) | Marked lightcurve |
|---|---|---|---|---|---|---|---|
| A | 3047 | 3047 | 0 | 0 | 0.00% | 0.00% | 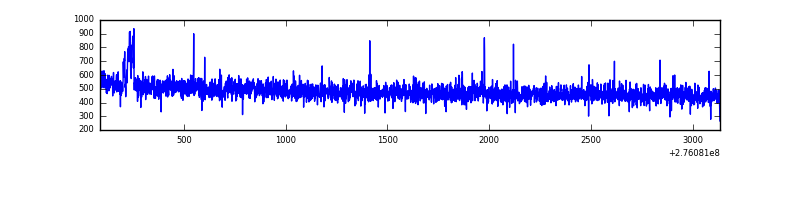 |
| B | 3047 | 3047 | 526 | 526 | 17.26% | 17.26% | 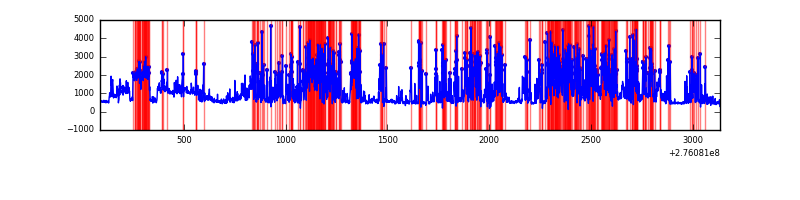 |
| C | 3047 | 3047 | 0 | 0 | 0.00% | 0.00% | 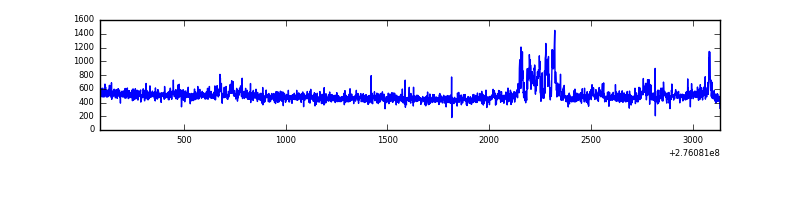 |
| D | 3047 | 3047 | 6 | 6 | 0.20% | 0.20% |  |
Top three noisy pixels from each quadrant. If the there are fewer than three noisy pixels in the level2.evt file, extra rows are filled as -1
| Pixel properties | Quadrant properties | ||||||
|---|---|---|---|---|---|---|---|
| Quadrant | DetID | PixID | Counts | Sigma | Mean | Median | Sigma |
| A | 9 | 143 | 13948 | 179.4 | 374 | 368 | 75.7 |
| A | 15 | 174 | 4686 | 57.04 | 374 | 368 | 75.7 |
| A | 0 | 226 | 3347 | 39.35 | 374 | 368 | 75.7 |
| B | 3 | 112 | 2300804 | 36807.14 | 329 | 322 | 62.5 |
| B | 0 | 198 | 41973 | 666.41 | 329 | 322 | 62.5 |
| B | 3 | 64 | 25565 | 403.88 | 329 | 322 | 62.5 |
| C | 3 | 233 | 125597 | 1551.01 | 348 | 350 | 80.8 |
| C | 14 | 238 | 57040 | 702.03 | 348 | 350 | 80.8 |
| C | 13 | 61 | 2492 | 26.53 | 348 | 350 | 80.8 |
| D | 1 | 52 | 73511 | 832.75 | 359 | 349 | 87.9 |
| D | 10 | 70 | 47354 | 535.02 | 359 | 349 | 87.9 |
| D | 15 | 0 | 23873 | 267.76 | 359 | 349 | 87.9 |
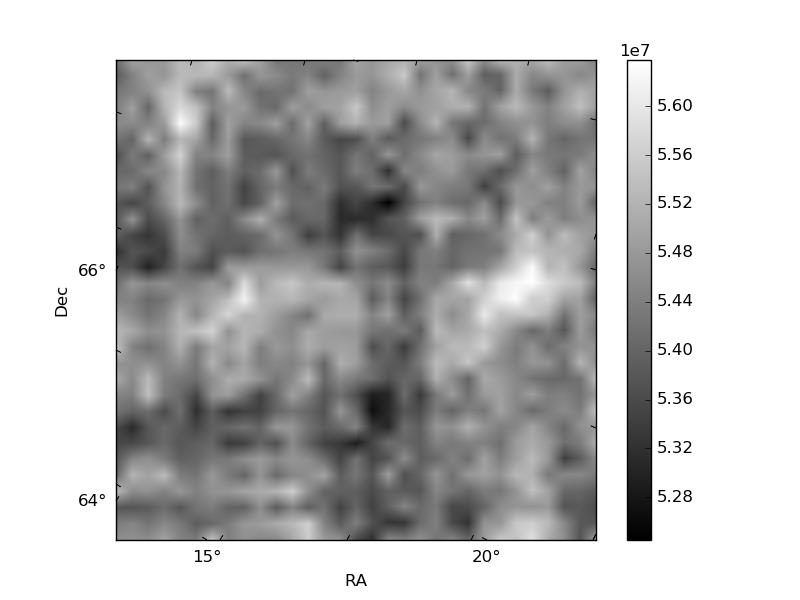
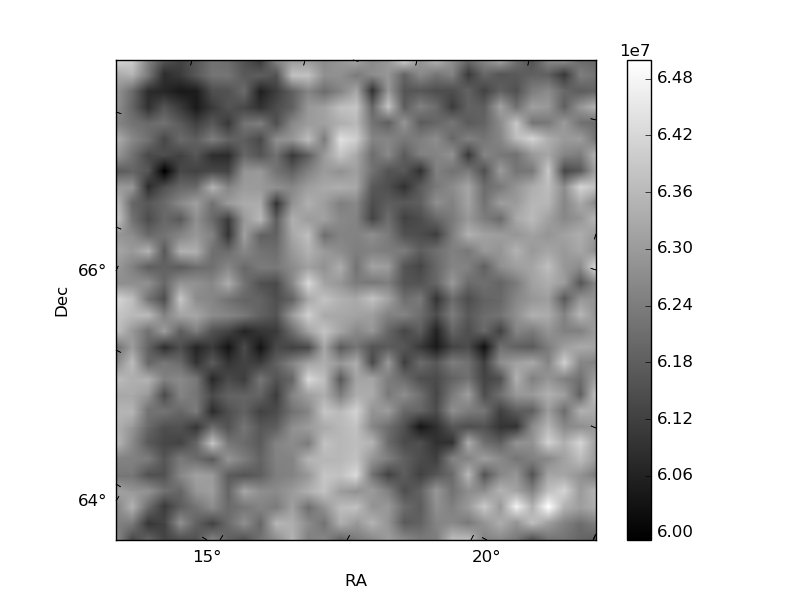
Histogram calculated using DETX and DETY for each event in the final _common_clean file
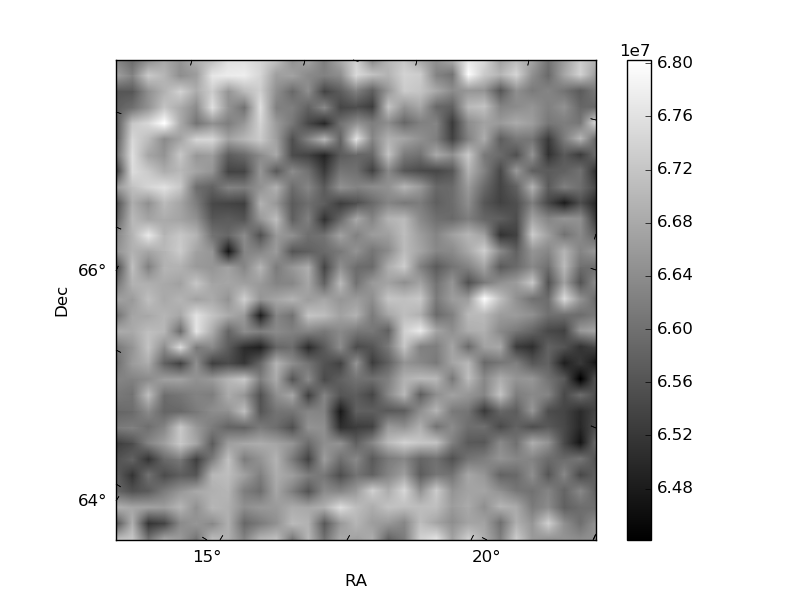
| Quadrant A | 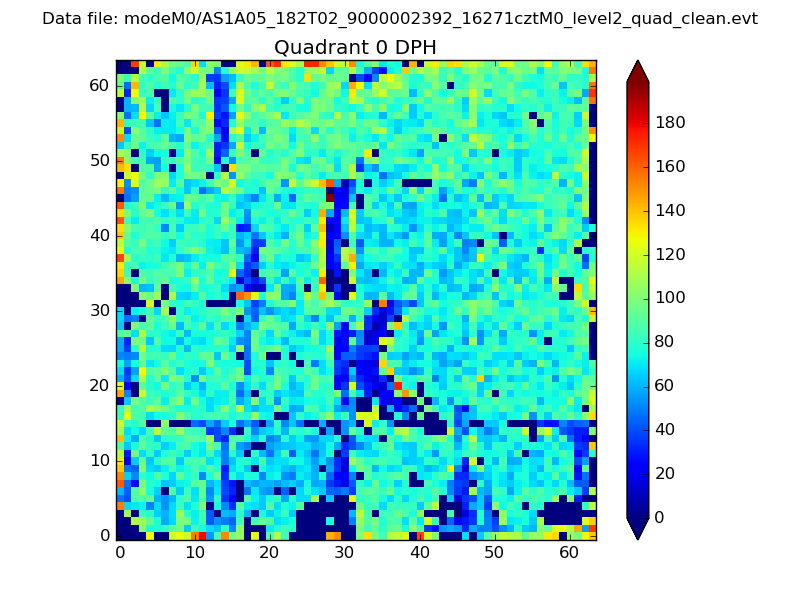 |
 |
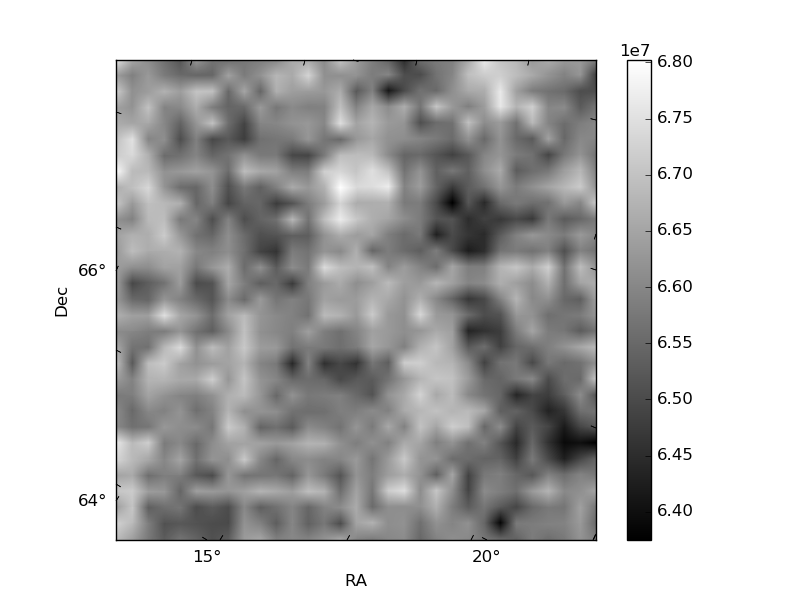
Quadrant B |
|---|---|---|---|
| Quadrant D | 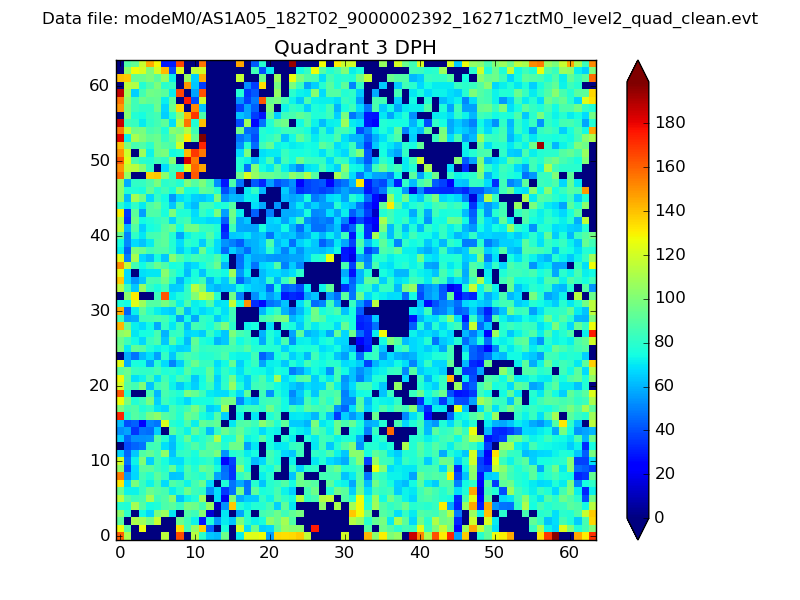 |
 |
Quadrant C |
| Plot type | Count rate plots | Images |
|---|---|---|
| Comparison with Poisson distribution Blue bars denote a histogram of data divided into 1 sec bins. Red curve is a Poisson curve with rate = median count rate of data. |
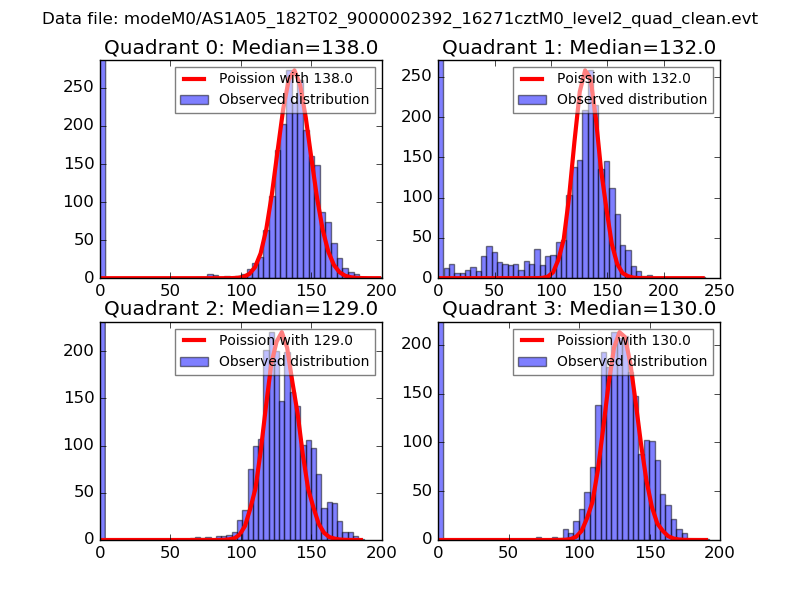 |
 |
| Quadrant-wise count rates Data is divided into 100 sec bins |
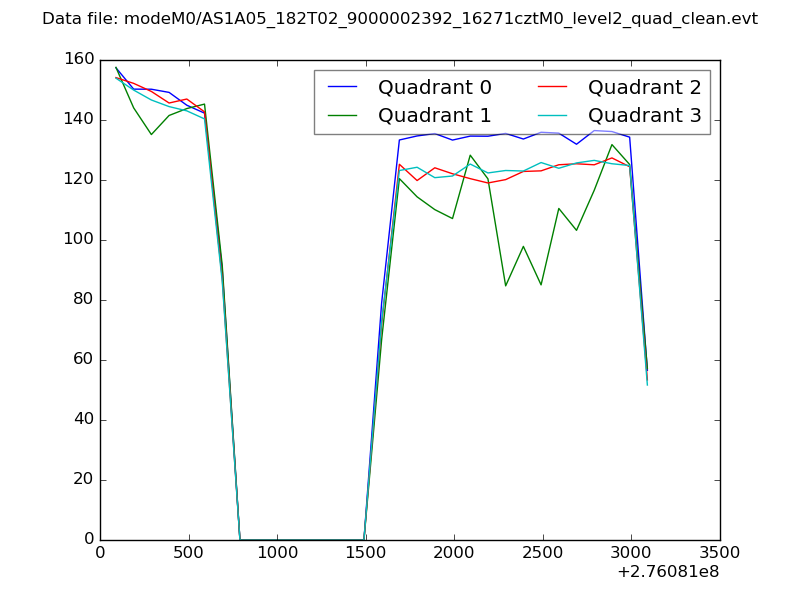 |
|
| Module-wise count rates for Quadrant A Data is divided into 100 sec bins |
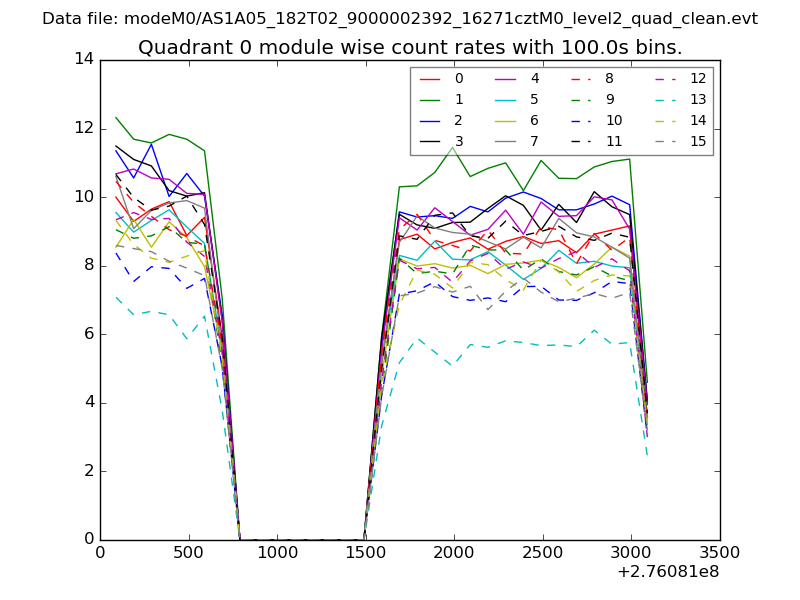 |
 |
| Module-wise count rates for Quadrant B Data is divided into 100 sec bins |
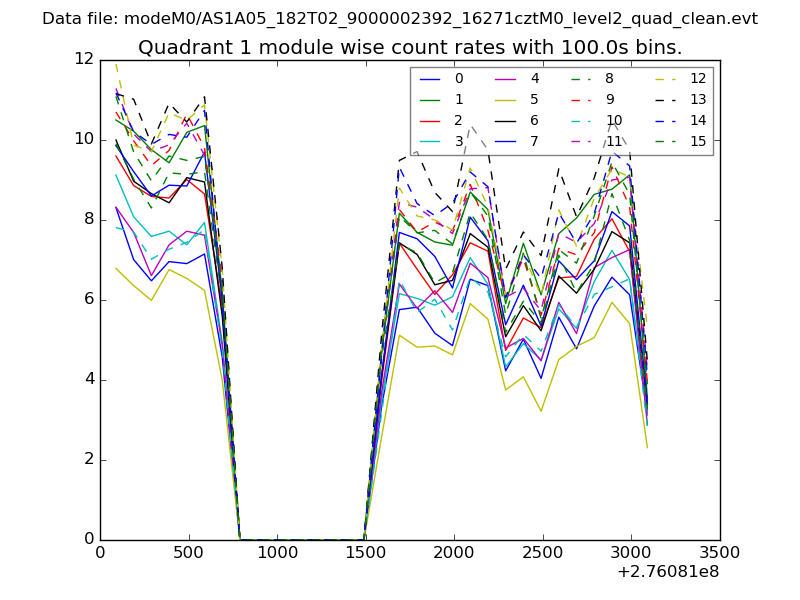 |
 |
| Module-wise count rates for Quadrant C Data is divided into 100 sec bins |
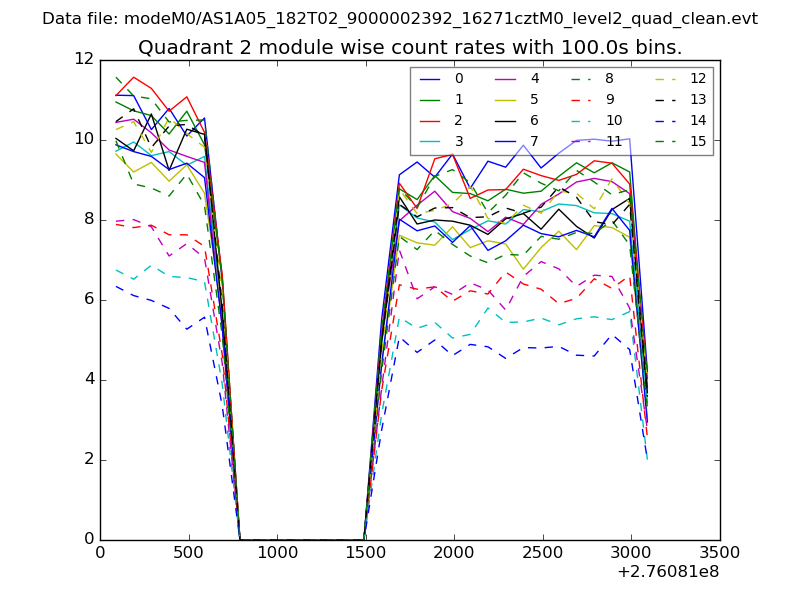 |
 |
| Module-wise count rates for Quadrant D Data is divided into 100 sec bins |
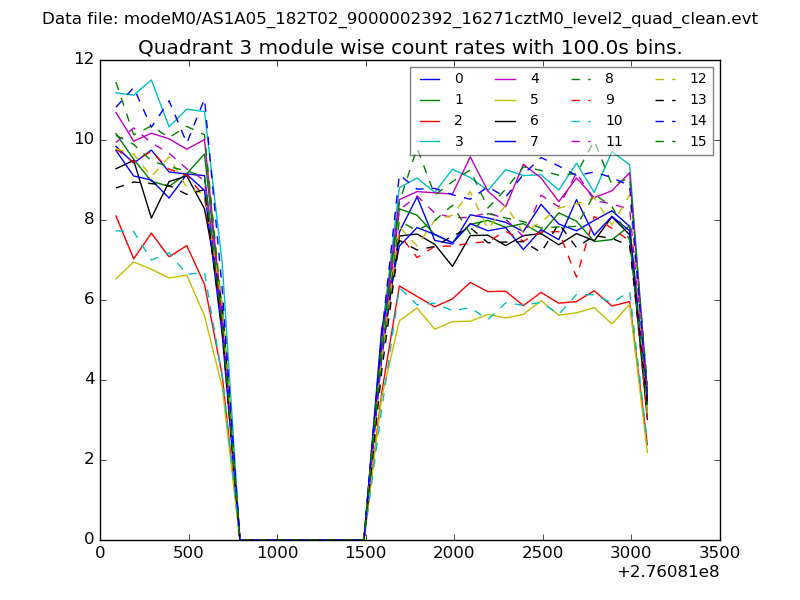 |
 |
| Parameter | Plot |
|---|---|
| CZT HV Monitor | 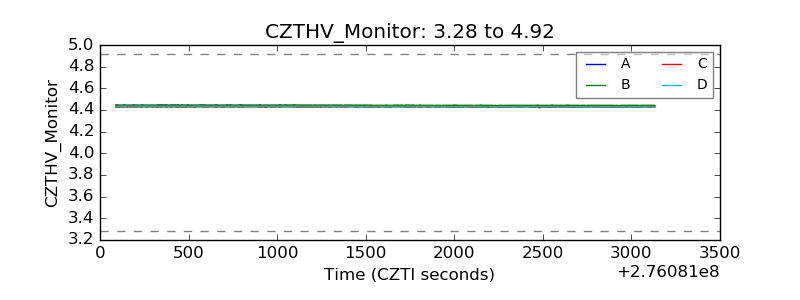 |
| D_VDD | 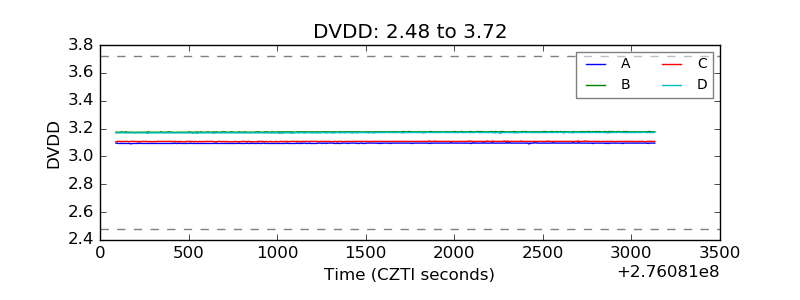 |
| Temperature 1 | 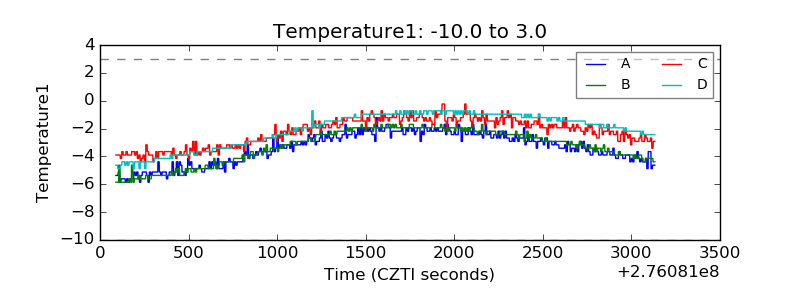 |
| Veto HV Monitor | 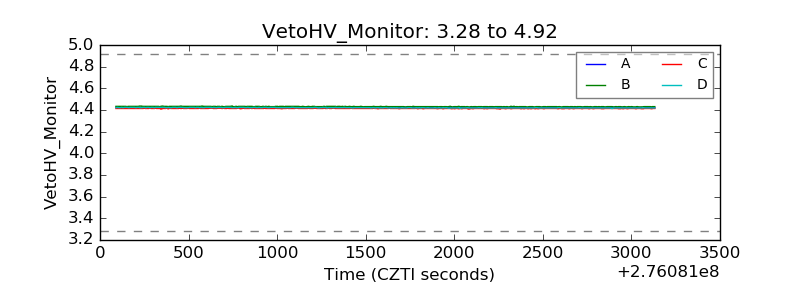 |
| Veto LLD | 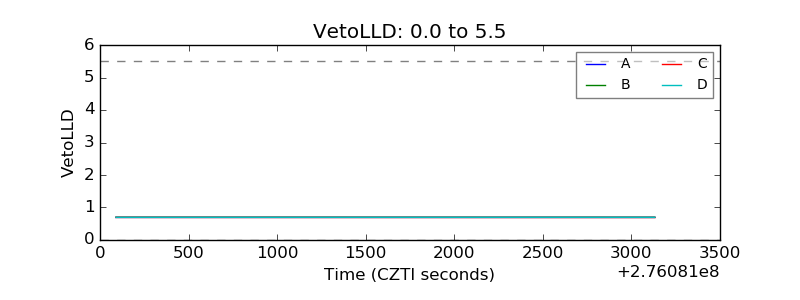 |
| Alpha Counter | 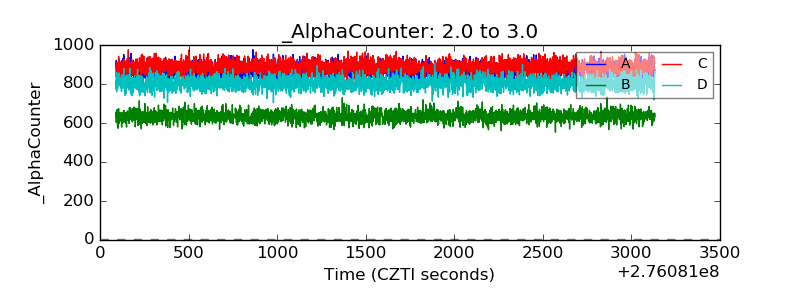 |
| _CPM_Rate | 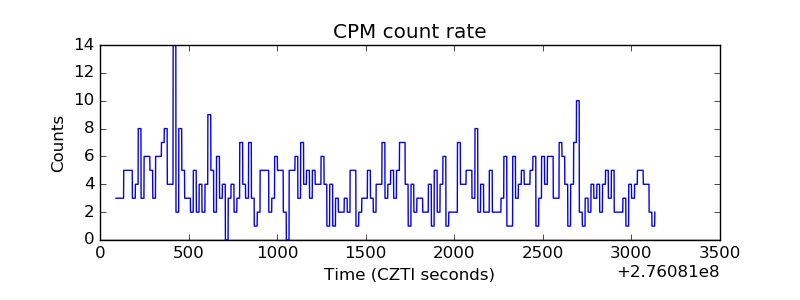 |
| CZT Counter |  |
| +2.5 Volts monitor |  |
| +5 Volts monitor |  |
| _ROLL_ROT | 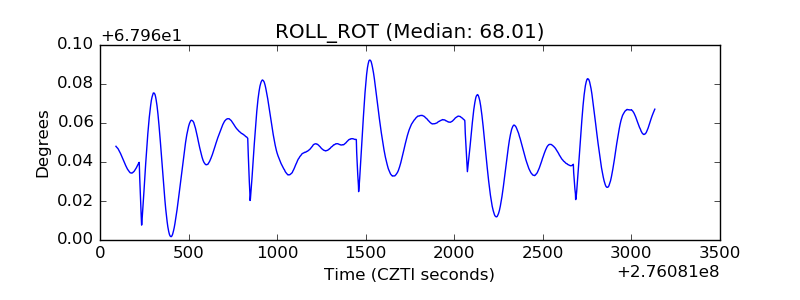 |
| _Roll_DEC | 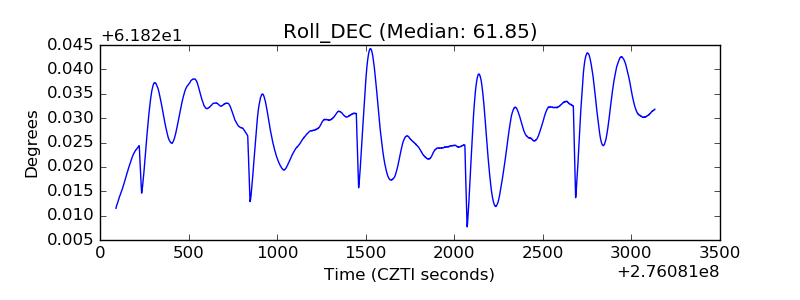 |
| _Roll_RA | 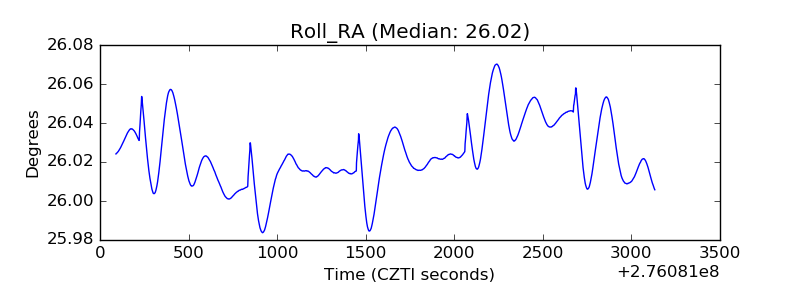 |
| Veto Counter | 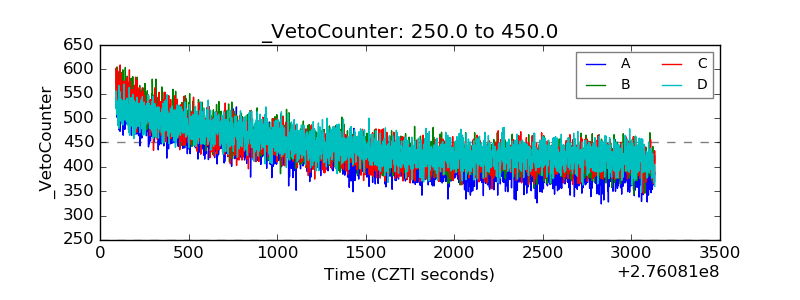 |