| Param | Original file | Final file |
|---|---|---|
| Filename | modeM0/AS1A05_101T04_9000002402cztM0_level2.fits | modeM0/AS1A05_101T04_9000002402cztM0_level2_quad_clean.evt |
| Size (bytes) | 288,236,160 | 206,507,520 |
| Size | 274.9 MB | 196.9 MB |
| Events in quadrant A | 1,783,096 | 1,105,858 |
| Events in quadrant B | 1,726,272 | 1,136,585 |
| Events in quadrant C | 1,779,396 | 1,099,201 |
| Events in quadrant D | 1,565,878 | 1,035,075 |
| Mode M0 | |||
|---|---|---|---|
| Quadrant | BADHDUFLAG | Total packets | Discarded packets |
| A | 0 | 60015 | 0 |
| B | 0 | 58947 | 0 |
| C | 0 | 65114 | 0 |
| D | 0 | 58934 | 0 |
| Mode SS | |||
|---|---|---|---|
| Quadrant | BADHDUFLAG | Total packets | Discarded packets |
| A | 0 | 556 | 0 |
| B | 0 | 556 | 0 |
| C | 0 | 556 | 0 |
| D | 0 | 556 | 0 |
| Mode M9 | |||
|---|---|---|---|
| Quadrant | BADHDUFLAG | Total packets | Discarded packets |
| A | 0 | 62 | 0 |
| B | 0 | 62 | 0 |
| C | 0 | 62 | 0 |
| D | 0 | 62 | 0 |
| Quadrant | Total seconds | Saturated seconds | Saturation percentage |
|---|---|---|---|
| A | 27271 | 343 | 1.257746% |
| B | 27271 | 216 | 0.792050% |
| C | 27271 | 620 | 2.273477% |
| D | 27270 | 227 | 0.832417% |
Noise dominated data is calculated using 1-second bins in cleaned event files. If a bin has >2000 counts, and if more than 50% of those come from <1% of pixels, then it is considered to be noise-dominated and hence unusable.
| Quadrant | # 1 sec bins | Bins with >0 counts | Bins with >2000 counts | High rate bins dominated by noise | Noise dominated (total time) | Noise dominated (detector-on time) | Marked lightcurve |
|---|---|---|---|---|---|---|---|
| A | 33492 | 27269 | 0 | 0 | 0.00% | 0.00% |  |
| B | 33492 | 27268 | 0 | 0 | 0.00% | 0.00% |  |
| C | 33492 | 27272 | 0 | 0 | 0.00% | 0.00% |  |
| D | 33492 | 27270 | 0 | 0 | 0.00% | 0.00% |  |
Top three noisy pixels from each quadrant. If the there are fewer than three noisy pixels in the level2.evt file, extra rows are filled as -1
| Pixel properties | Quadrant properties | ||||||
|---|---|---|---|---|---|---|---|
| Quadrant | DetID | PixID | Counts | Sigma | Mean | Median | Sigma |
| A | 0 | 29 | 1680 | 10.92 | 464 | 440 | 113.6 |
| A | 7 | 110 | 1429 | 8.71 | 464 | 440 | 113.6 |
| A | 9 | 19 | 1404 | 8.49 | 464 | 440 | 113.6 |
| B | 2 | 9 | 1439 | 11.06 | 457 | 440 | 90.4 |
| B | 2 | 8 | 1180 | 8.19 | 457 | 440 | 90.4 |
| B | 5 | 128 | 1119 | 7.51 | 457 | 440 | 90.4 |
| C | 12 | 250 | 1296 | 6.98 | 469 | 444 | 122.1 |
| C | 1 | 81 | 1294 | 6.96 | 469 | 444 | 122.1 |
| C | 1 | 80 | 1277 | 6.82 | 469 | 444 | 122.1 |
| D | 6 | 231 | 1144 | 6.19 | 447 | 410 | 118.6 |
| D | 6 | 67 | 1109 | 5.89 | 447 | 410 | 118.6 |
| D | 6 | 38 | 1099 | 5.81 | 447 | 410 | 118.6 |
Histogram calculated using DETX and DETY for each event in the final _common_clean file
| Quadrant A |  |
 |
Quadrant B |
|---|---|---|---|
| Quadrant D |  |
 |
Quadrant C |
| Plot type | Count rate plots | Images |
|---|---|---|
| Comparison with Poisson distribution Blue bars denote a histogram of data divided into 1 sec bins. Red curve is a Poisson curve with rate = median count rate of data. |
 |
 |
| Quadrant-wise count rates Data is divided into 100 sec bins |
 |
|
| Module-wise count rates for Quadrant A Data is divided into 100 sec bins |
 |
 |
| Module-wise count rates for Quadrant B Data is divided into 100 sec bins |
 |
 |
| Module-wise count rates for Quadrant C Data is divided into 100 sec bins |
 |
 |
| Module-wise count rates for Quadrant D Data is divided into 100 sec bins |
 |
 |
| Parameter | Plot |
|---|---|
| CZT HV Monitor | 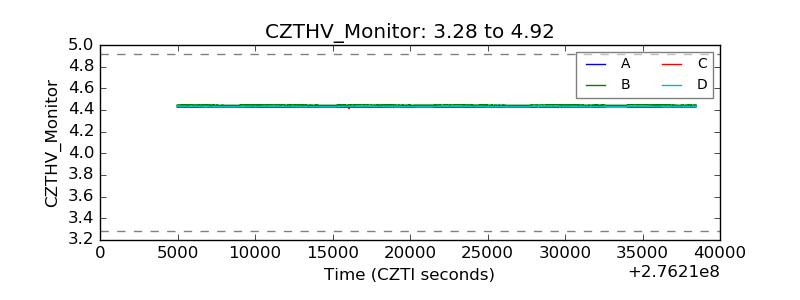 |
| D_VDD | 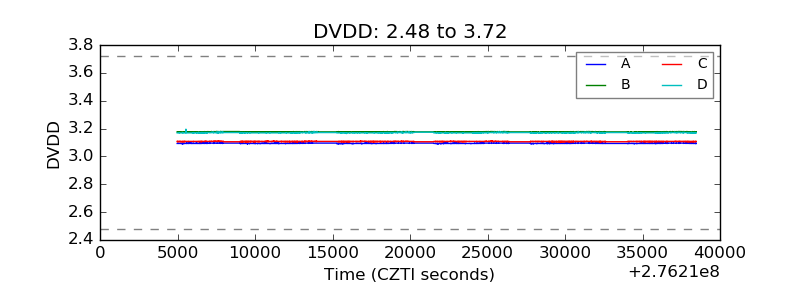 |
| Temperature 1 |  |
| Veto HV Monitor |  |
| Veto LLD |  |
| Alpha Counter |  |
| _CPM_Rate |  |
| CZT Counter |  |
| +2.5 Volts monitor |  |
| +5 Volts monitor |  |
| _ROLL_ROT |  |
| _Roll_DEC | 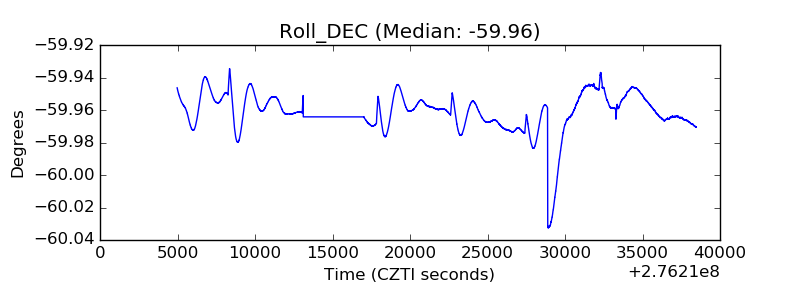 |
| _Roll_RA |  |
| Veto Counter |  |