| Param | Original file | Final file |
|---|---|---|
| Filename | modeM0/AS1A05_101T04_9000002402_16297cztM0_level2.evt | modeM0/AS1A05_101T04_9000002402_16297cztM0_level2_quad_clean.evt |
| Size (bytes) | 774,892,800 | 144,483,840 |
| Size | 739.0 MB | 137.8 MB |
| Events in quadrant A | 6,086,577 | 892,590 |
| Events in quadrant B | 5,593,512 | 936,183 |
| Events in quadrant C | 5,831,753 | 916,387 |
| Events in quadrant D | 5,242,975 | 901,402 |
| Mode M0 | |||
|---|---|---|---|
| Quadrant | BADHDUFLAG | Total packets | Discarded packets |
| A | 0 | 24664 | 3 |
| B | 0 | 22898 | 2 |
| C | 0 | 23697 | 2 |
| D | 0 | 22136 | 4 |
| Mode SS | |||
|---|---|---|---|
| Quadrant | BADHDUFLAG | Total packets | Discarded packets |
| A | 0 | 214 | 0 |
| B | 0 | 214 | 0 |
| C | 0 | 214 | 0 |
| D | 0 | 214 | 0 |
| Mode M9 | |||
|---|---|---|---|
| Quadrant | BADHDUFLAG | Total packets | Discarded packets |
| A | 0 | 26 | 0 |
| B | 0 | 26 | 0 |
| C | 0 | 26 | 0 |
| D | 0 | 26 | 0 |
| Quadrant | Total seconds | Saturated seconds | Saturation percentage |
|---|---|---|---|
| A | 10534 | 265 | 2.515664% |
| B | 10534 | 99 | 0.939814% |
| C | 10534 | 134 | 1.272071% |
| D | 10533 | 47 | 0.446217% |
Noise dominated data is calculated using 1-second bins in cleaned event files. If a bin has >2000 counts, and if more than 50% of those come from <1% of pixels, then it is considered to be noise-dominated and hence unusable.
| Quadrant | # 1 sec bins | Bins with >0 counts | Bins with >2000 counts | High rate bins dominated by noise | Noise dominated (total time) | Noise dominated (detector-on time) | Marked lightcurve |
|---|---|---|---|---|---|---|---|
| A | 13150 | 10537 | 164 | 164 | 1.25% | 1.56% | 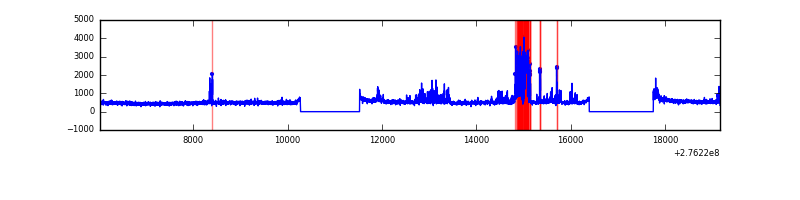 |
| B | 13150 | 10537 | 1 | 1 | 0.01% | 0.01% | 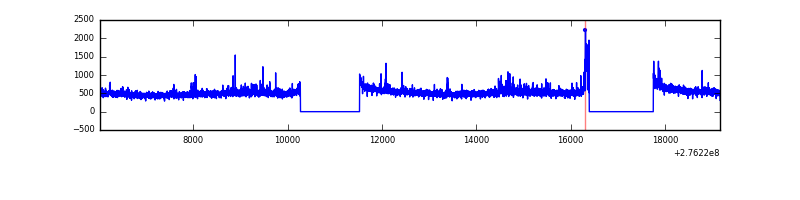 |
| C | 13150 | 10537 | 18 | 18 | 0.14% | 0.17% | 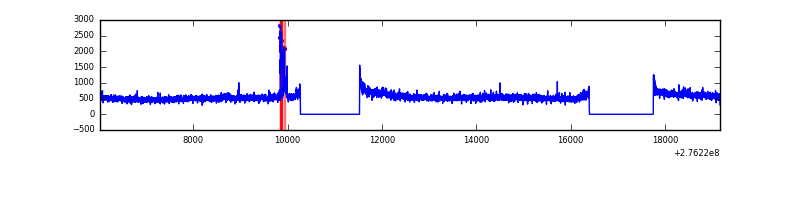 |
| D | 13150 | 10537 | 3 | 3 | 0.02% | 0.03% | 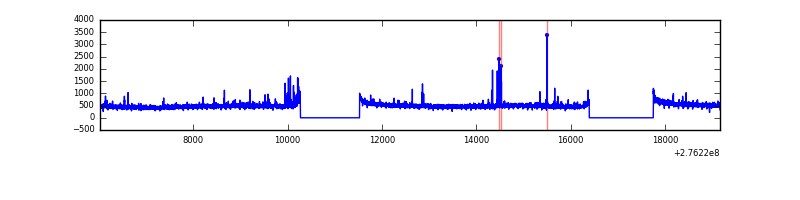 |
Top three noisy pixels from each quadrant. If the there are fewer than three noisy pixels in the level2.evt file, extra rows are filled as -1
| Pixel properties | Quadrant properties | ||||||
|---|---|---|---|---|---|---|---|
| Quadrant | DetID | PixID | Counts | Sigma | Mean | Median | Sigma |
| A | 15 | 174 | 886434 | 3360.68 | 1344 | 1322 | 263.4 |
| A | 15 | 239 | 27897 | 100.9 | 1344 | 1322 | 263.4 |
| A | 0 | 226 | 11788 | 39.74 | 1344 | 1322 | 263.4 |
| B | 0 | 85 | 58837 | 231.25 | 1365 | 1334 | 248.7 |
| B | 0 | 198 | 52639 | 206.32 | 1365 | 1334 | 248.7 |
| B | 0 | 189 | 48891 | 191.25 | 1365 | 1334 | 248.7 |
| C | 3 | 233 | 320652 | 1057.42 | 1335 | 1345 | 302.0 |
| C | 14 | 238 | 210632 | 693.07 | 1335 | 1345 | 302.0 |
| C | 7 | 247 | 86065 | 280.56 | 1335 | 1345 | 302.0 |
| D | 1 | 52 | 60438 | 169.58 | 1334 | 1307 | 348.7 |
| D | 10 | 70 | 48222 | 134.55 | 1334 | 1307 | 348.7 |
| D | 7 | 38 | 40080 | 111.2 | 1334 | 1307 | 348.7 |
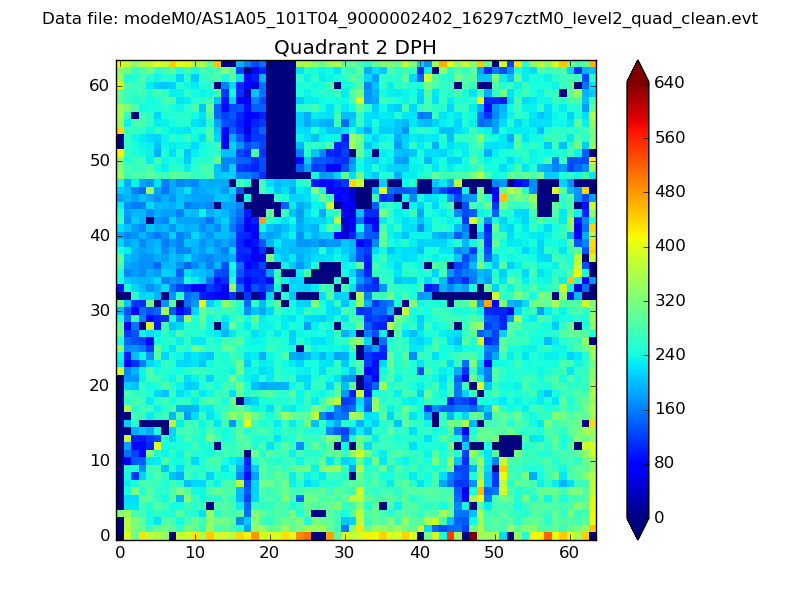
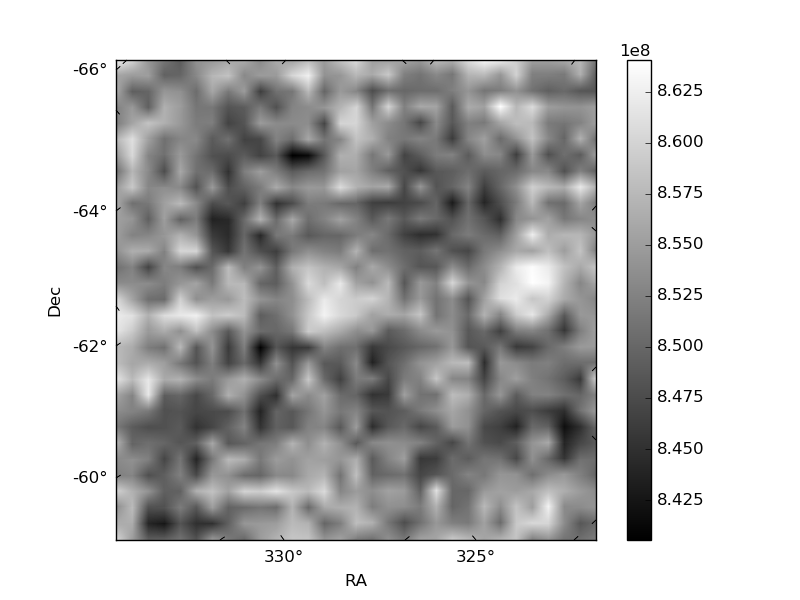
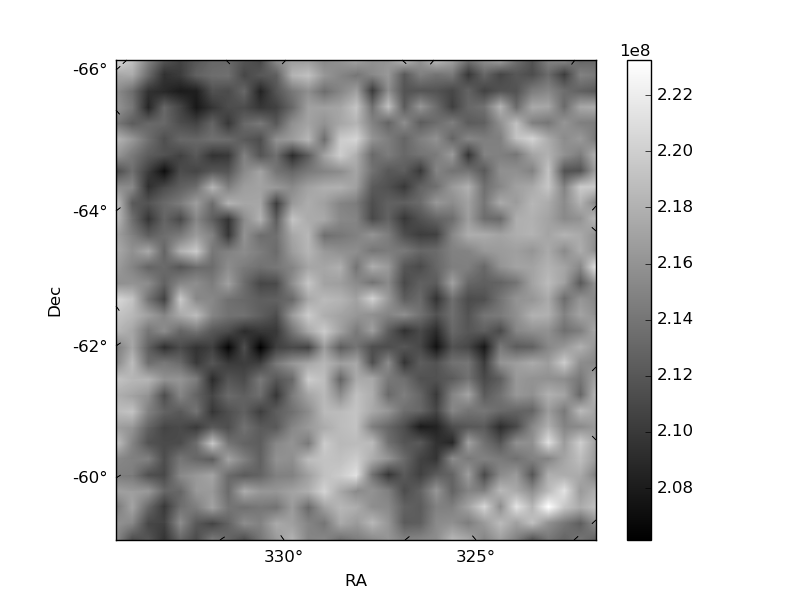
Histogram calculated using DETX and DETY for each event in the final _common_clean file
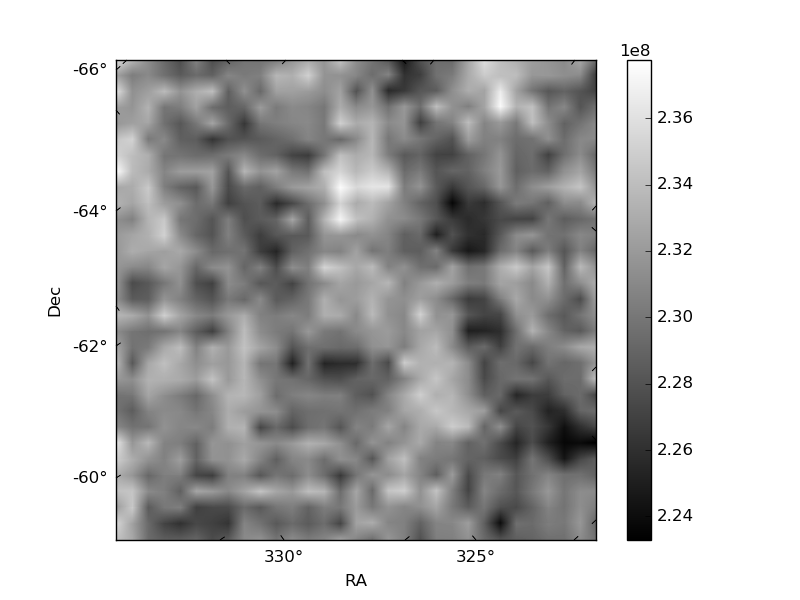
| Quadrant A | 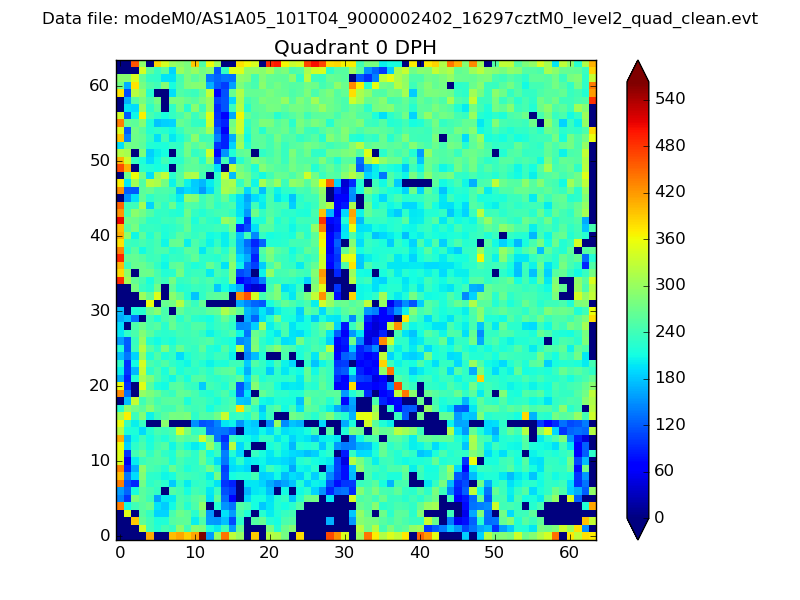 |
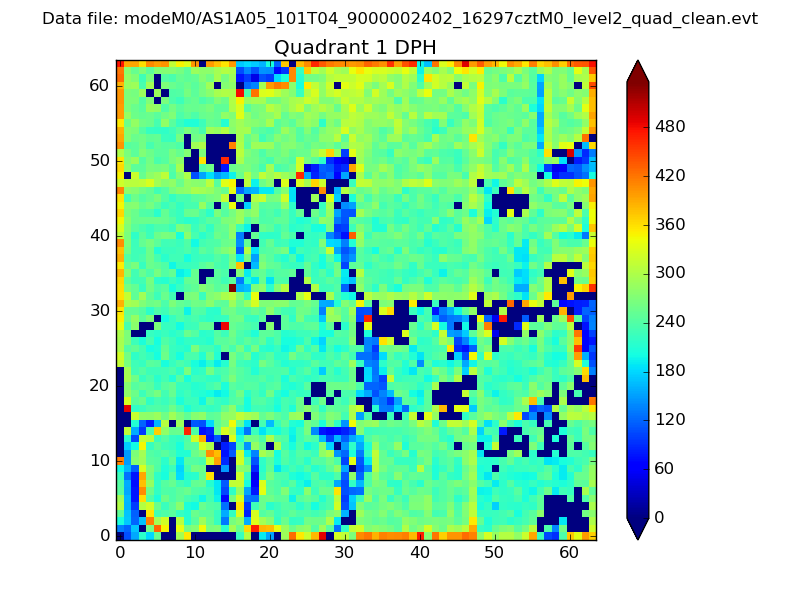 |
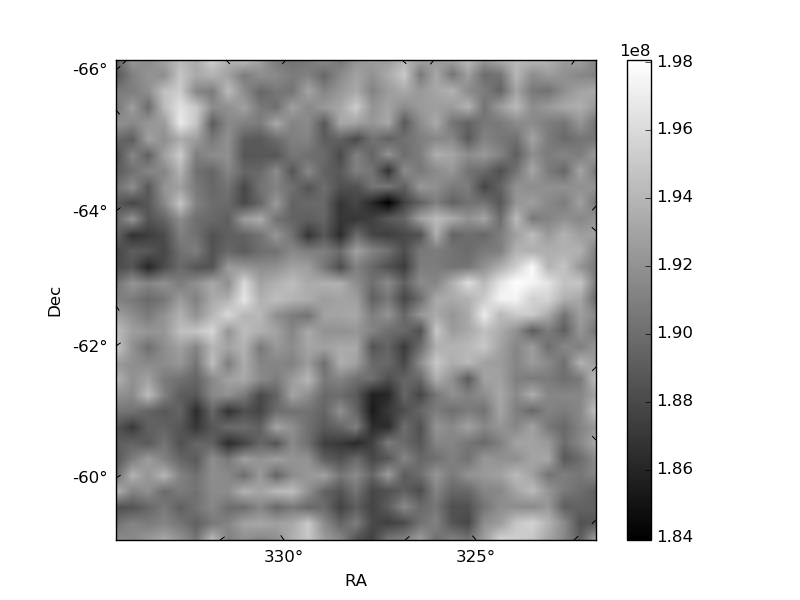
Quadrant B |
|---|---|---|---|
| Quadrant D | 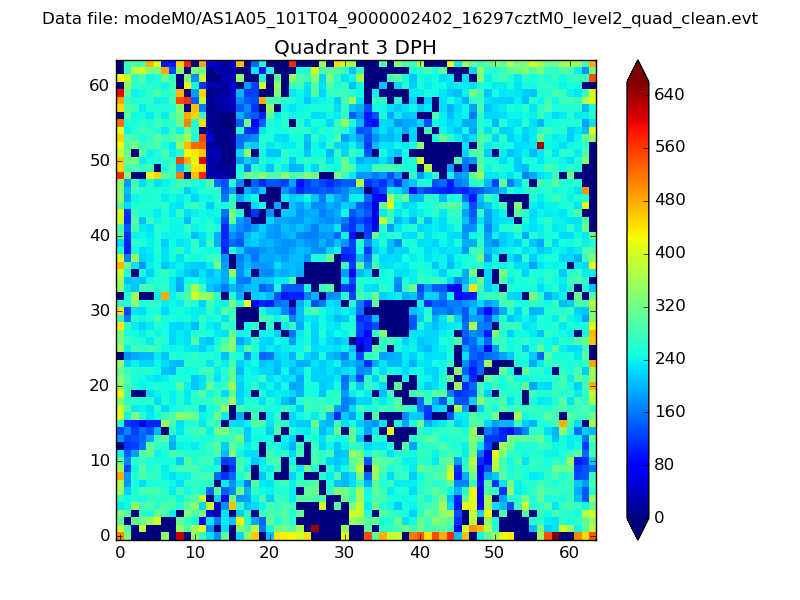 |
 |
Quadrant C |
| Plot type | Count rate plots | Images |
|---|---|---|
| Comparison with Poisson distribution Blue bars denote a histogram of data divided into 1 sec bins. Red curve is a Poisson curve with rate = median count rate of data. |
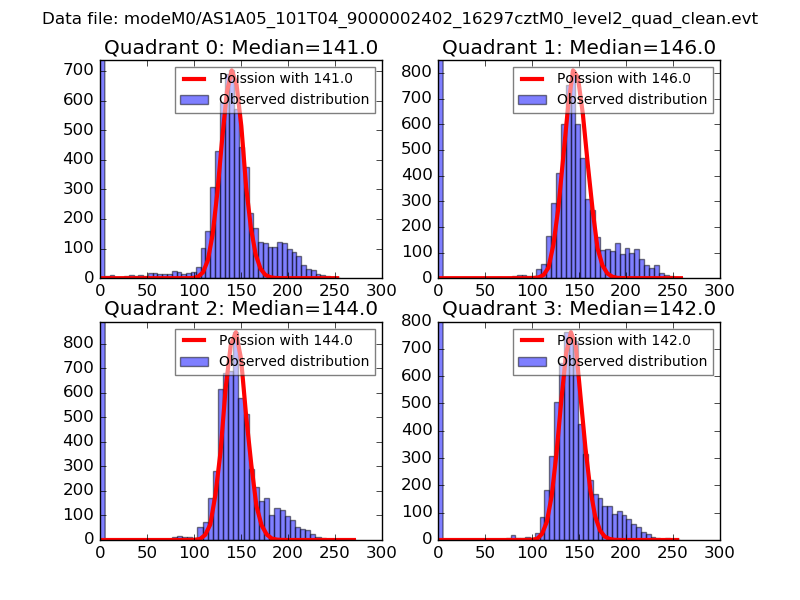 |
 |
| Quadrant-wise count rates Data is divided into 100 sec bins |
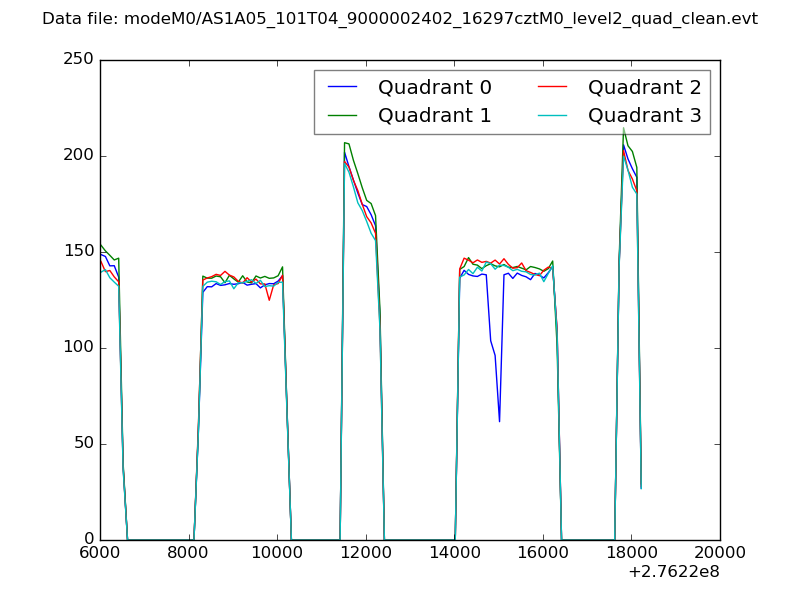 |
|
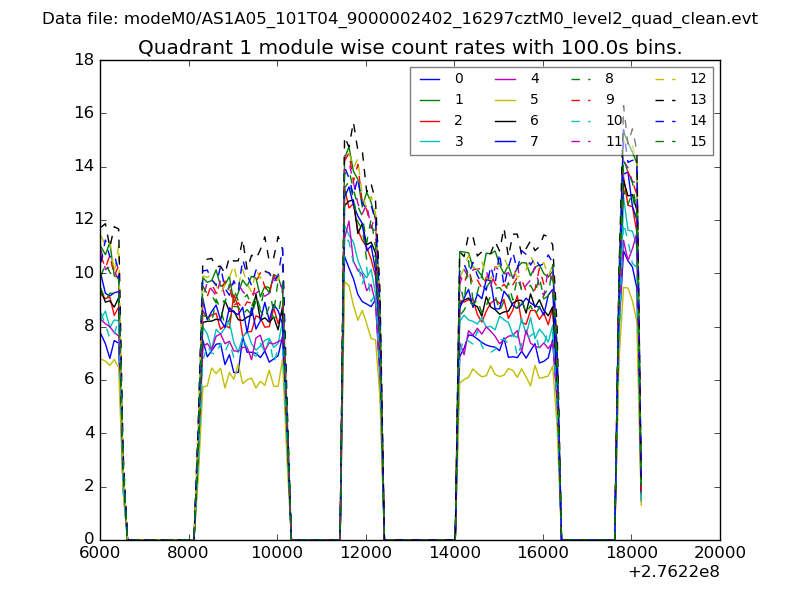
| Module-wise count rates for Quadrant A Data is divided into 100 sec bins |
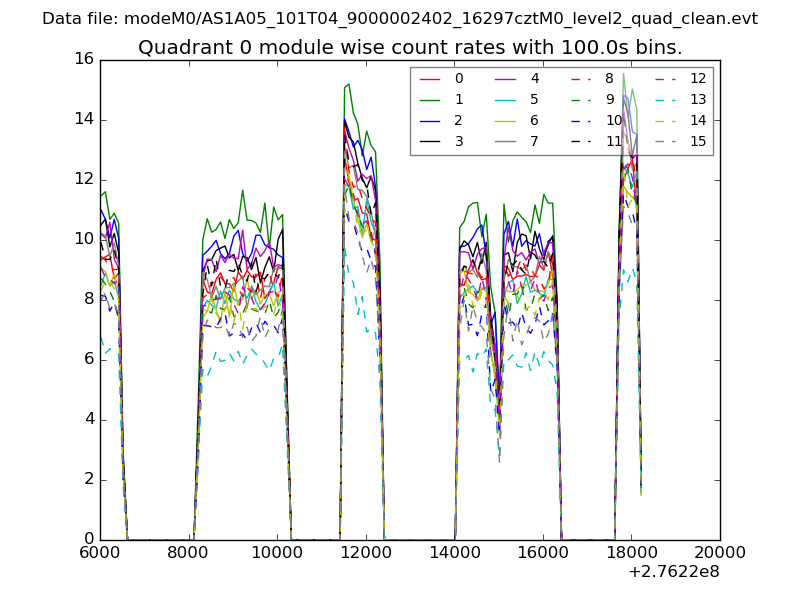 |
 |
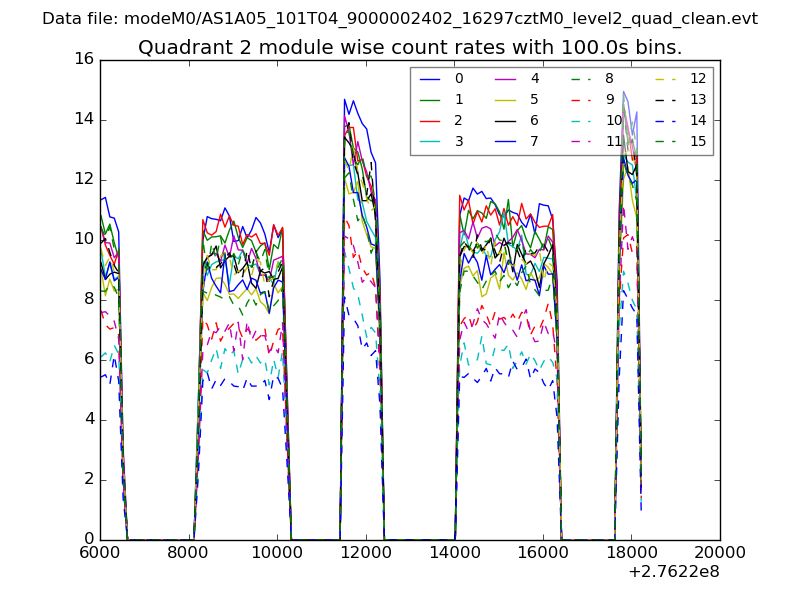
| Module-wise count rates for Quadrant B Data is divided into 100 sec bins |
 |
 |
| Module-wise count rates for Quadrant C Data is divided into 100 sec bins |
 |
 |
| Module-wise count rates for Quadrant D Data is divided into 100 sec bins |
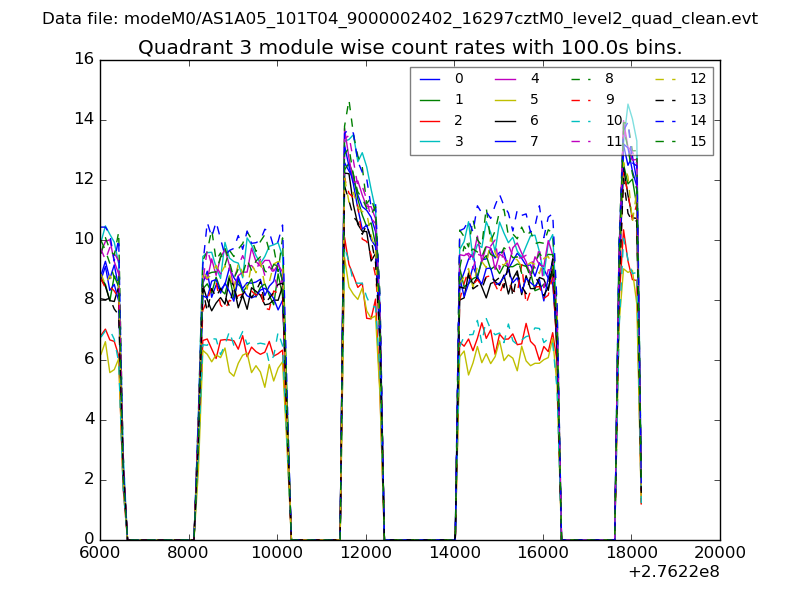 |
 |
| Parameter | Plot |
|---|---|
| CZT HV Monitor | 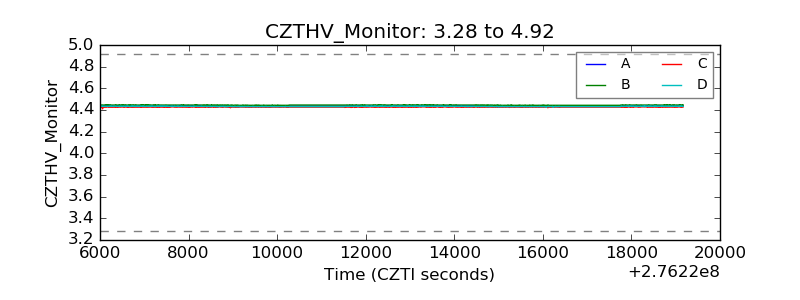 |
| D_VDD | 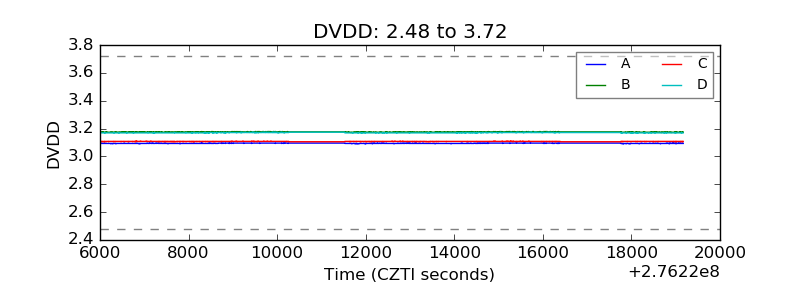 |
| Temperature 1 | 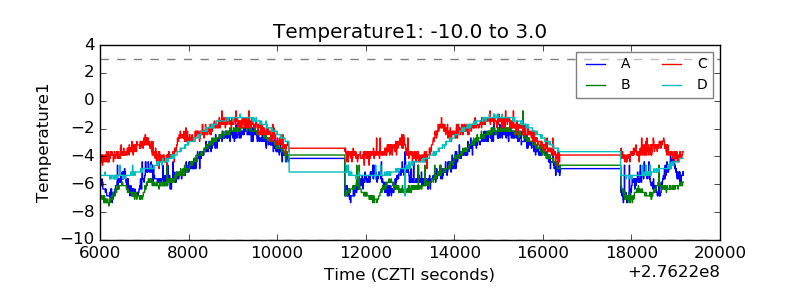 |
| Veto HV Monitor | 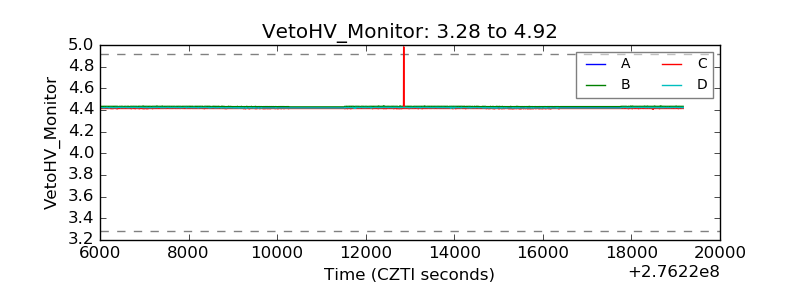 |
| Veto LLD |  |
| Alpha Counter | 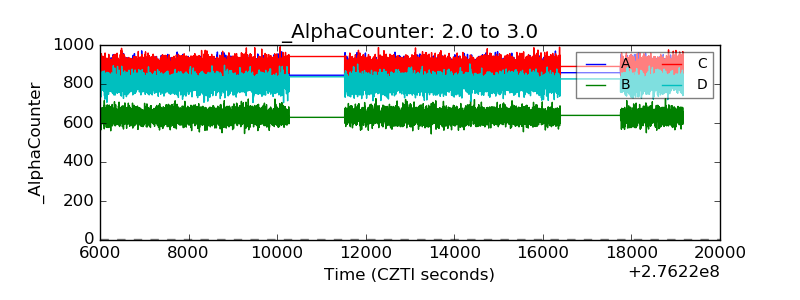 |
| _CPM_Rate | 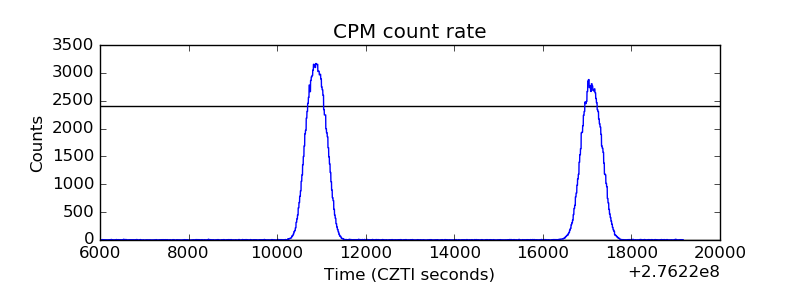 |
| CZT Counter | 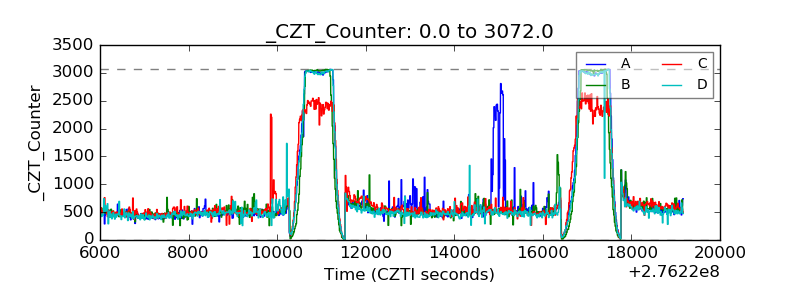 |
| +2.5 Volts monitor |  |
| +5 Volts monitor |  |
| _ROLL_ROT | 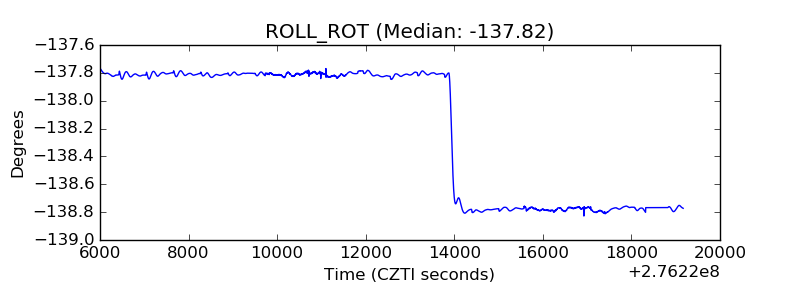 |
| _Roll_DEC | 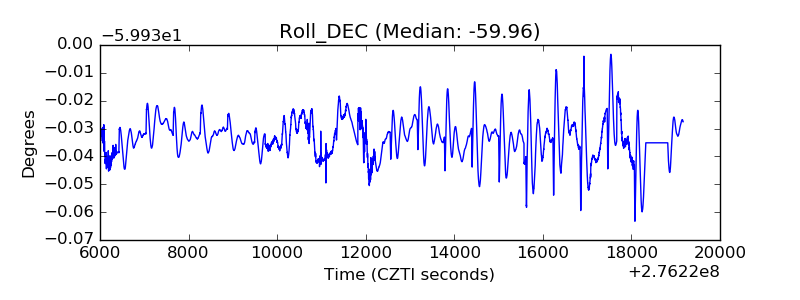 |
| _Roll_RA | 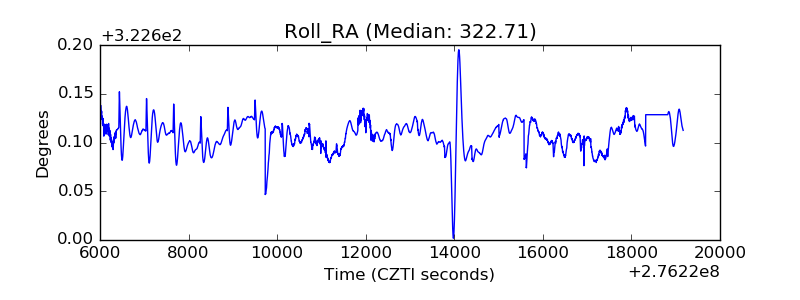 |
| Veto Counter | 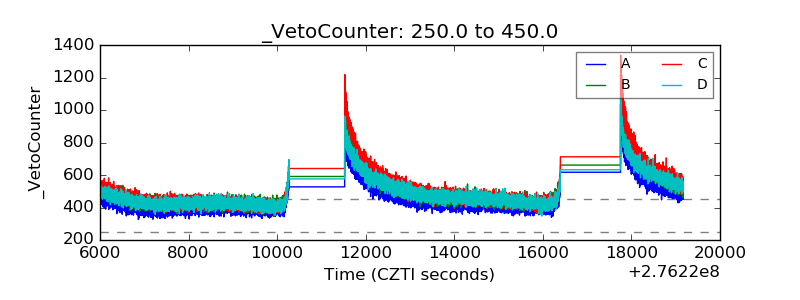 |