| Param | Original file | Final file |
|---|---|---|
| Filename | modeM0/AS1A05_101T04_9000002402_16299cztM0_level2.evt | modeM0/AS1A05_101T04_9000002402_16299cztM0_level2_quad_clean.evt |
| Size (bytes) | 324,489,600 | 62,294,400 |
| Size | 309.5 MB | 59.4 MB |
| Events in quadrant A | 2,265,505 | 389,932 |
| Events in quadrant B | 2,447,226 | 397,978 |
| Events in quadrant C | 2,384,953 | 395,957 |
| Events in quadrant D | 2,424,748 | 387,828 |
| Mode M0 | |||
|---|---|---|---|
| Quadrant | BADHDUFLAG | Total packets | Discarded packets |
| A | 0 | 9378 | 1 |
| B | 0 | 9872 | 1 |
| C | 0 | 9764 | 1 |
| D | 0 | 9908 | 1 |
| Mode SS | |||
|---|---|---|---|
| Quadrant | BADHDUFLAG | Total packets | Discarded packets |
| A | 0 | 90 | 0 |
| B | 0 | 90 | 0 |
| C | 0 | 90 | 0 |
| D | 0 | 90 | 0 |
| Mode M9 | |||
|---|---|---|---|
| Quadrant | BADHDUFLAG | Total packets | Discarded packets |
| A | 0 | 14 | 0 |
| B | 0 | 14 | 0 |
| C | 0 | 14 | 0 |
| D | 0 | 14 | 0 |
| Quadrant | Total seconds | Saturated seconds | Saturation percentage |
|---|---|---|---|
| A | 4477 | 28 | 0.625419% |
| B | 4477 | 50 | 1.116819% |
| C | 4477 | 56 | 1.250838% |
| D | 4477 | 42 | 0.938128% |
Noise dominated data is calculated using 1-second bins in cleaned event files. If a bin has >2000 counts, and if more than 50% of those come from <1% of pixels, then it is considered to be noise-dominated and hence unusable.
| Quadrant | # 1 sec bins | Bins with >0 counts | Bins with >2000 counts | High rate bins dominated by noise | Noise dominated (total time) | Noise dominated (detector-on time) | Marked lightcurve |
|---|---|---|---|---|---|---|---|
| A | 5873 | 4479 | 0 | 0 | 0.00% | 0.00% | 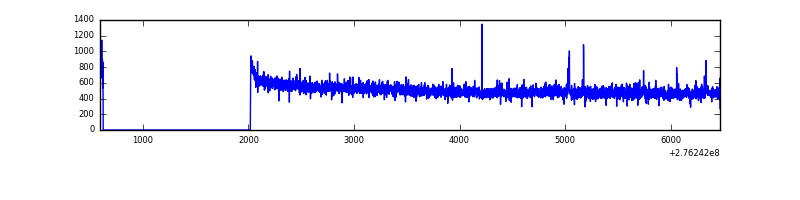 |
| B | 5873 | 4479 | 9 | 9 | 0.15% | 0.20% | 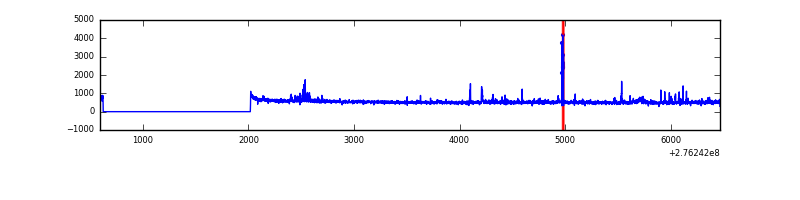 |
| C | 5873 | 4479 | 0 | 0 | 0.00% | 0.00% | 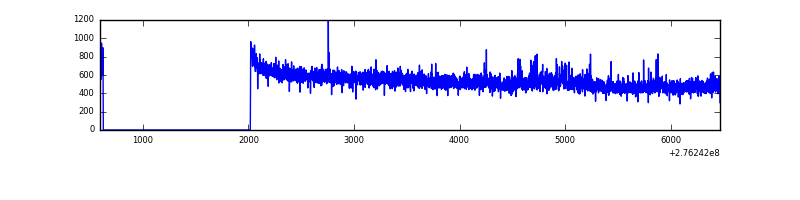 |
| D | 5873 | 4479 | 21 | 21 | 0.36% | 0.47% | 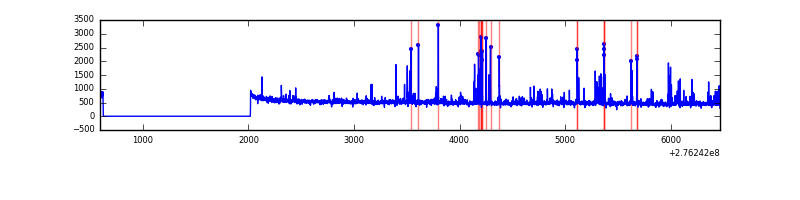 |
Top three noisy pixels from each quadrant. If the there are fewer than three noisy pixels in the level2.evt file, extra rows are filled as -1
| Pixel properties | Quadrant properties | ||||||
|---|---|---|---|---|---|---|---|
| Quadrant | DetID | PixID | Counts | Sigma | Mean | Median | Sigma |
| A | 15 | 174 | 17825 | 149.72 | 583 | 574 | 115.2 |
| A | 0 | 226 | 5074 | 39.06 | 583 | 574 | 115.2 |
| A | 12 | 194 | 4182 | 31.31 | 583 | 574 | 115.2 |
| B | 0 | 189 | 31754 | 292.4 | 581 | 569 | 106.7 |
| B | 0 | 182 | 30874 | 284.15 | 581 | 569 | 106.7 |
| B | 0 | 198 | 30410 | 279.8 | 581 | 569 | 106.7 |
| C | 14 | 238 | 90449 | 693.81 | 565 | 571 | 129.5 |
| C | 0 | 207 | 51948 | 396.6 | 565 | 571 | 129.5 |
| C | 7 | 247 | 34709 | 263.53 | 565 | 571 | 129.5 |
| D | 12 | 110 | 96770 | 644.84 | 570 | 560 | 149.2 |
| D | 10 | 70 | 80762 | 537.55 | 570 | 560 | 149.2 |
| D | 1 | 52 | 66354 | 440.98 | 570 | 560 | 149.2 |
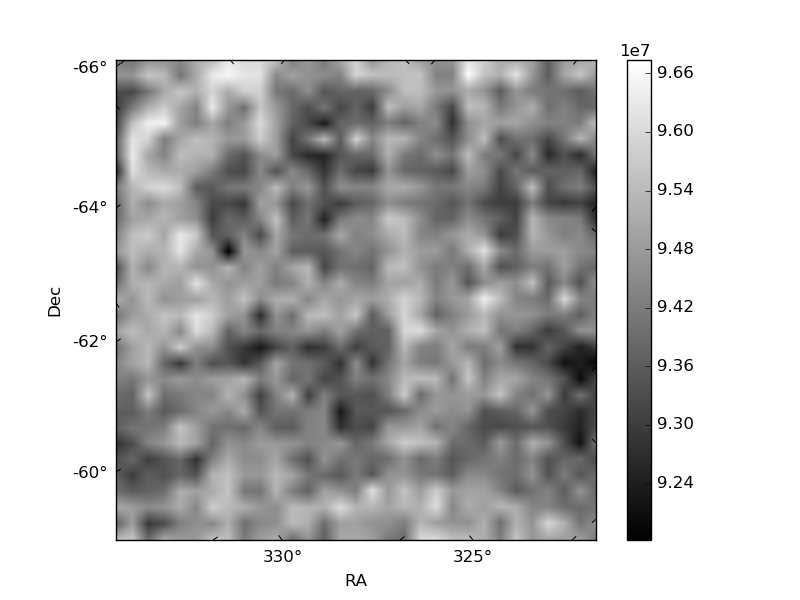
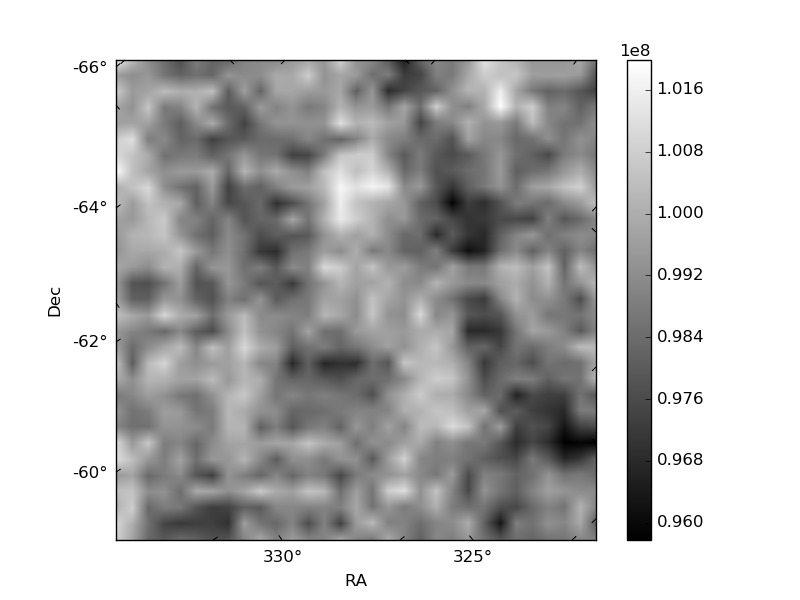
Histogram calculated using DETX and DETY for each event in the final _common_clean file
| Quadrant A |  |
 |
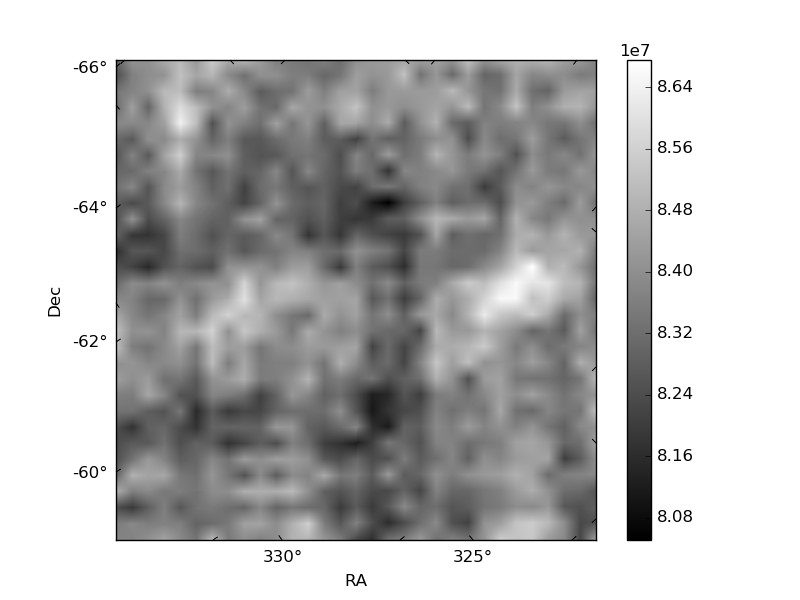
Quadrant B |
|---|---|---|---|
| Quadrant D |  |
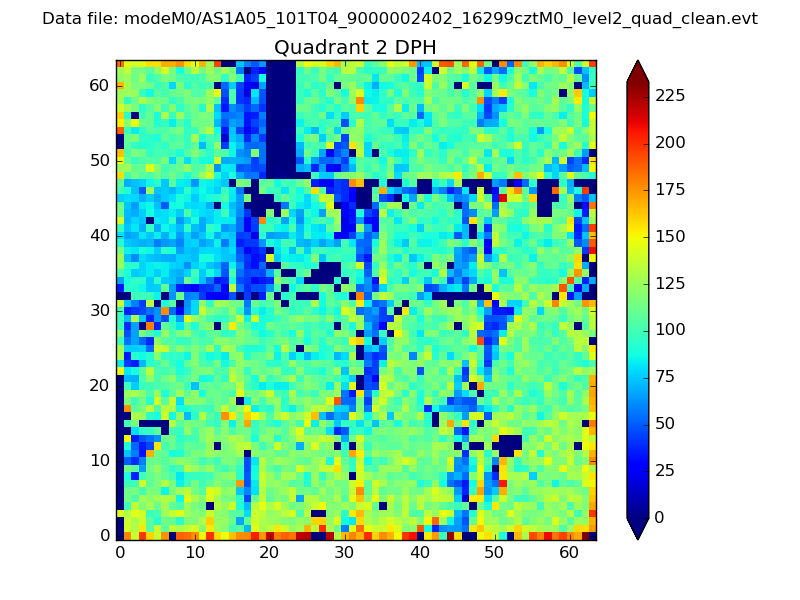 |
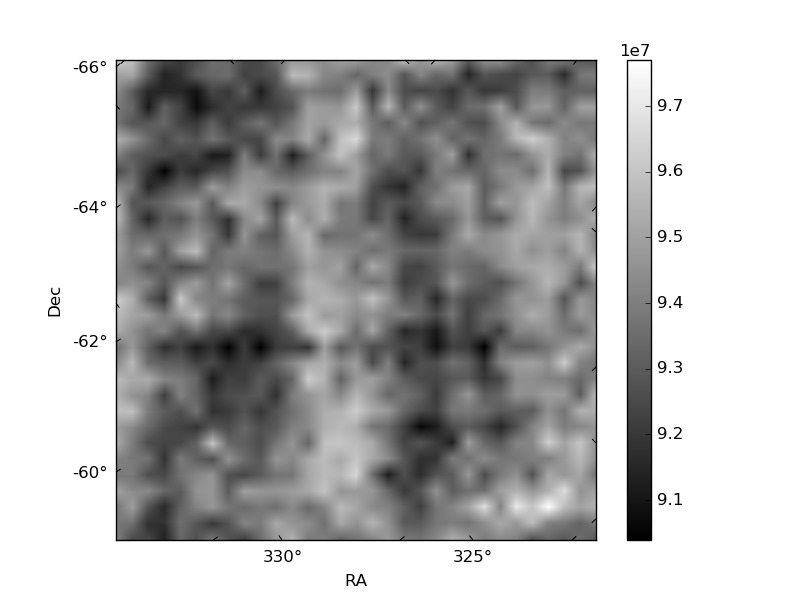
Quadrant C |
| Plot type | Count rate plots | Images |
|---|---|---|
| Comparison with Poisson distribution Blue bars denote a histogram of data divided into 1 sec bins. Red curve is a Poisson curve with rate = median count rate of data. |
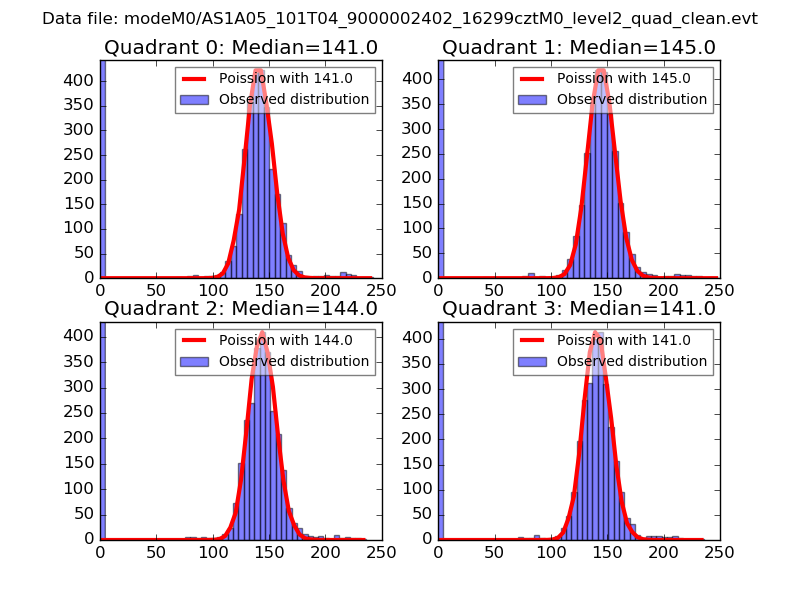 |
 |
| Quadrant-wise count rates Data is divided into 100 sec bins |
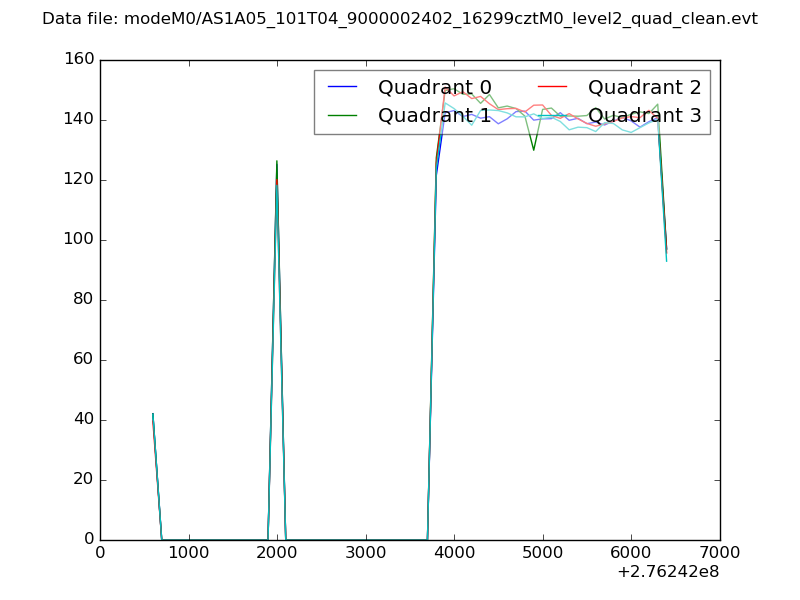 |
|
| Module-wise count rates for Quadrant A Data is divided into 100 sec bins |
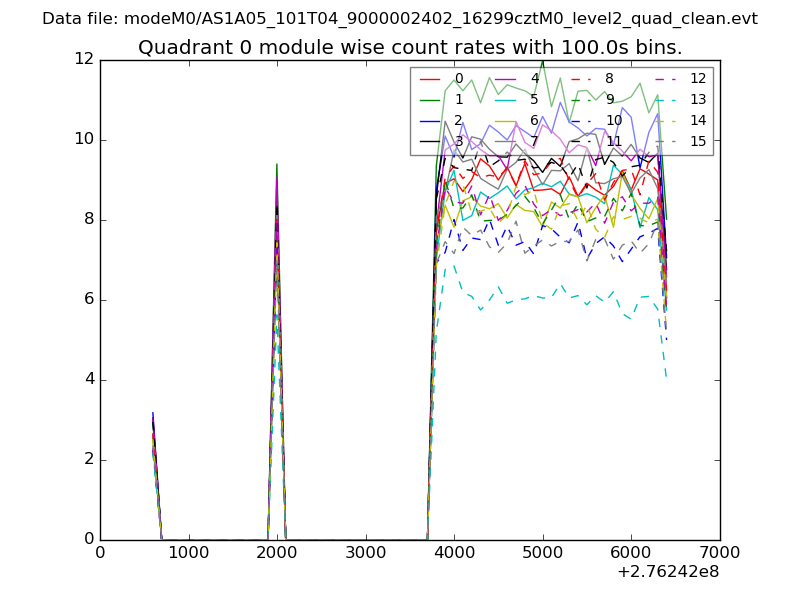 |
 |
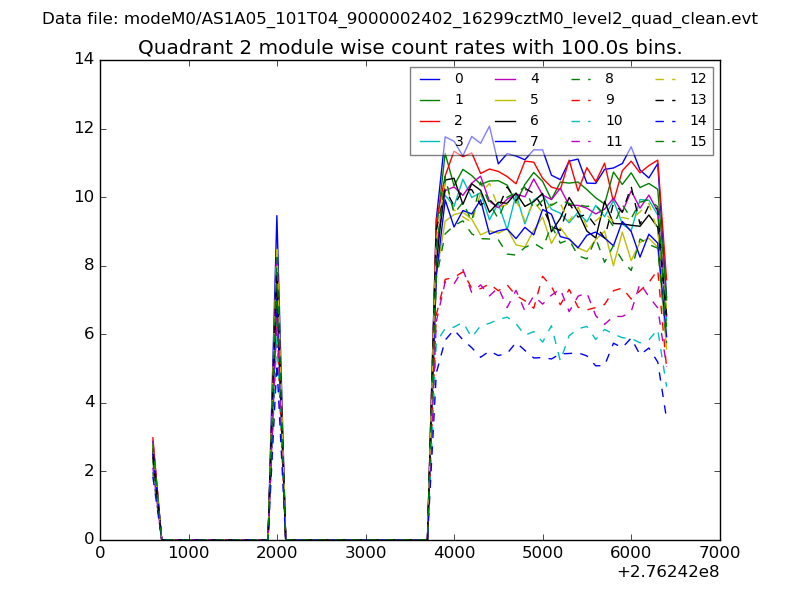
| Module-wise count rates for Quadrant B Data is divided into 100 sec bins |
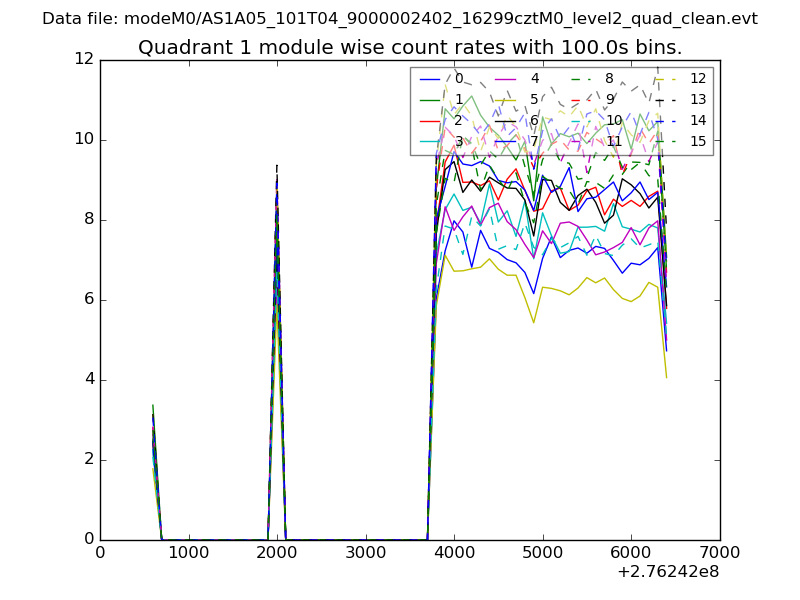 |
 |
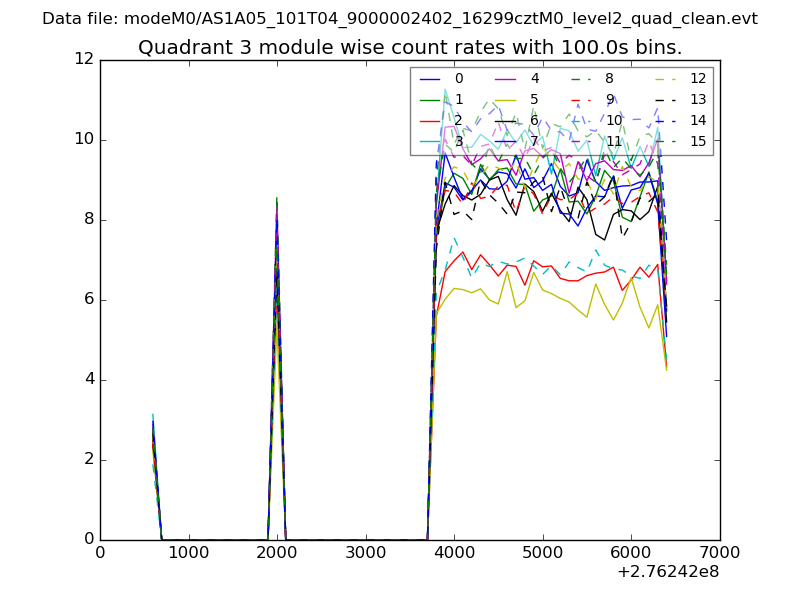
| Module-wise count rates for Quadrant C Data is divided into 100 sec bins |
 |
 |
| Module-wise count rates for Quadrant D Data is divided into 100 sec bins |
 |
 |
| Parameter | Plot |
|---|---|
| CZT HV Monitor | 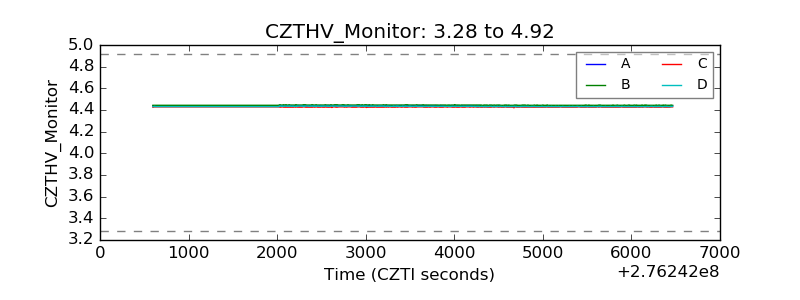 |
| D_VDD | 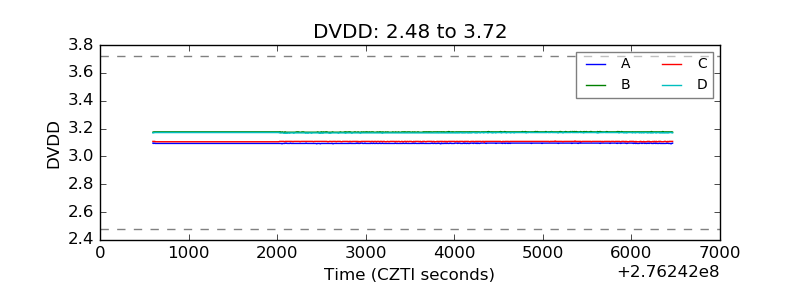 |
| Temperature 1 | 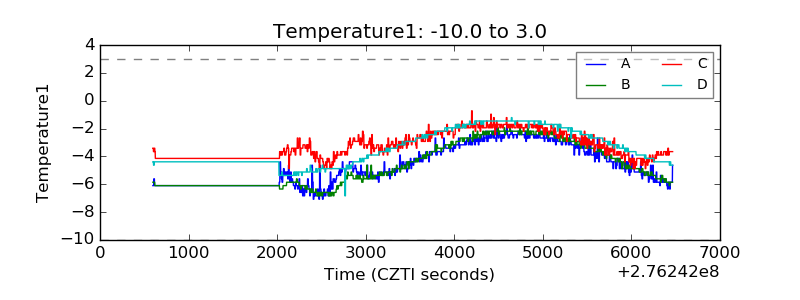 |
| Veto HV Monitor | 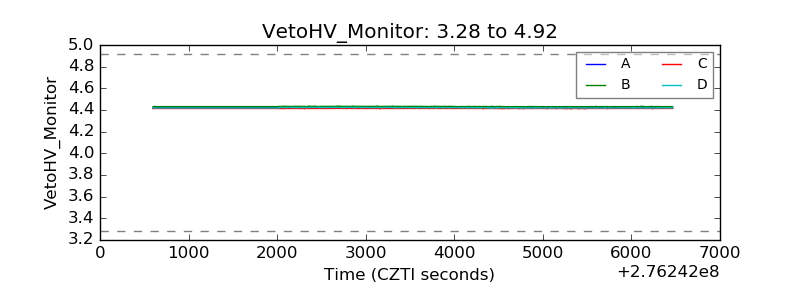 |
| Veto LLD | 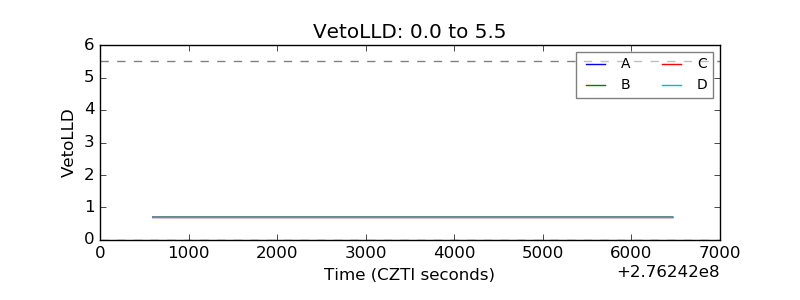 |
| Alpha Counter | 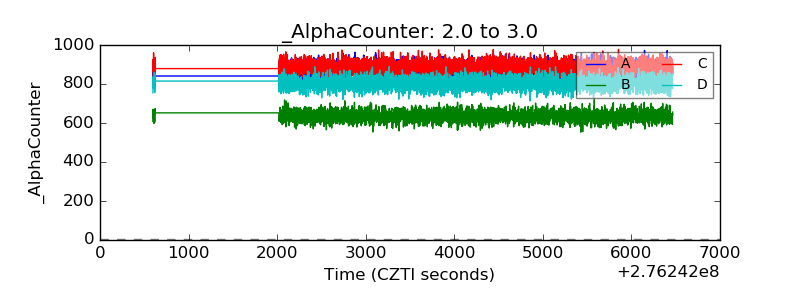 |
| _CPM_Rate | 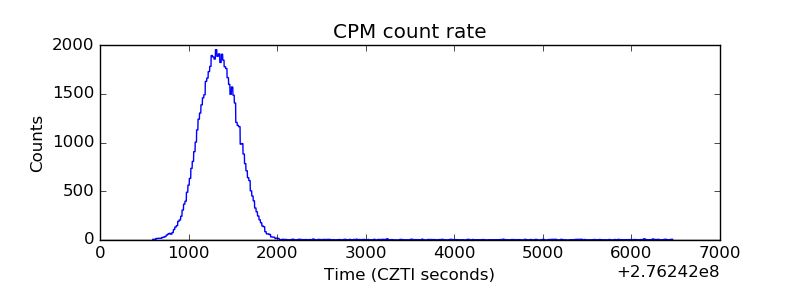 |
| CZT Counter | 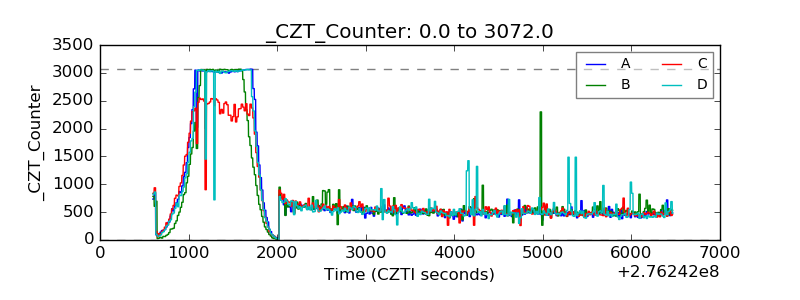 |
| +2.5 Volts monitor |  |
| +5 Volts monitor | 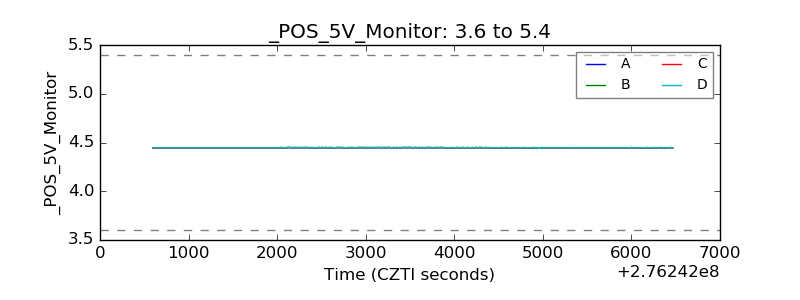 |
| _ROLL_ROT | 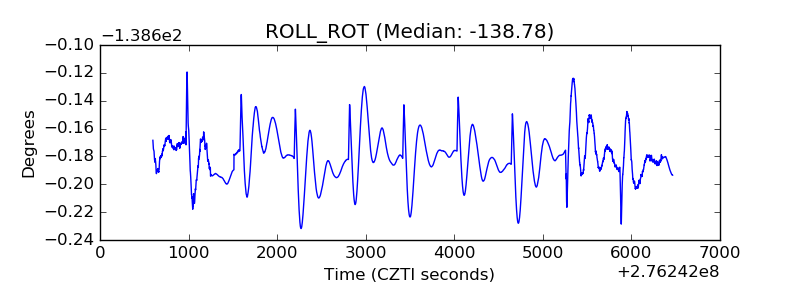 |
| _Roll_DEC | 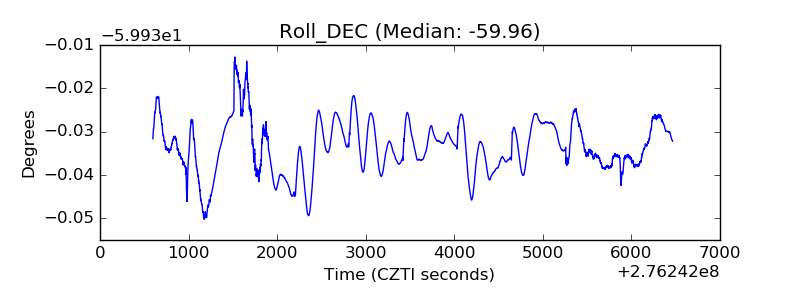 |
| _Roll_RA | 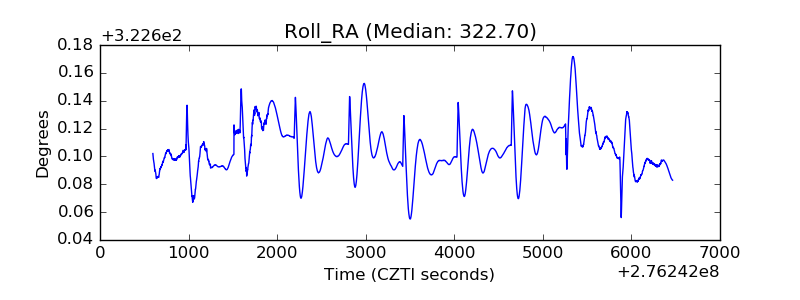 |
| Veto Counter | 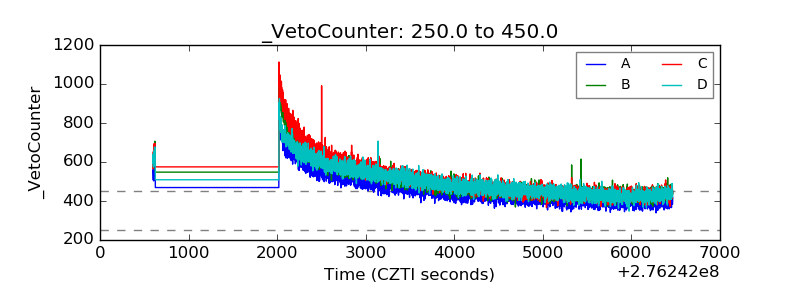 |