| Param | Original file | Final file |
|---|---|---|
| Filename | modeM0/AS1A05_212T08_9000002396cztM0_level2.fits | modeM0/AS1A05_212T08_9000002396cztM0_level2_quad_clean.evt |
| Size (bytes) | 52,024,320 | 36,357,120 |
| Size | 49.6 MB | 34.7 MB |
| Events in quadrant A | 316,924 | 189,157 |
| Events in quadrant B | 302,490 | 188,263 |
| Events in quadrant C | 308,962 | 180,430 |
| Events in quadrant D | 272,076 | 166,697 |
| Mode SS | |||
|---|---|---|---|
| Quadrant | BADHDUFLAG | Total packets | Discarded packets |
| A | 0 | 110 | 0 |
| B | 0 | 110 | 0 |
| C | 0 | 110 | 0 |
| D | 0 | 110 | 0 |
| Mode M0 | |||
|---|---|---|---|
| Quadrant | BADHDUFLAG | Total packets | Discarded packets |
| A | 0 | 11487 | 0 |
| B | 0 | 11267 | 0 |
| C | 0 | 11045 | 0 |
| D | 0 | 12185 | 0 |
| Mode M9 | |||
|---|---|---|---|
| Quadrant | BADHDUFLAG | Total packets | Discarded packets |
| A | 0 | 9 | 0 |
| B | 0 | 9 | 0 |
| C | 0 | 9 | 0 |
| D | 0 | 9 | 0 |
| Quadrant | Total seconds | Saturated seconds | Saturation percentage |
|---|---|---|---|
| A | 5356 | 115 | 2.147125% |
| B | 5356 | 126 | 2.352502% |
| C | 5356 | 112 | 2.091113% |
| D | 5356 | 86 | 1.605676% |
Noise dominated data is calculated using 1-second bins in cleaned event files. If a bin has >2000 counts, and if more than 50% of those come from <1% of pixels, then it is considered to be noise-dominated and hence unusable.
| Quadrant | # 1 sec bins | Bins with >0 counts | Bins with >2000 counts | High rate bins dominated by noise | Noise dominated (total time) | Noise dominated (detector-on time) | Marked lightcurve |
|---|---|---|---|---|---|---|---|
| A | 6206 | 5356 | 0 | 0 | 0.00% | 0.00% |  |
| B | 6206 | 5356 | 0 | 0 | 0.00% | 0.00% |  |
| C | 6206 | 5356 | 0 | 0 | 0.00% | 0.00% |  |
| D | 6206 | 5356 | 0 | 0 | 0.00% | 0.00% |  |
Top three noisy pixels from each quadrant. If the there are fewer than three noisy pixels in the level2.evt file, extra rows are filled as -1
| Pixel properties | Quadrant properties | ||||||
|---|---|---|---|---|---|---|---|
| Quadrant | DetID | PixID | Counts | Sigma | Mean | Median | Sigma |
| A | 0 | 29 | 278 | 8.79 | 82 | 78 | 22.7 |
| A | 7 | 110 | 259 | 7.96 | 82 | 78 | 22.7 |
| A | 0 | 30 | 249 | 7.52 | 82 | 78 | 22.7 |
| B | 2 | 9 | 258 | 9.98 | 80 | 76 | 18.2 |
| B | 2 | 8 | 233 | 8.61 | 80 | 76 | 18.2 |
| B | 3 | 17 | 202 | 6.91 | 80 | 76 | 18.2 |
| C | 1 | 81 | 246 | 7.37 | 81 | 76 | 23.1 |
| C | 1 | 80 | 227 | 6.55 | 81 | 76 | 23.1 |
| C | 12 | 241 | 221 | 6.29 | 81 | 76 | 23.1 |
| D | 6 | 38 | 230 | 7.22 | 77 | 70 | 22.2 |
| D | 1 | 3 | 213 | 6.45 | 77 | 70 | 22.2 |
| D | 13 | 238 | 211 | 6.36 | 77 | 70 | 22.2 |
Histogram calculated using DETX and DETY for each event in the final _common_clean file
| Quadrant A | 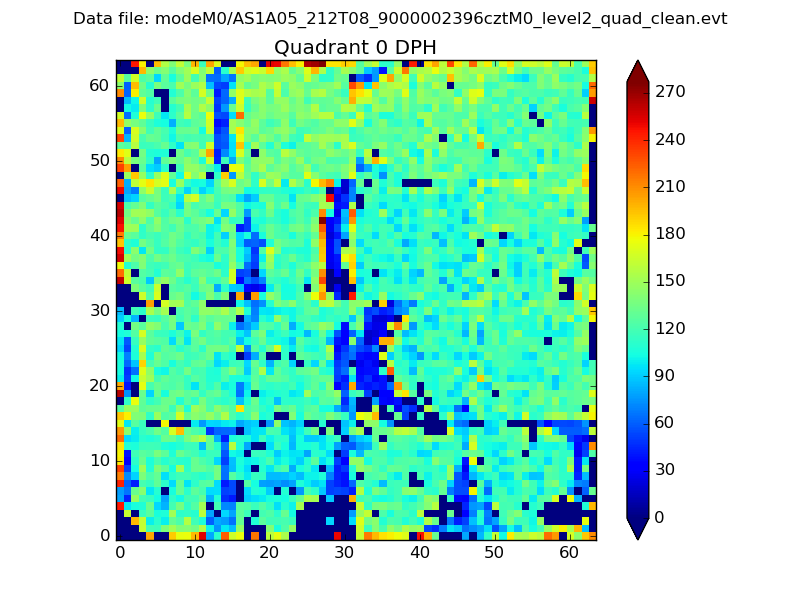 |
 |
Quadrant B |
|---|---|---|---|
| Quadrant D |  |
 |
Quadrant C |
| Plot type | Count rate plots | Images |
|---|---|---|
| Comparison with Poisson distribution Blue bars denote a histogram of data divided into 1 sec bins. Red curve is a Poisson curve with rate = median count rate of data. |
 |
 |
| Quadrant-wise count rates Data is divided into 100 sec bins |
 |
|
| Module-wise count rates for Quadrant A Data is divided into 100 sec bins |
 |
 |
| Module-wise count rates for Quadrant B Data is divided into 100 sec bins |
 |
 |
| Module-wise count rates for Quadrant C Data is divided into 100 sec bins |
 |
 |
| Module-wise count rates for Quadrant D Data is divided into 100 sec bins |
 |
 |
| Parameter | Plot |
|---|---|
| CZT HV Monitor |  |
| D_VDD |  |
| Temperature 1 |  |
| Veto HV Monitor |  |
| Veto LLD |  |
| Alpha Counter |  |
| _CPM_Rate |  |
| CZT Counter |  |
| +2.5 Volts monitor |  |
| +5 Volts monitor |  |
| _ROLL_ROT |  |
| _Roll_DEC |  |
| _Roll_RA |  |
| Veto Counter |  |