| Param | Original file | Final file |
|---|---|---|
| Filename | modeM0/AS1A05_212T08_9000002396_16287cztM0_level2.evt | modeM0/AS1A05_212T08_9000002396_16287cztM0_level2_quad_clean.evt |
| Size (bytes) | 320,883,840 | 70,750,080 |
| Size | 306.0 MB | 67.5 MB |
| Events in quadrant A | 2,329,103 | 458,576 |
| Events in quadrant B | 2,325,518 | 463,189 |
| Events in quadrant C | 2,208,884 | 445,312 |
| Events in quadrant D | 2,528,167 | 439,370 |
| Mode SS | |||
|---|---|---|---|
| Quadrant | BADHDUFLAG | Total packets | Discarded packets |
| A | 0 | 96 | 0 |
| B | 0 | 96 | 0 |
| C | 0 | 96 | 0 |
| D | 0 | 96 | 0 |
| Mode M0 | |||
|---|---|---|---|
| Quadrant | BADHDUFLAG | Total packets | Discarded packets |
| A | 0 | 10060 | 0 |
| B | 0 | 9801 | 0 |
| C | 0 | 9606 | 0 |
| D | 0 | 10643 | 0 |
| Quadrant | Total seconds | Saturated seconds | Saturation percentage |
|---|---|---|---|
| A | 4783 | 12 | 0.250889% |
| B | 4783 | 11 | 0.229981% |
| C | 4783 | 14 | 0.292703% |
| D | 4783 | 13 | 0.271796% |
Noise dominated data is calculated using 1-second bins in cleaned event files. If a bin has >2000 counts, and if more than 50% of those come from <1% of pixels, then it is considered to be noise-dominated and hence unusable.
| Quadrant | # 1 sec bins | Bins with >0 counts | Bins with >2000 counts | High rate bins dominated by noise | Noise dominated (total time) | Noise dominated (detector-on time) | Marked lightcurve |
|---|---|---|---|---|---|---|---|
| A | 4784 | 4784 | 6 | 6 | 0.13% | 0.13% | 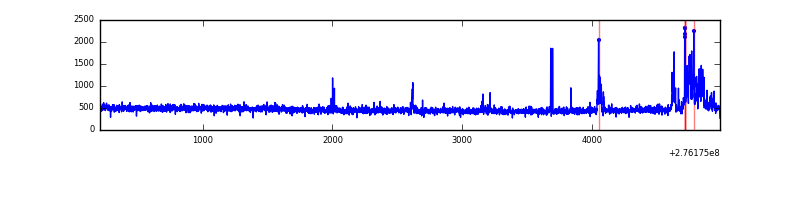 |
| B | 4784 | 4784 | 3 | 3 | 0.06% | 0.06% | 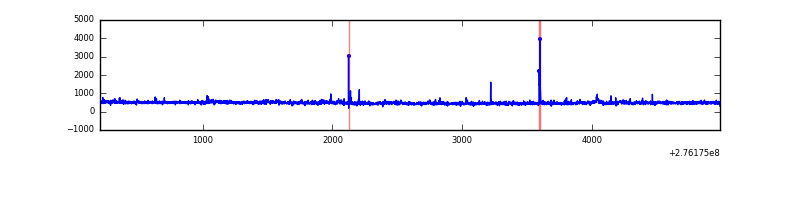 |
| C | 4784 | 4784 | 0 | 0 | 0.00% | 0.00% | 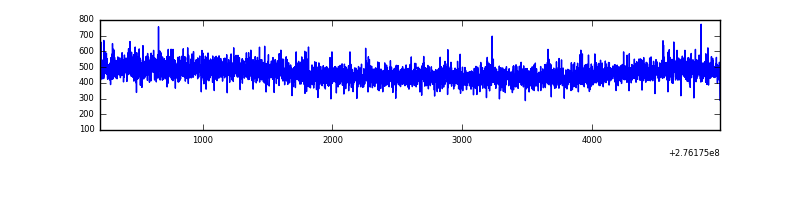 |
| D | 4784 | 4784 | 11 | 11 | 0.23% | 0.23% | 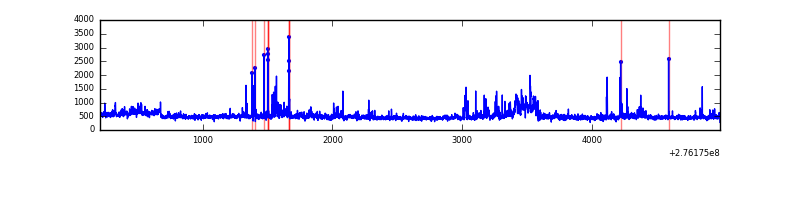 |
Top three noisy pixels from each quadrant. If the there are fewer than three noisy pixels in the level2.evt file, extra rows are filled as -1
| Pixel properties | Quadrant properties | ||||||
|---|---|---|---|---|---|---|---|
| Quadrant | DetID | PixID | Counts | Sigma | Mean | Median | Sigma |
| A | 15 | 174 | 138405 | 1213.34 | 563 | 551 | 113.6 |
| A | 9 | 143 | 15986 | 135.85 | 563 | 551 | 113.6 |
| A | 13 | 248 | 7289 | 59.31 | 563 | 551 | 113.6 |
| B | 0 | 198 | 60336 | 551.57 | 562 | 549 | 108.4 |
| B | 0 | 189 | 29284 | 265.1 | 562 | 549 | 108.4 |
| B | 12 | 111 | 12270 | 108.13 | 562 | 549 | 108.4 |
| C | 14 | 238 | 84441 | 657.56 | 541 | 546 | 127.6 |
| C | 3 | 233 | 7708 | 56.14 | 541 | 546 | 127.6 |
| C | 0 | 207 | 5597 | 39.59 | 541 | 546 | 127.6 |
| D | 1 | 52 | 154132 | 1131.18 | 550 | 534 | 135.8 |
| D | 7 | 38 | 132707 | 973.39 | 550 | 534 | 135.8 |
| D | 10 | 70 | 72895 | 532.91 | 550 | 534 | 135.8 |
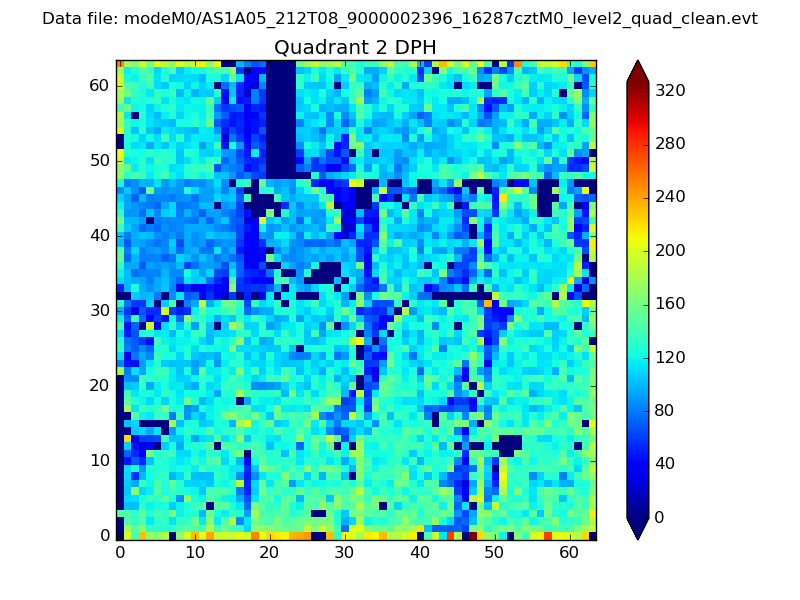
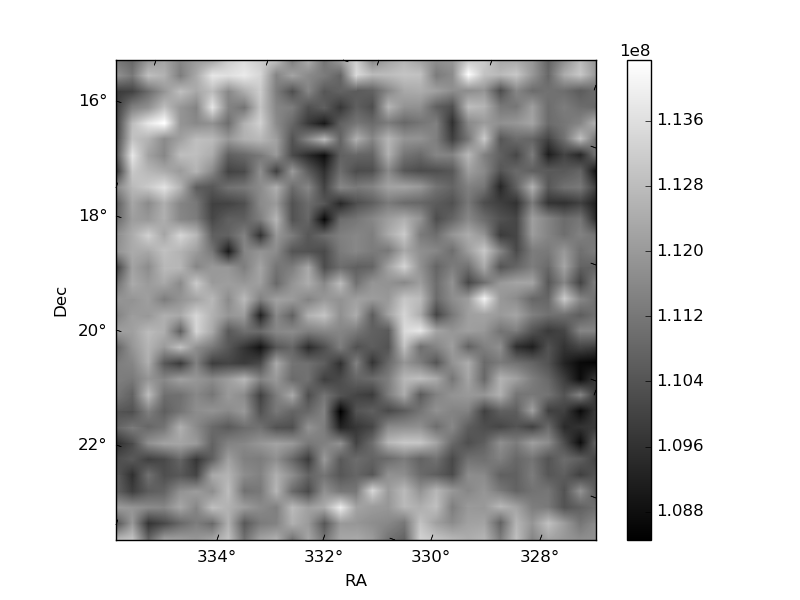
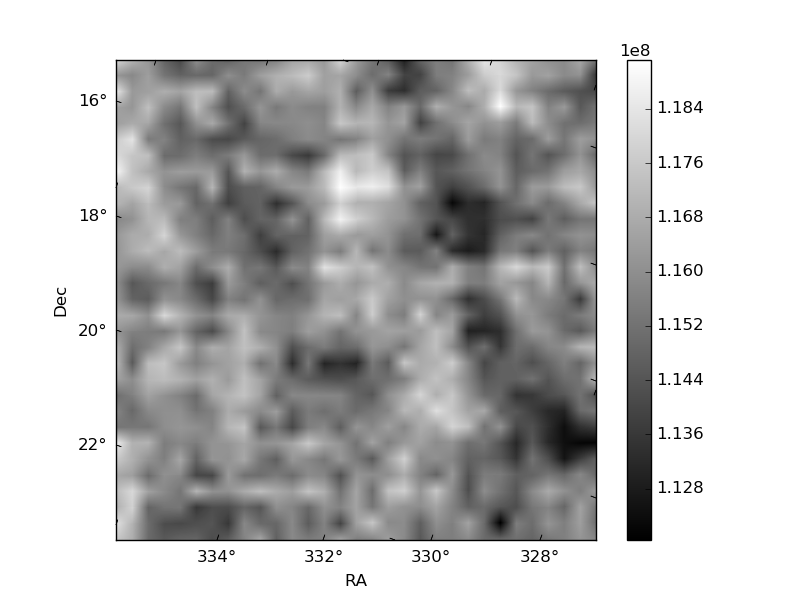
Histogram calculated using DETX and DETY for each event in the final _common_clean file
| Quadrant A | 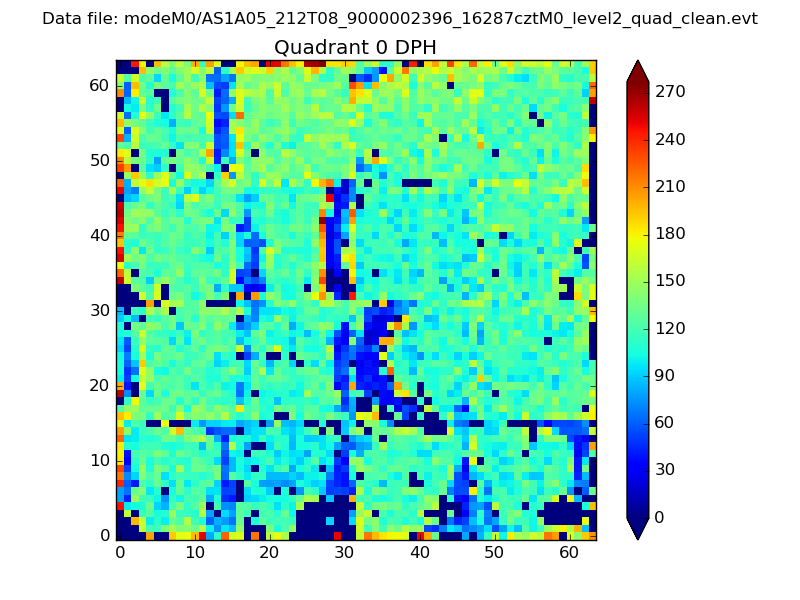 |
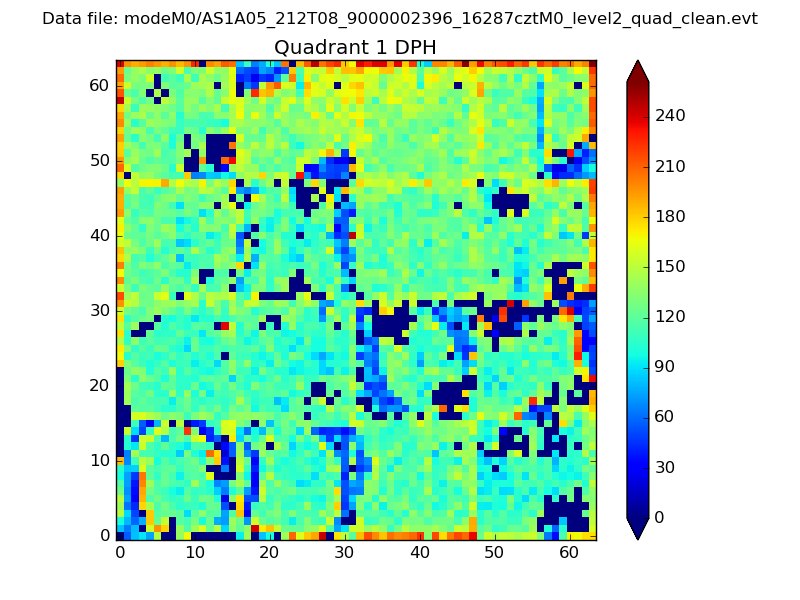 |
Quadrant B |
|---|---|---|---|
| Quadrant D | 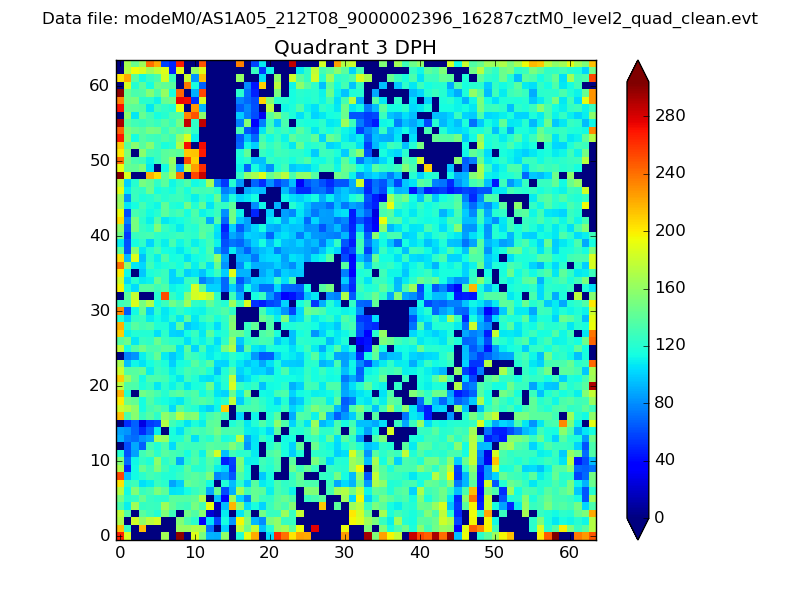 |
 |
Quadrant C |
| Plot type | Count rate plots | Images |
|---|---|---|
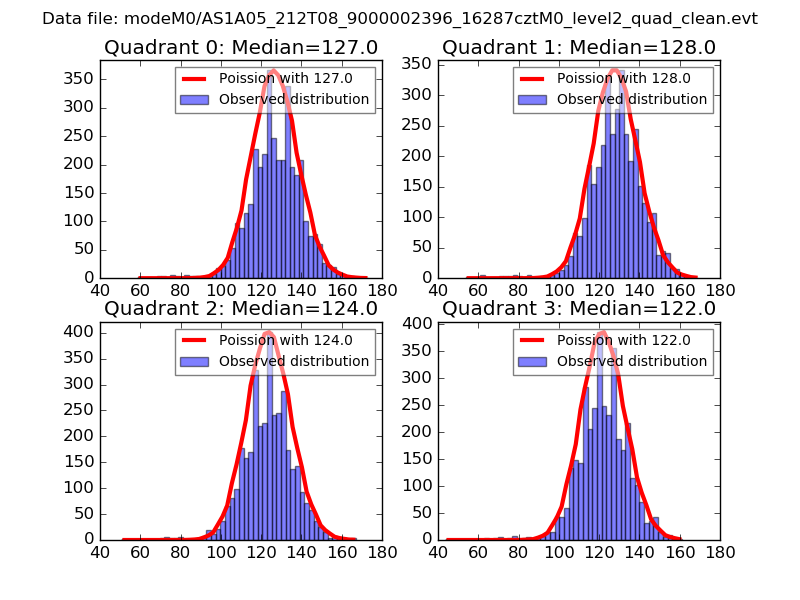
| Comparison with Poisson distribution Blue bars denote a histogram of data divided into 1 sec bins. Red curve is a Poisson curve with rate = median count rate of data. |
 |
 |
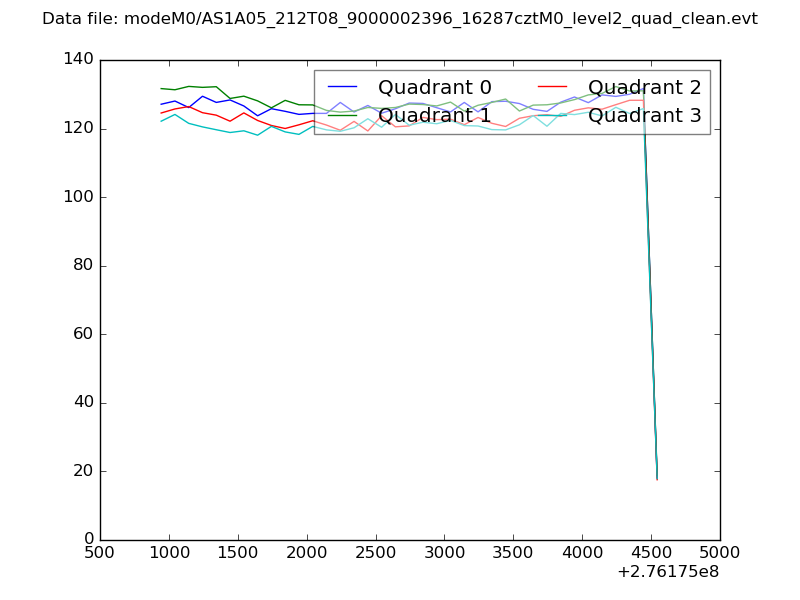
| Quadrant-wise count rates Data is divided into 100 sec bins |
 |
|
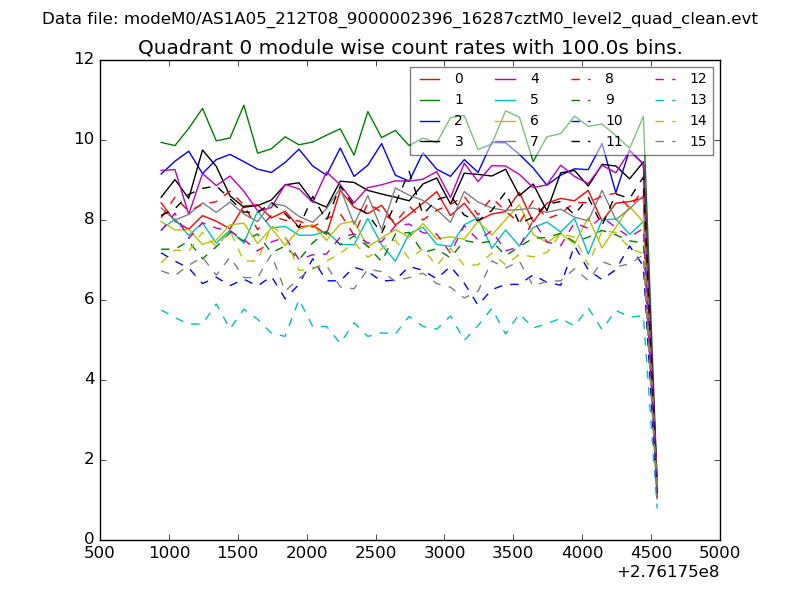
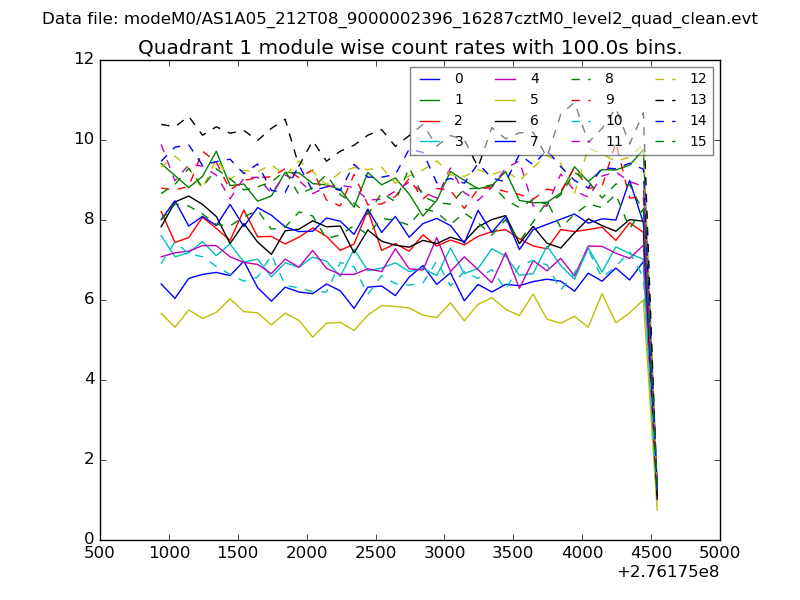
| Module-wise count rates for Quadrant A Data is divided into 100 sec bins |
 |
 |
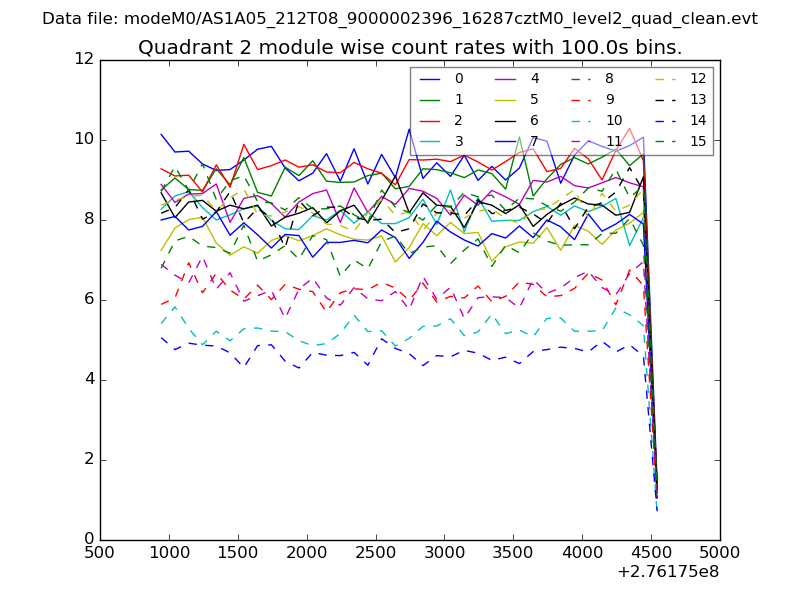
| Module-wise count rates for Quadrant B Data is divided into 100 sec bins |
 |
 |
| Module-wise count rates for Quadrant C Data is divided into 100 sec bins |
 |
 |
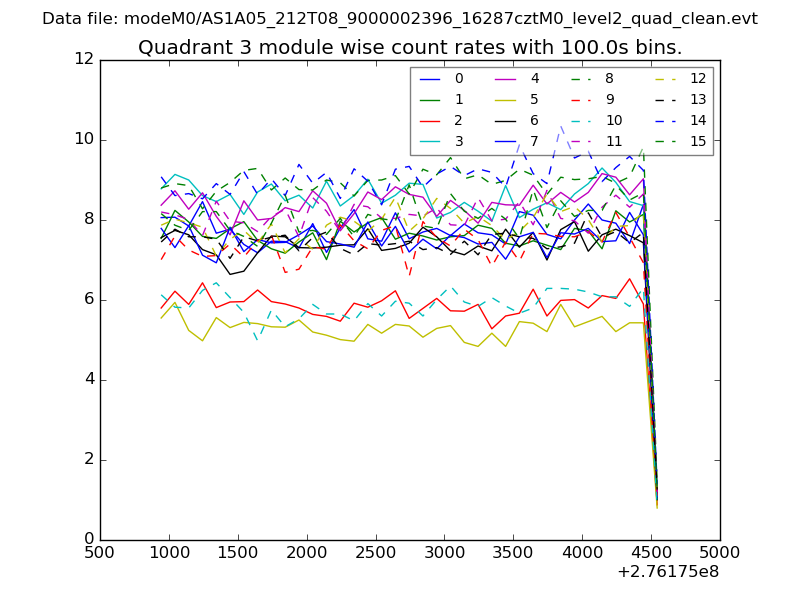
| Module-wise count rates for Quadrant D Data is divided into 100 sec bins |
 |
 |
| Parameter | Plot |
|---|---|
| CZT HV Monitor | 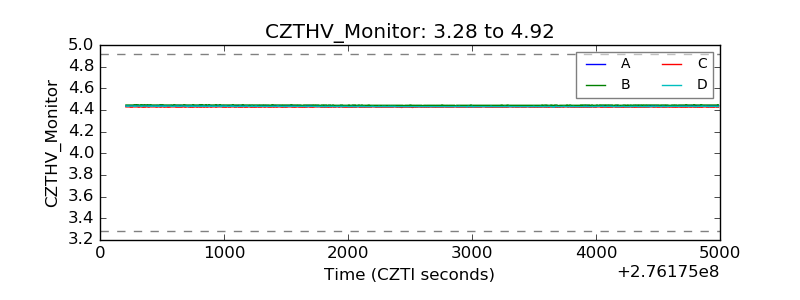 |
| D_VDD | 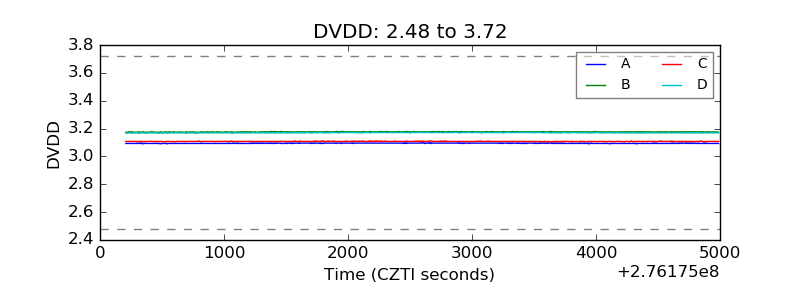 |
| Temperature 1 | 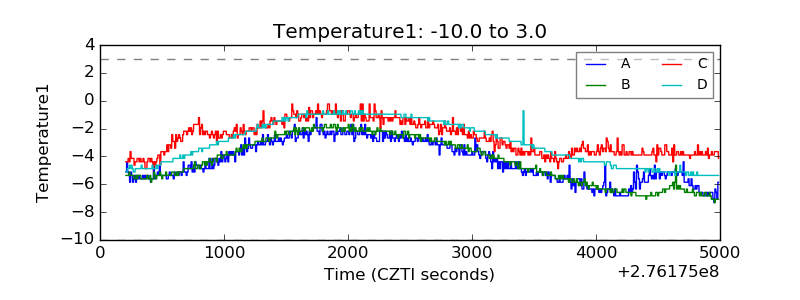 |
| Veto HV Monitor | 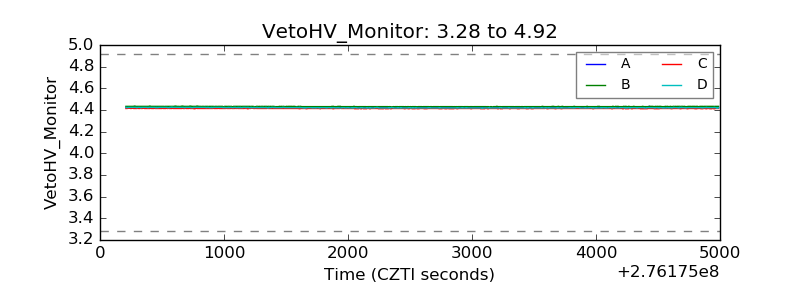 |
| Veto LLD | 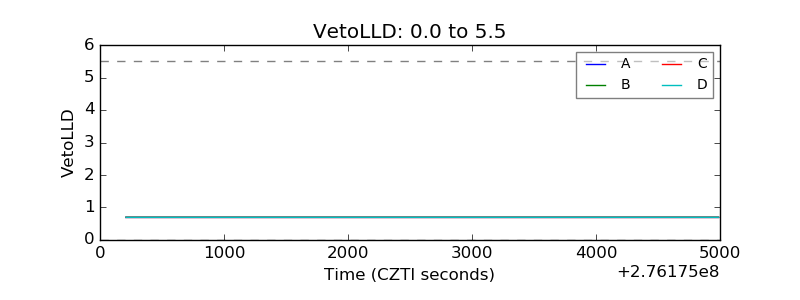 |
| Alpha Counter | 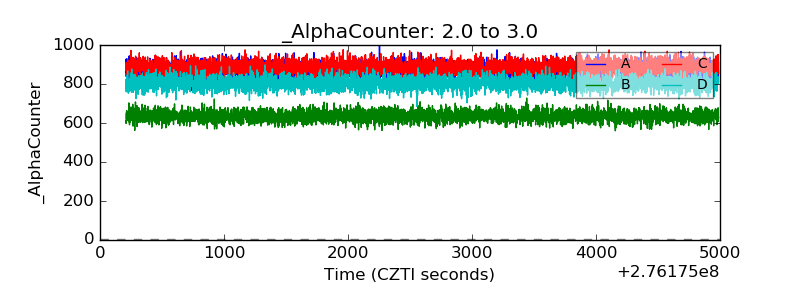 |
| _CPM_Rate | 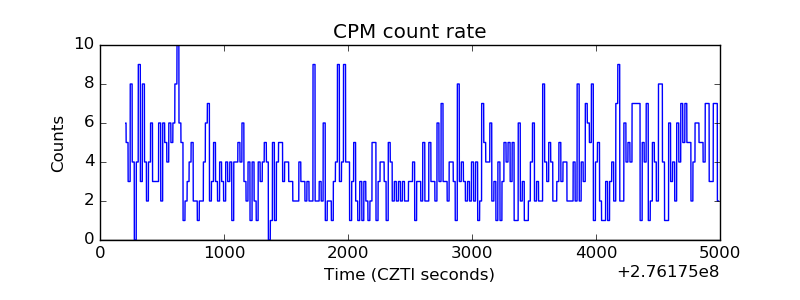 |
| CZT Counter | 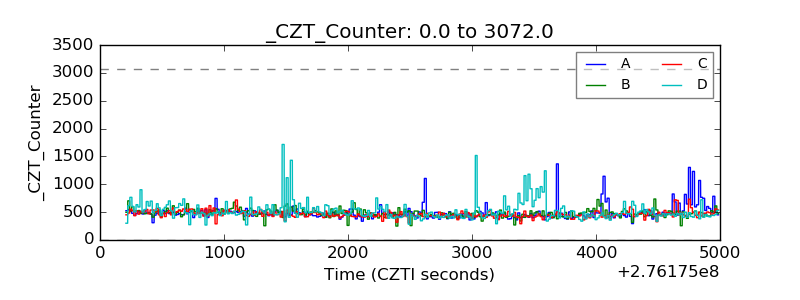 |
| +2.5 Volts monitor |  |
| +5 Volts monitor |  |
| _ROLL_ROT | 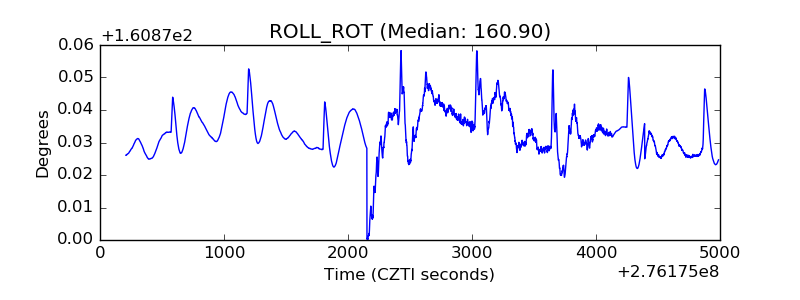 |
| _Roll_DEC | 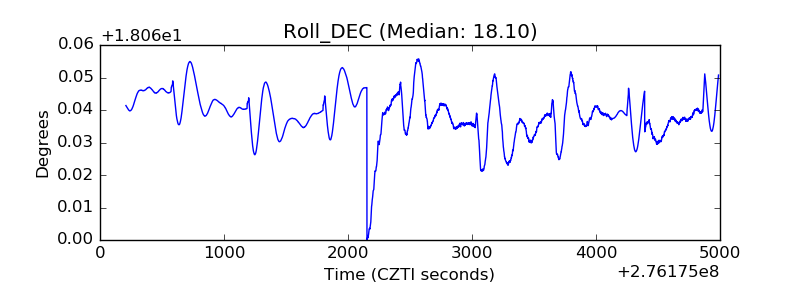 |
| _Roll_RA | 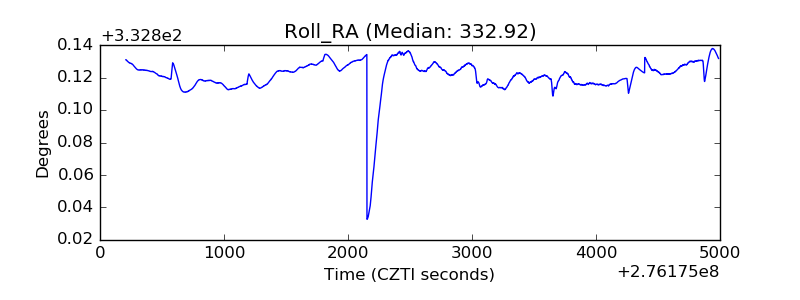 |
| Veto Counter | 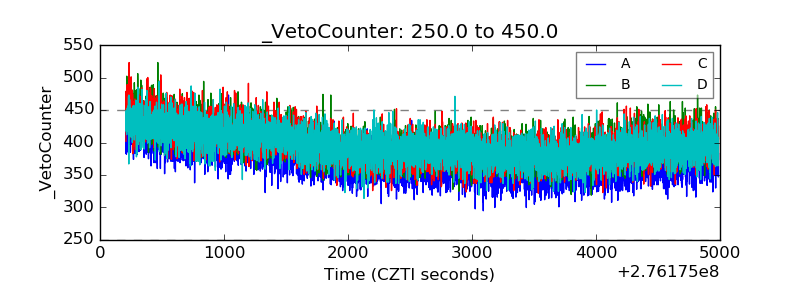 |