| Param | Original file | Final file |
|---|---|---|
| Filename | modeM0/AS1A05_212T09_9000002398cztM0_level2.fits | modeM0/AS1A05_212T09_9000002398cztM0_level2_quad_clean.evt |
| Size (bytes) | 52,153,920 | 28,929,600 |
| Size | 49.7 MB | 27.6 MB |
| Events in quadrant A | 312,574 | 128,168 |
| Events in quadrant B | 300,332 | 127,772 |
| Events in quadrant C | 307,830 | 120,366 |
| Events in quadrant D | 271,682 | 111,253 |
| Mode M0 | |||
|---|---|---|---|
| Quadrant | BADHDUFLAG | Total packets | Discarded packets |
| A | 0 | 11453 | 0 |
| B | 0 | 11404 | 0 |
| C | 0 | 11279 | 0 |
| D | 0 | 11720 | 0 |
| Mode SS | |||
|---|---|---|---|
| Quadrant | BADHDUFLAG | Total packets | Discarded packets |
| A | 0 | 110 | 0 |
| B | 0 | 110 | 0 |
| C | 0 | 110 | 0 |
| D | 0 | 110 | 0 |
| Mode M9 | |||
|---|---|---|---|
| Quadrant | BADHDUFLAG | Total packets | Discarded packets |
| A | 0 | 1 | 0 |
| B | 0 | 1 | 0 |
| C | 0 | 1 | 0 |
| D | 0 | 1 | 0 |
| Quadrant | Total seconds | Saturated seconds | Saturation percentage |
|---|---|---|---|
| A | 5536 | 42 | 0.758671% |
| B | 5536 | 24 | 0.433526% |
| C | 5536 | 54 | 0.975434% |
| D | 5536 | 34 | 0.614162% |
Noise dominated data is calculated using 1-second bins in cleaned event files. If a bin has >2000 counts, and if more than 50% of those come from <1% of pixels, then it is considered to be noise-dominated and hence unusable.
| Quadrant | # 1 sec bins | Bins with >0 counts | Bins with >2000 counts | High rate bins dominated by noise | Noise dominated (total time) | Noise dominated (detector-on time) | Marked lightcurve |
|---|---|---|---|---|---|---|---|
| A | 5535 | 5535 | 0 | 0 | 0.00% | 0.00% |  |
| B | 5535 | 5535 | 0 | 0 | 0.00% | 0.00% | 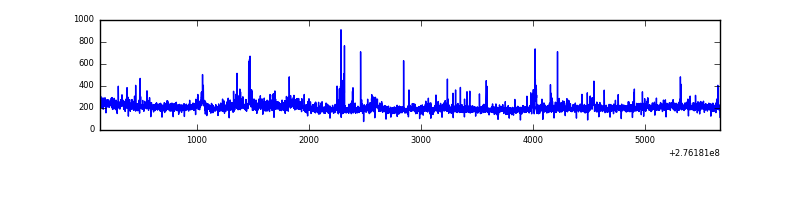 |
| C | 5535 | 5535 | 0 | 0 | 0.00% | 0.00% | 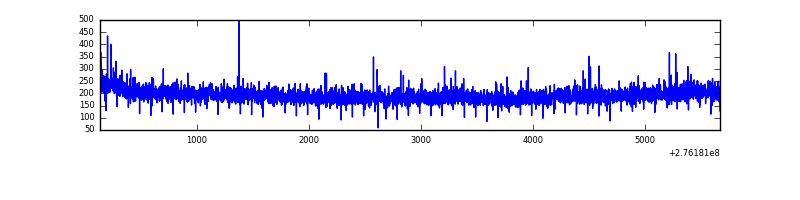 |
| D | 5535 | 5535 | 0 | 0 | 0.00% | 0.00% |  |
Top three noisy pixels from each quadrant. If the there are fewer than three noisy pixels in the level2.evt file, extra rows are filled as -1
| Pixel properties | Quadrant properties | ||||||
|---|---|---|---|---|---|---|---|
| Quadrant | DetID | PixID | Counts | Sigma | Mean | Median | Sigma |
| A | 0 | 29 | 294 | 9.72 | 81 | 77 | 22.3 |
| A | 9 | 19 | 268 | 8.55 | 81 | 77 | 22.3 |
| A | 7 | 110 | 262 | 8.28 | 81 | 77 | 22.3 |
| B | 3 | 17 | 217 | 7.91 | 79 | 76 | 17.8 |
| B | 2 | 9 | 212 | 7.63 | 79 | 76 | 17.8 |
| B | 14 | 254 | 209 | 7.46 | 79 | 76 | 17.8 |
| C | 1 | 81 | 237 | 7.06 | 81 | 76 | 22.8 |
| C | 1 | 80 | 235 | 6.97 | 81 | 76 | 22.8 |
| C | 3 | 187 | 216 | 6.14 | 81 | 76 | 22.8 |
| D | 3 | 159 | 205 | 6.03 | 77 | 70 | 22.4 |
| D | 3 | 14 | 201 | 5.85 | 77 | 70 | 22.4 |
| D | 4 | 16 | 200 | 5.81 | 77 | 70 | 22.4 |
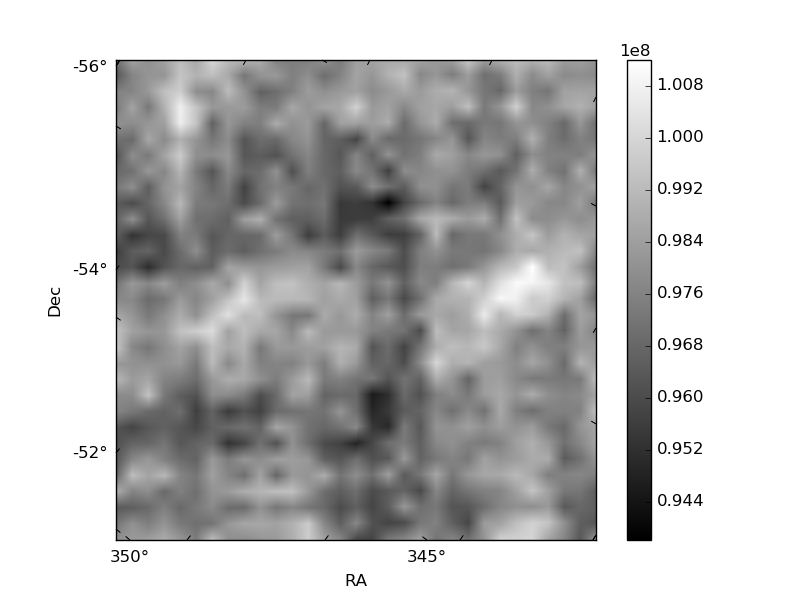
Histogram calculated using DETX and DETY for each event in the final _common_clean file
| Quadrant A | 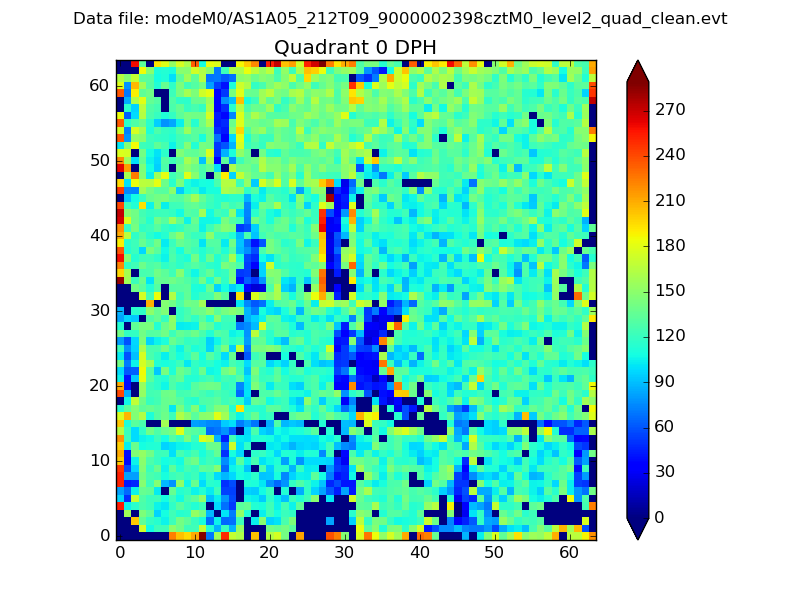 |
 |
Quadrant B |
|---|---|---|---|
| Quadrant D | 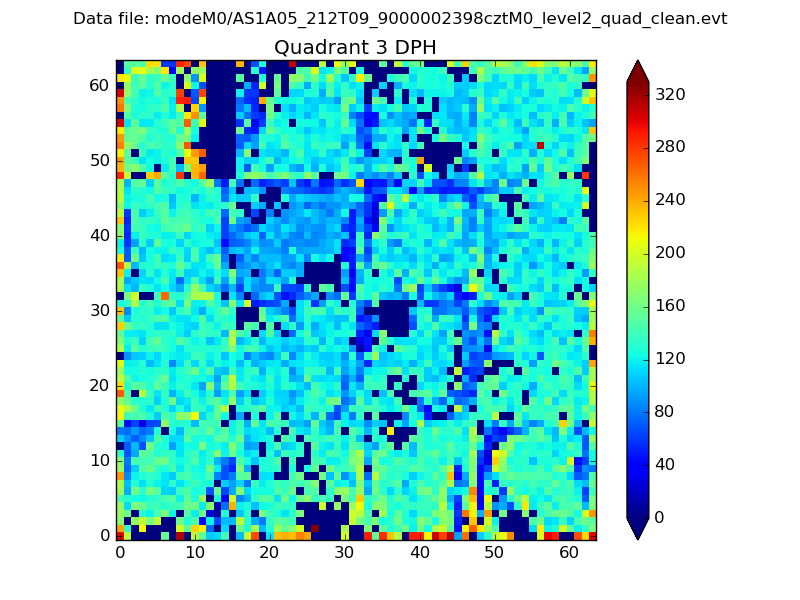 |
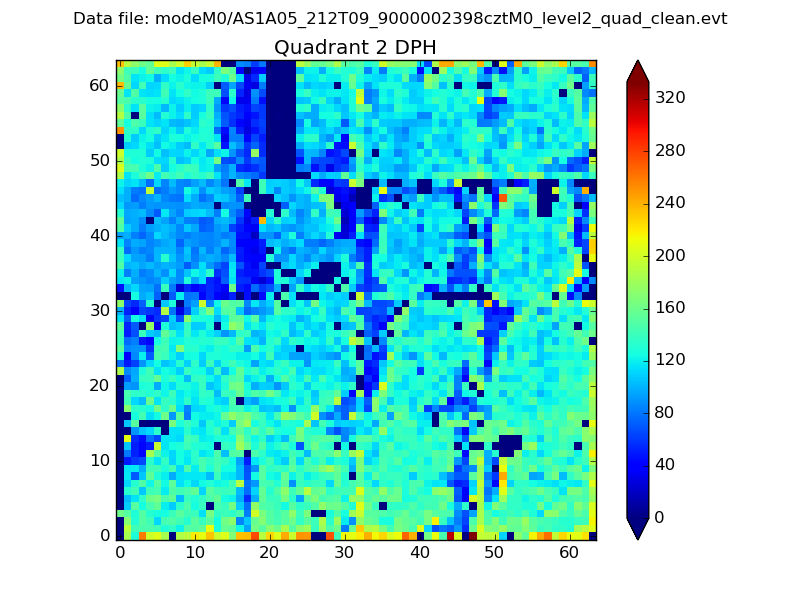 |
Quadrant C |
| Plot type | Count rate plots | Images |
|---|---|---|
| Comparison with Poisson distribution Blue bars denote a histogram of data divided into 1 sec bins. Red curve is a Poisson curve with rate = median count rate of data. |
 |
 |
| Quadrant-wise count rates Data is divided into 100 sec bins |
 |
|
| Module-wise count rates for Quadrant A Data is divided into 100 sec bins |
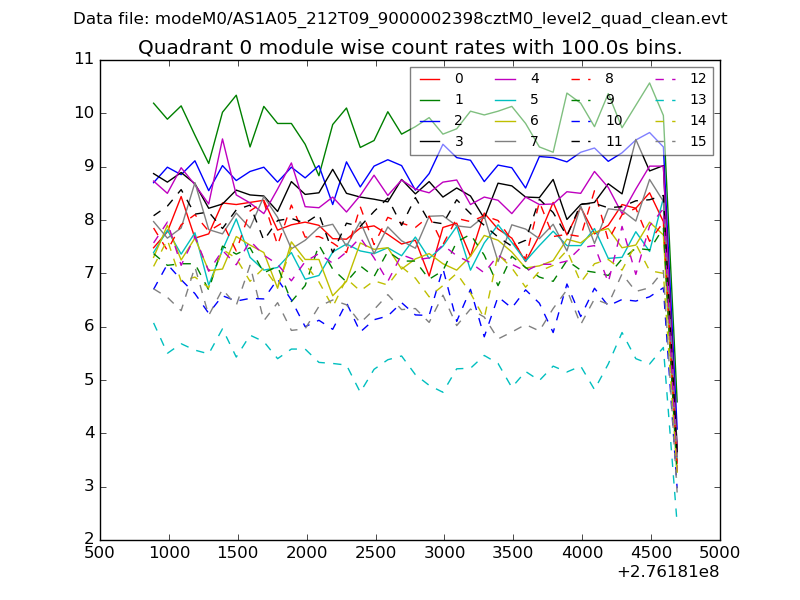 |
 |
| Module-wise count rates for Quadrant B Data is divided into 100 sec bins |
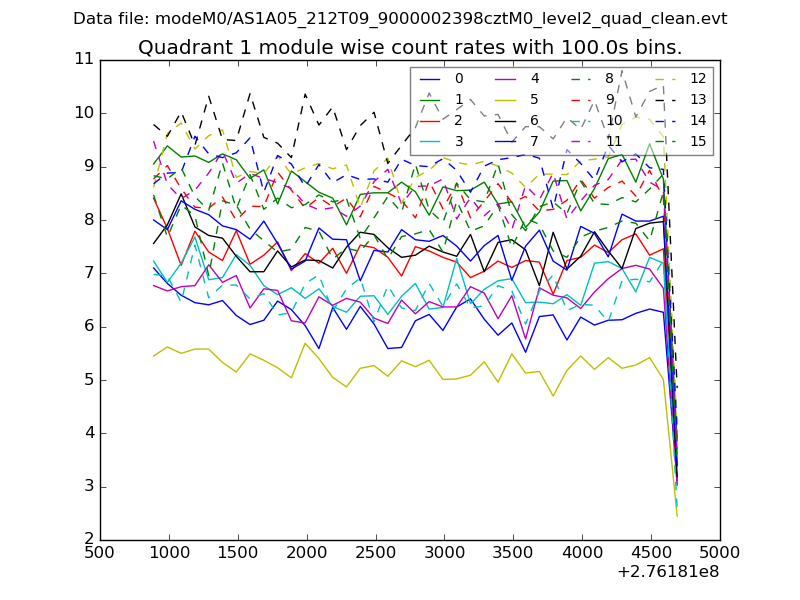 |
 |
| Module-wise count rates for Quadrant C Data is divided into 100 sec bins |
 |
 |
| Module-wise count rates for Quadrant D Data is divided into 100 sec bins |
 |
 |
| Parameter | Plot |
|---|---|
| CZT HV Monitor |  |
| D_VDD | 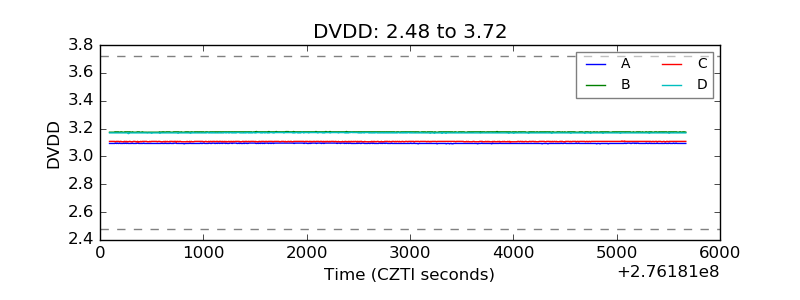 |
| Temperature 1 |  |
| Veto HV Monitor |  |
| Veto LLD |  |
| Alpha Counter |  |
| _CPM_Rate | 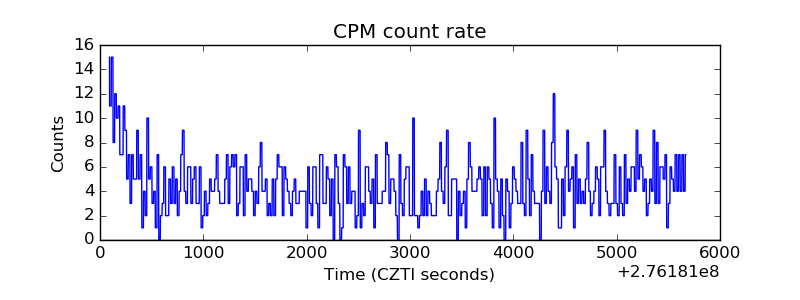 |
| CZT Counter |  |
| +2.5 Volts monitor |  |
| +5 Volts monitor | 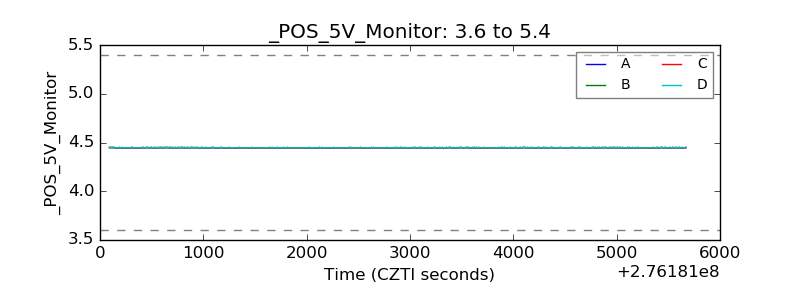 |
| _ROLL_ROT | 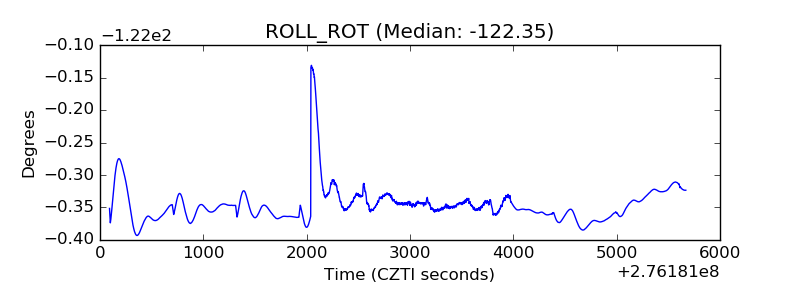 |
| _Roll_DEC |  |
| _Roll_RA |  |
| Veto Counter |  |