| Param | Original file | Final file |
|---|---|---|
| Filename | modeM0/AS1A05_212T09_9000002398_16287cztM0_level2.evt | modeM0/AS1A05_212T09_9000002398_16287cztM0_level2_quad_clean.evt |
| Size (bytes) | 113,788,800 | 16,943,040 |
| Size | 108.5 MB | 16.2 MB |
| Events in quadrant A | 848,429 | 98,268 |
| Events in quadrant B | 809,484 | 101,416 |
| Events in quadrant C | 786,321 | 100,862 |
| Events in quadrant D | 894,074 | 97,631 |
| Mode M0 | |||
|---|---|---|---|
| Quadrant | BADHDUFLAG | Total packets | Discarded packets |
| A | 0 | 3460 | 2 |
| B | 0 | 3305 | 1 |
| C | 0 | 3256 | 1 |
| D | 0 | 3596 | 1 |
| Mode SS | |||
|---|---|---|---|
| Quadrant | BADHDUFLAG | Total packets | Discarded packets |
| A | 0 | 30 | 0 |
| B | 0 | 30 | 0 |
| C | 0 | 30 | 0 |
| D | 0 | 30 | 0 |
| Mode M9 | |||
|---|---|---|---|
| Quadrant | BADHDUFLAG | Total packets | Discarded packets |
| A | 0 | 1 | 0 |
| B | 0 | 1 | 0 |
| C | 0 | 1 | 0 |
| D | 0 | 1 | 0 |
| Quadrant | Total seconds | Saturated seconds | Saturation percentage |
|---|---|---|---|
| A | 1548 | 39 | 2.519380% |
| B | 1548 | 20 | 1.291990% |
| C | 1548 | 36 | 2.325581% |
| D | 1548 | 32 | 2.067183% |
Noise dominated data is calculated using 1-second bins in cleaned event files. If a bin has >2000 counts, and if more than 50% of those come from <1% of pixels, then it is considered to be noise-dominated and hence unusable.
| Quadrant | # 1 sec bins | Bins with >0 counts | Bins with >2000 counts | High rate bins dominated by noise | Noise dominated (total time) | Noise dominated (detector-on time) | Marked lightcurve |
|---|---|---|---|---|---|---|---|
| A | 1549 | 1549 | 12 | 12 | 0.77% | 0.77% | 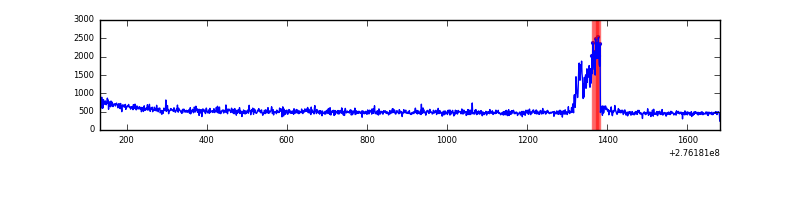 |
| B | 1549 | 1549 | 0 | 0 | 0.00% | 0.00% | 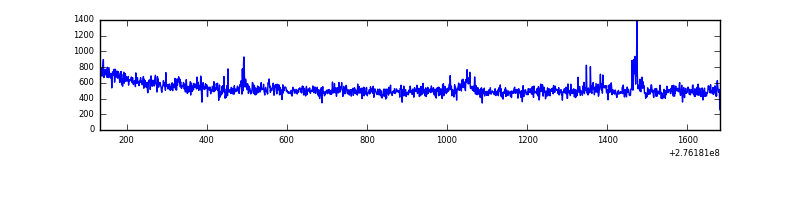 |
| C | 1549 | 1549 | 0 | 0 | 0.00% | 0.00% | 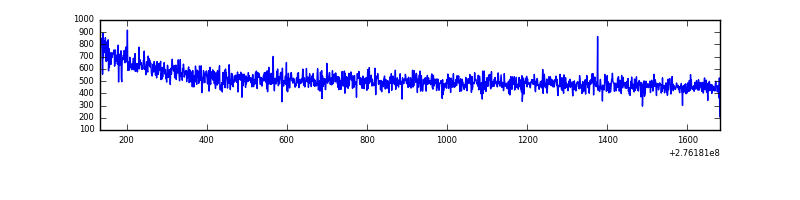 |
| D | 1549 | 1549 | 19 | 19 | 1.23% | 1.23% | 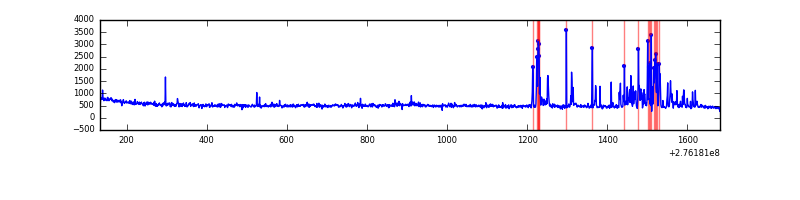 |
Top three noisy pixels from each quadrant. If the there are fewer than three noisy pixels in the level2.evt file, extra rows are filled as -1
| Pixel properties | Quadrant properties | ||||||
|---|---|---|---|---|---|---|---|
| Quadrant | DetID | PixID | Counts | Sigma | Mean | Median | Sigma |
| A | 15 | 239 | 77832 | 1831.78 | 200 | 195 | 42.4 |
| A | 0 | 226 | 1833 | 38.65 | 200 | 195 | 42.4 |
| A | 12 | 194 | 1531 | 31.52 | 200 | 195 | 42.4 |
| B | 0 | 198 | 10409 | 253.31 | 198 | 194 | 40.3 |
| B | 0 | 189 | 9147 | 222.02 | 198 | 194 | 40.3 |
| B | 3 | 64 | 8379 | 202.97 | 198 | 194 | 40.3 |
| C | 14 | 238 | 30049 | 641.42 | 192 | 193 | 46.5 |
| C | 3 | 233 | 3441 | 69.78 | 192 | 193 | 46.5 |
| C | 0 | 207 | 1803 | 34.59 | 192 | 193 | 46.5 |
| D | 10 | 70 | 124601 | 2528.74 | 196 | 190 | 49.2 |
| D | 1 | 52 | 17888 | 359.72 | 196 | 190 | 49.2 |
| D | 15 | 0 | 9488 | 188.99 | 196 | 190 | 49.2 |
Histogram calculated using DETX and DETY for each event in the final _common_clean file
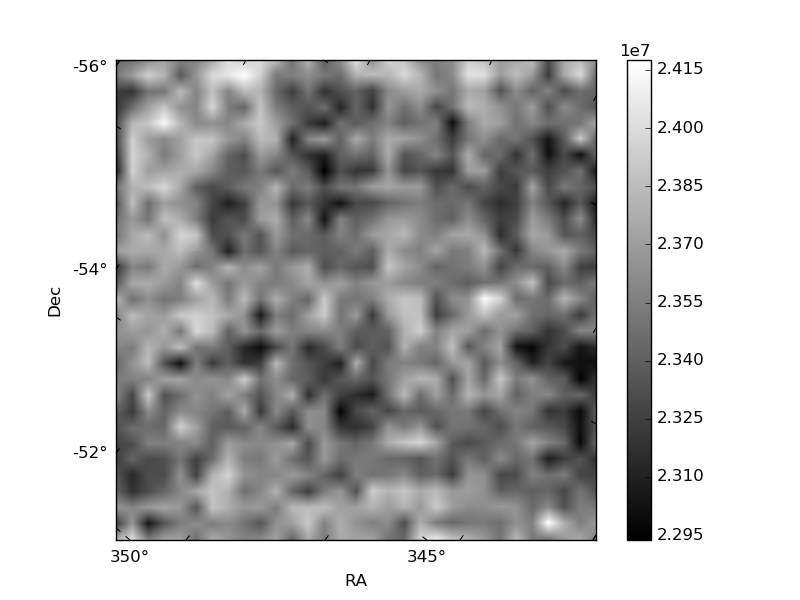
| Quadrant A | 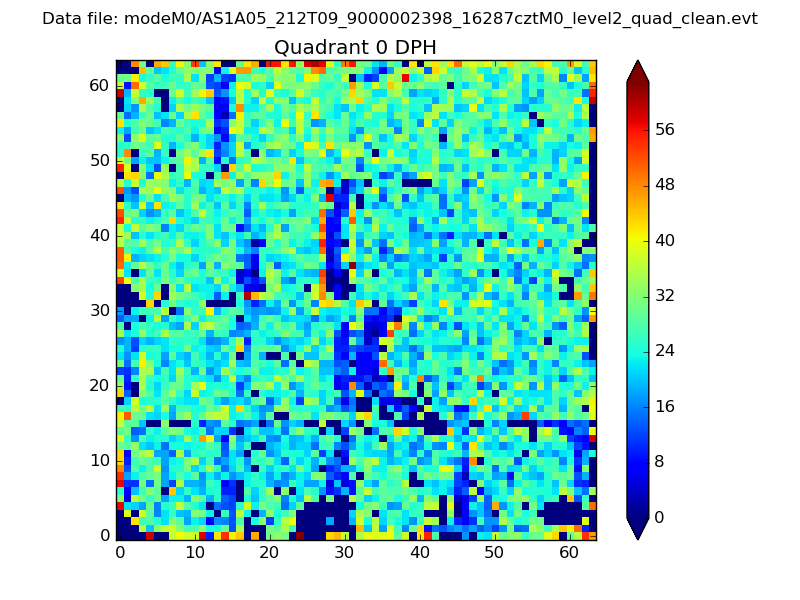 |
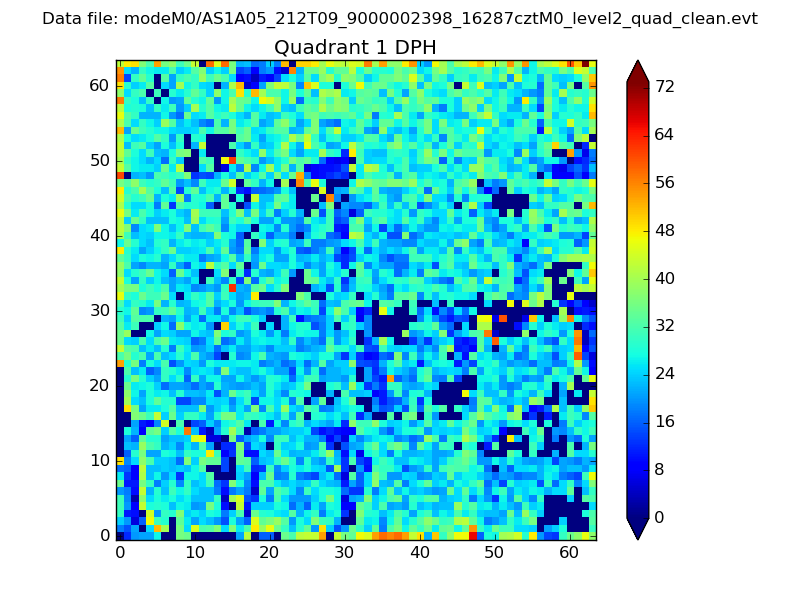 |
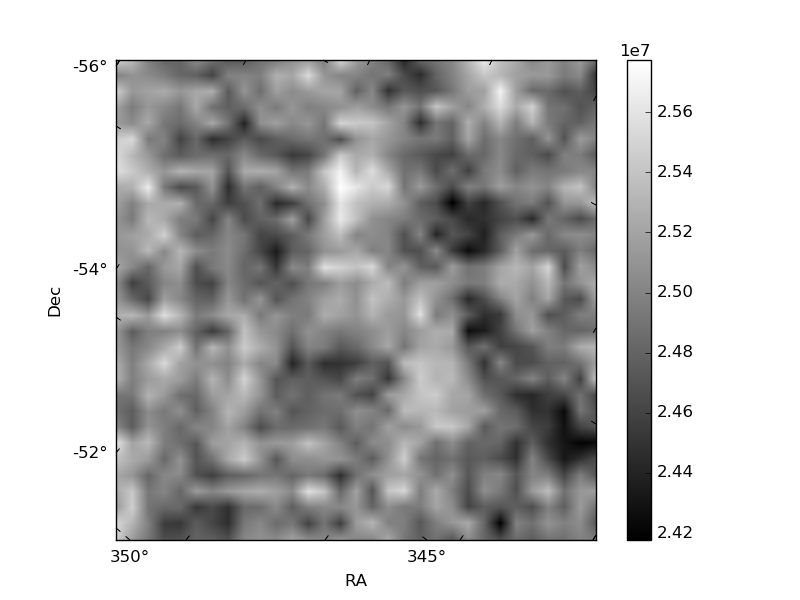
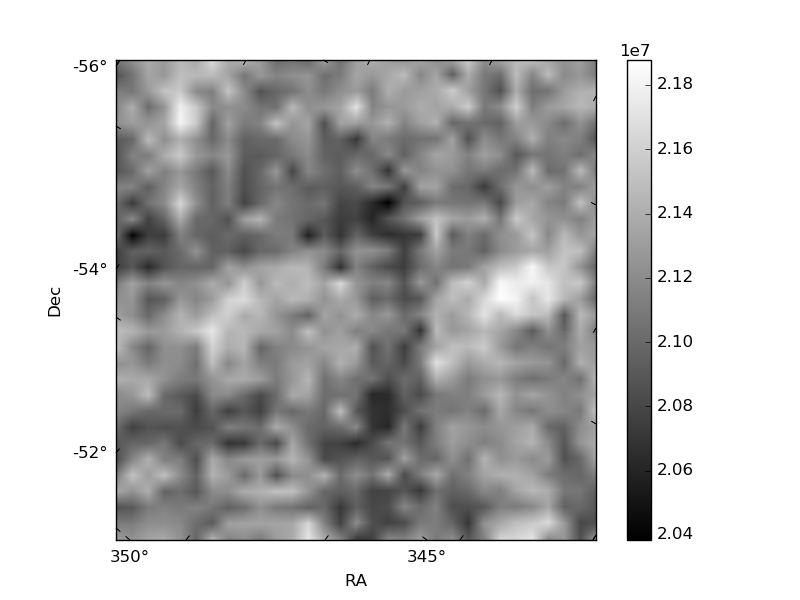
Quadrant B |
|---|---|---|---|
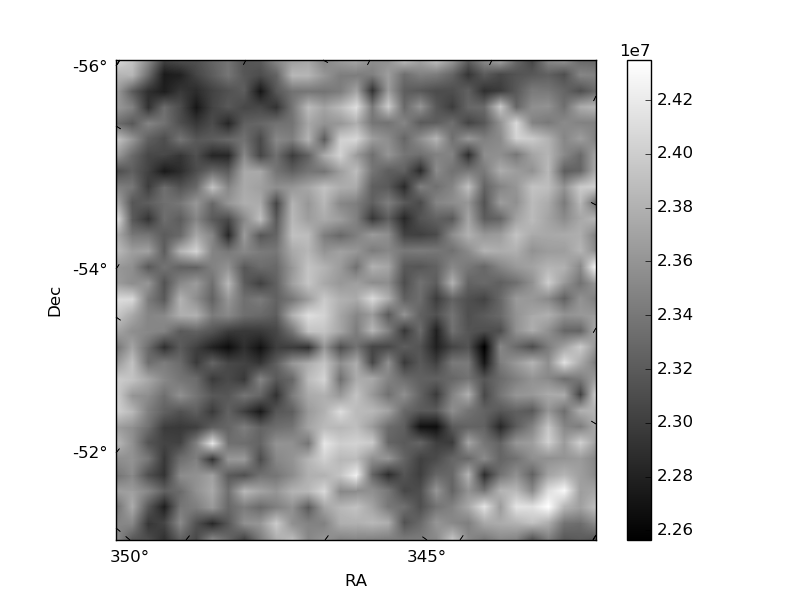
| Quadrant D | 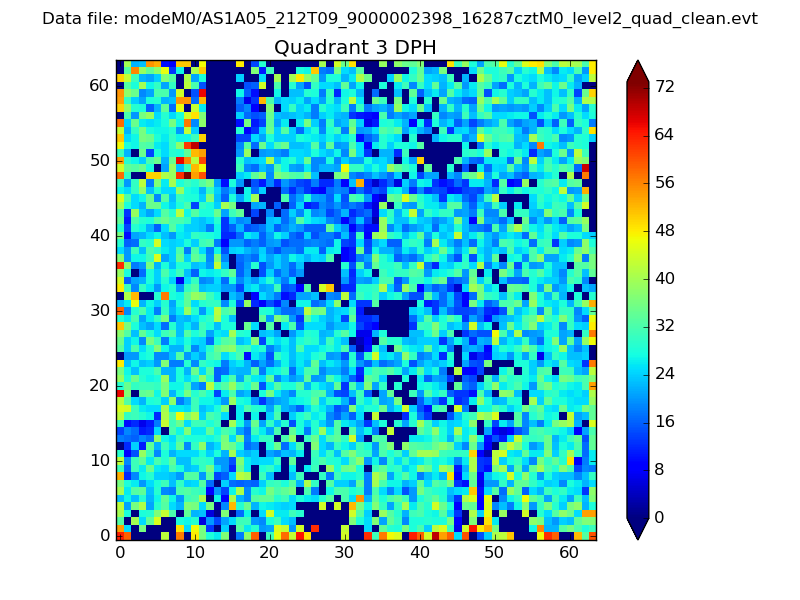 |
 |
Quadrant C |
| Plot type | Count rate plots | Images |
|---|---|---|
| Comparison with Poisson distribution Blue bars denote a histogram of data divided into 1 sec bins. Red curve is a Poisson curve with rate = median count rate of data. |
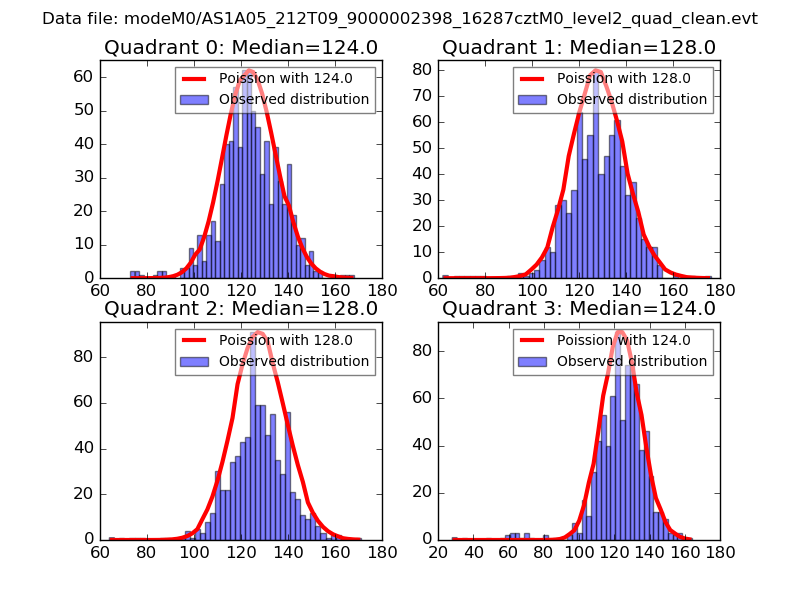 |
 |
| Quadrant-wise count rates Data is divided into 100 sec bins |
 |
|
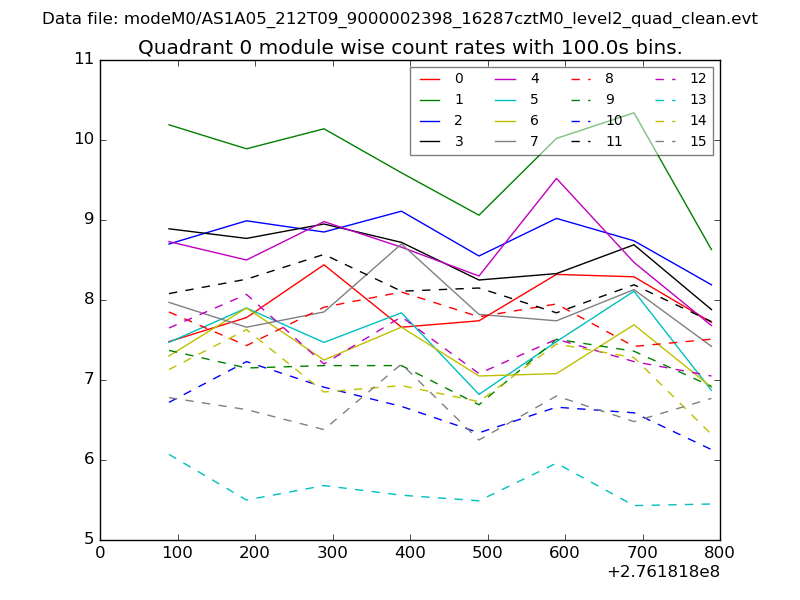
| Module-wise count rates for Quadrant A Data is divided into 100 sec bins |
 |
 |
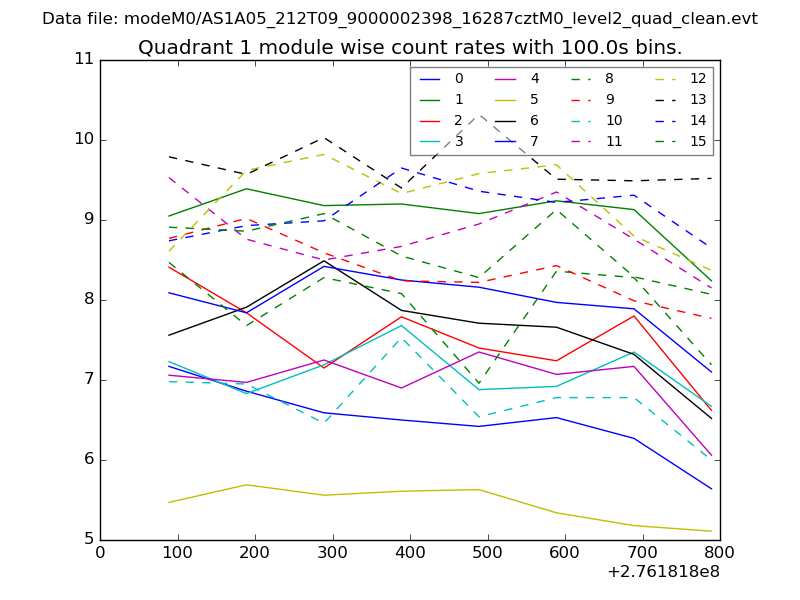
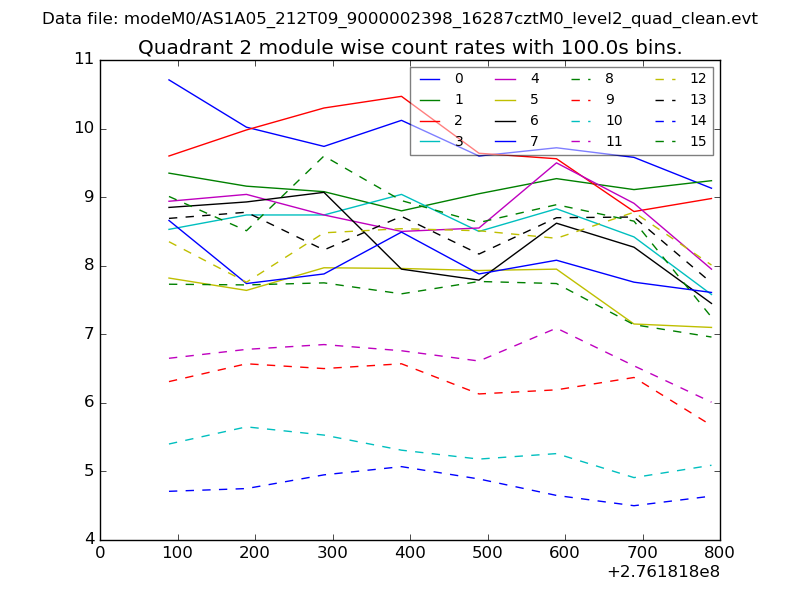
| Module-wise count rates for Quadrant B Data is divided into 100 sec bins |
 |
 |
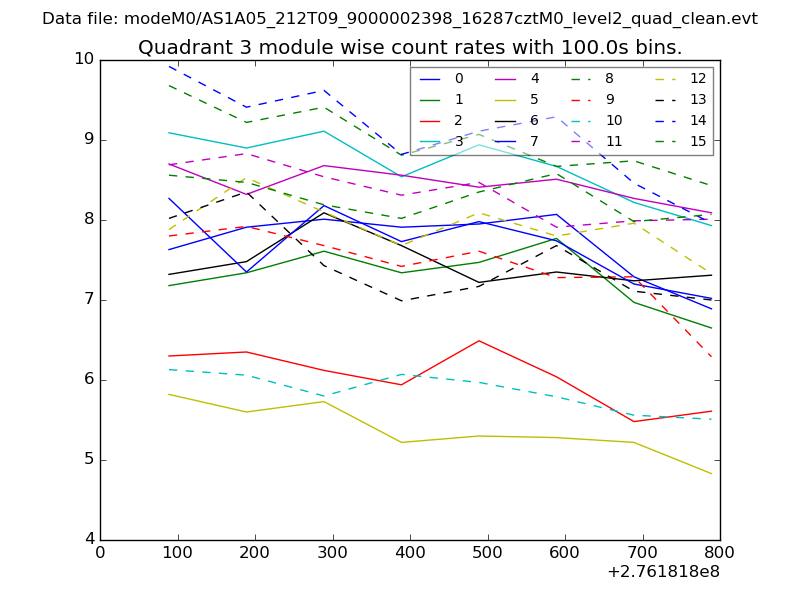
| Module-wise count rates for Quadrant C Data is divided into 100 sec bins |
 |
 |
| Module-wise count rates for Quadrant D Data is divided into 100 sec bins |
 |
 |
| Parameter | Plot |
|---|---|
| CZT HV Monitor | 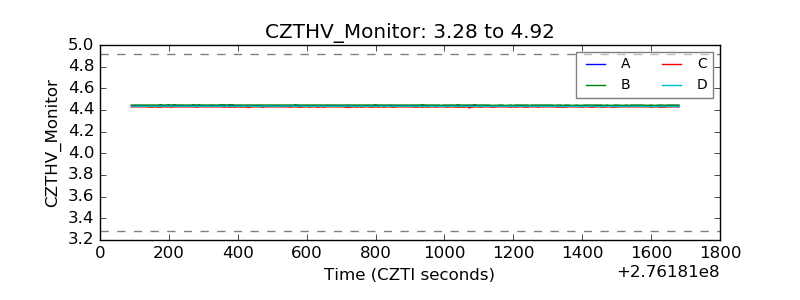 |
| D_VDD | 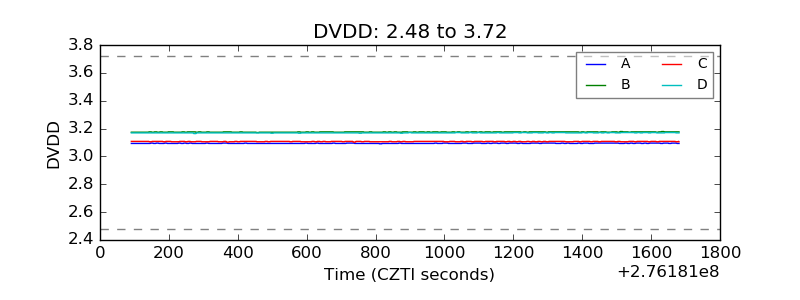 |
| Temperature 1 | 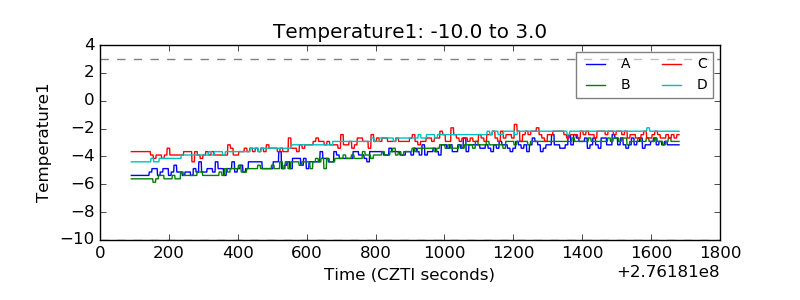 |
| Veto HV Monitor | 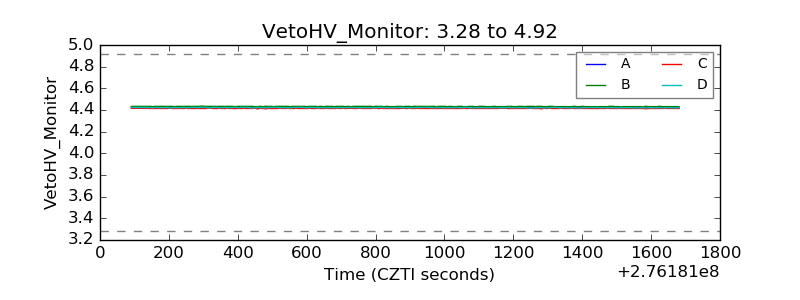 |
| Veto LLD | 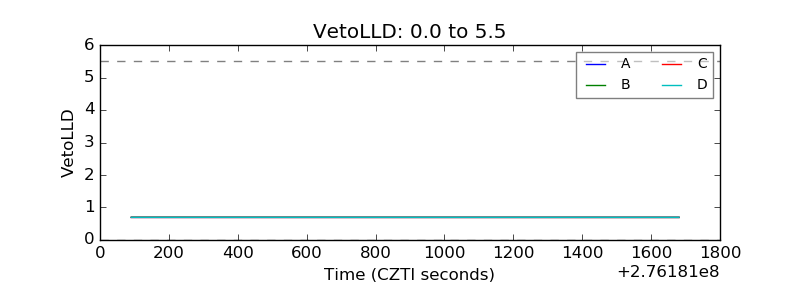 |
| Alpha Counter | 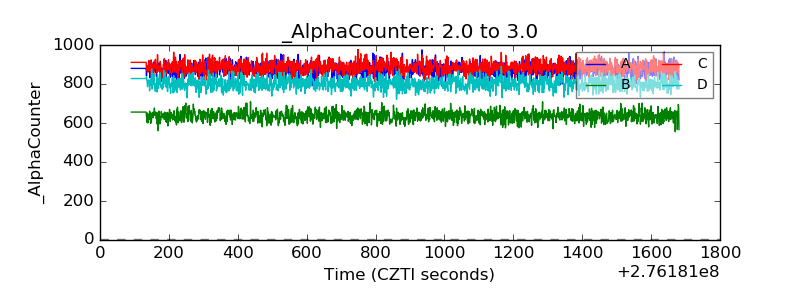 |
| _CPM_Rate | 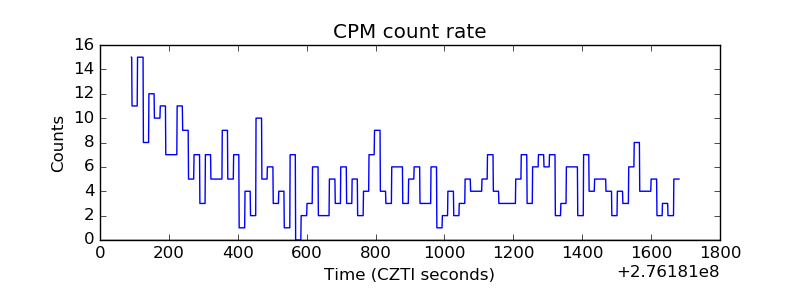 |
| CZT Counter |  |
| +2.5 Volts monitor |  |
| +5 Volts monitor |  |
| _ROLL_ROT | 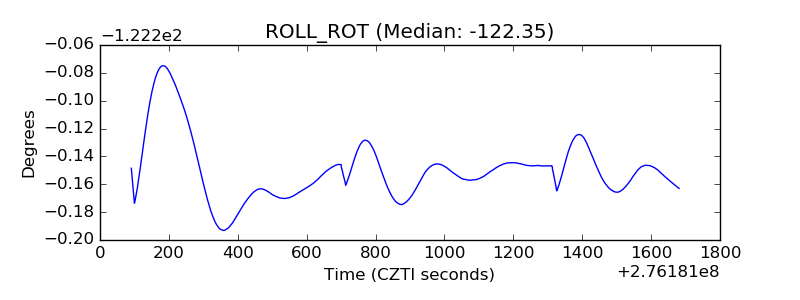 |
| _Roll_DEC | 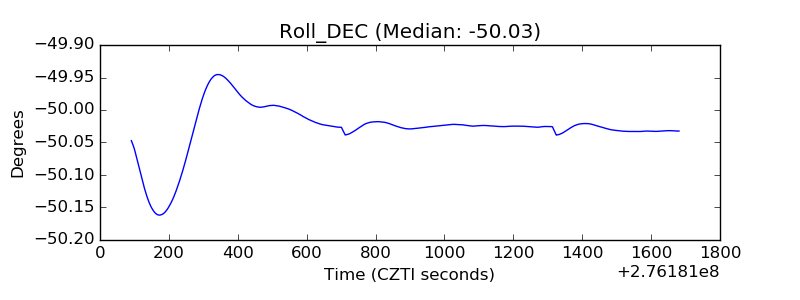 |
| _Roll_RA |  |
| Veto Counter | 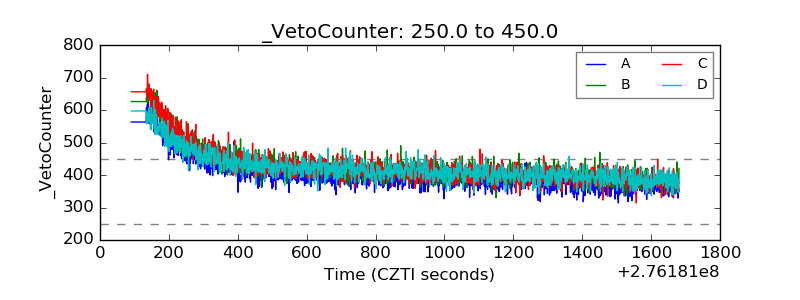 |