| Param | Original file | Final file |
|---|---|---|
| Filename | modeM0/AS1A05_225T04_9000002400cztM0_level2.fits | modeM0/AS1A05_225T04_9000002400cztM0_level2_quad_clean.evt |
| Size (bytes) | 216,622,080 | 222,733,440 |
| Size | 206.6 MB | 212.4 MB |
| Events in quadrant A | 1,301,384 | 1,335,234 |
| Events in quadrant B | 1,257,480 | 1,336,161 |
| Events in quadrant C | 1,272,490 | 1,276,704 |
| Events in quadrant D | 1,127,884 | 1,195,677 |
| Mode SS | |||
|---|---|---|---|
| Quadrant | BADHDUFLAG | Total packets | Discarded packets |
| A | 0 | 476 | 0 |
| B | 0 | 476 | 0 |
| C | 0 | 476 | 0 |
| D | 0 | 476 | 0 |
| Mode M0 | |||
|---|---|---|---|
| Quadrant | BADHDUFLAG | Total packets | Discarded packets |
| A | 0 | 50499 | 0 |
| B | 0 | 49550 | 0 |
| C | 0 | 50204 | 0 |
| D | 0 | 50243 | 0 |
| Mode M9 | |||
|---|---|---|---|
| Quadrant | BADHDUFLAG | Total packets | Discarded packets |
| A | 0 | 23 | 0 |
| B | 0 | 23 | 0 |
| C | 0 | 23 | 0 |
| D | 0 | 23 | 0 |
| Quadrant | Total seconds | Saturated seconds | Saturation percentage |
|---|---|---|---|
| A | 23260 | 368 | 1.582115% |
| B | 23260 | 213 | 0.915735% |
| C | 23260 | 330 | 1.418745% |
| D | 23260 | 230 | 0.988822% |
Noise dominated data is calculated using 1-second bins in cleaned event files. If a bin has >2000 counts, and if more than 50% of those come from <1% of pixels, then it is considered to be noise-dominated and hence unusable.
| Quadrant | # 1 sec bins | Bins with >0 counts | Bins with >2000 counts | High rate bins dominated by noise | Noise dominated (total time) | Noise dominated (detector-on time) | Marked lightcurve |
|---|---|---|---|---|---|---|---|
| A | 25644 | 23259 | 0 | 0 | 0.00% | 0.00% |  |
| B | 25645 | 23260 | 0 | 0 | 0.00% | 0.00% | 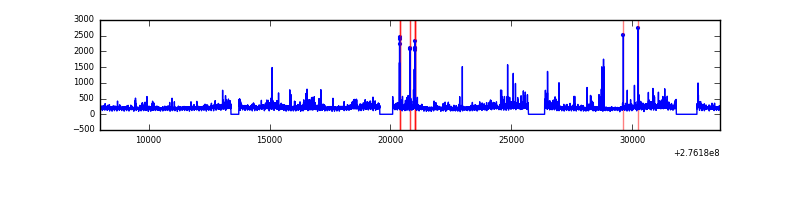 |
| C | 25645 | 23260 | 0 | 0 | 0.00% | 0.00% |  |
| D | 25644 | 23259 | 0 | 0 | 0.00% | 0.00% |  |
Top three noisy pixels from each quadrant. If the there are fewer than three noisy pixels in the level2.evt file, extra rows are filled as -1
| Pixel properties | Quadrant properties | ||||||
|---|---|---|---|---|---|---|---|
| Quadrant | DetID | PixID | Counts | Sigma | Mean | Median | Sigma |
| A | 0 | 29 | 1281 | 11.21 | 338 | 315 | 86.1 |
| A | 0 | 30 | 1042 | 8.44 | 338 | 315 | 86.1 |
| A | 7 | 110 | 1001 | 7.96 | 338 | 315 | 86.1 |
| B | 2 | 9 | 1029 | 10.6 | 331 | 315 | 67.4 |
| B | 2 | 8 | 877 | 8.34 | 331 | 315 | 67.4 |
| B | 3 | 17 | 862 | 8.12 | 331 | 315 | 67.4 |
| C | 12 | 241 | 898 | 6.66 | 336 | 314 | 87.7 |
| C | 7 | 111 | 873 | 6.38 | 336 | 314 | 87.7 |
| C | 3 | 126 | 846 | 6.07 | 336 | 314 | 87.7 |
| D | 3 | 14 | 829 | 6.1 | 321 | 291 | 88.3 |
| D | 6 | 231 | 823 | 6.03 | 321 | 291 | 88.3 |
| D | 6 | 67 | 823 | 6.03 | 321 | 291 | 88.3 |
Histogram calculated using DETX and DETY for each event in the final _common_clean file
| Quadrant A |  |
 |
Quadrant B |
|---|---|---|---|
| Quadrant D | 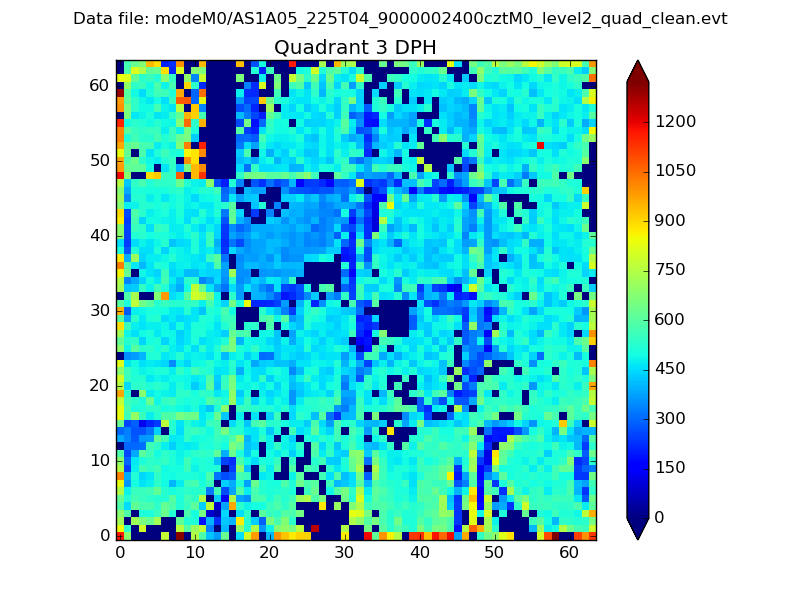 |
 |
Quadrant C |
| Plot type | Count rate plots | Images |
|---|---|---|
| Comparison with Poisson distribution Blue bars denote a histogram of data divided into 1 sec bins. Red curve is a Poisson curve with rate = median count rate of data. |
 |
 |
| Quadrant-wise count rates Data is divided into 100 sec bins |
 |
|
| Module-wise count rates for Quadrant A Data is divided into 100 sec bins |
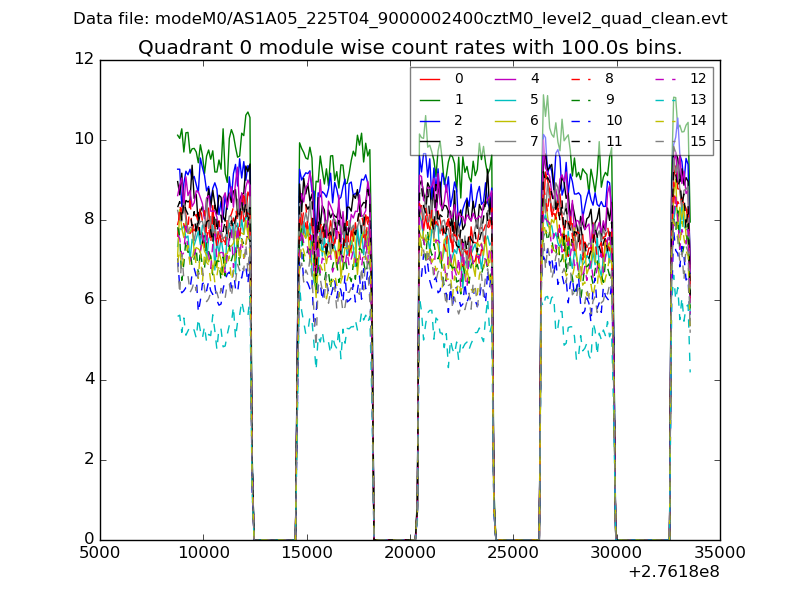 |
 |
| Module-wise count rates for Quadrant B Data is divided into 100 sec bins |
 |
 |
| Module-wise count rates for Quadrant C Data is divided into 100 sec bins |
 |
 |
| Module-wise count rates for Quadrant D Data is divided into 100 sec bins |
 |
 |
| Parameter | Plot |
|---|---|
| CZT HV Monitor |  |
| D_VDD | 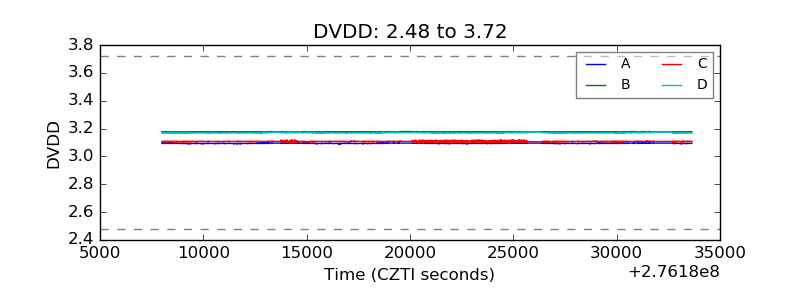 |
| Temperature 1 | 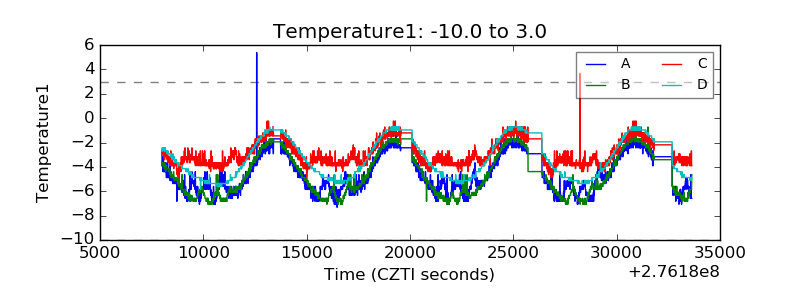 |
| Veto HV Monitor |  |
| Veto LLD |  |
| Alpha Counter |  |
| _CPM_Rate | 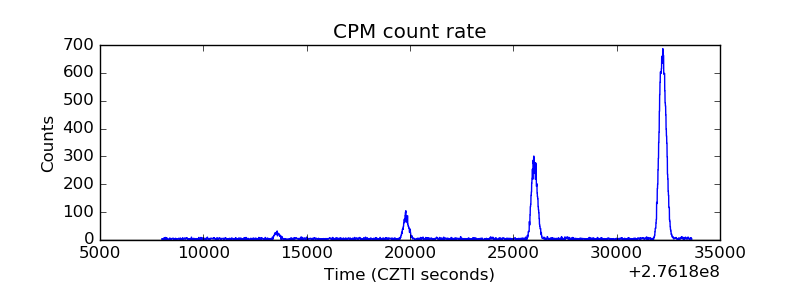 |
| CZT Counter |  |
| +2.5 Volts monitor |  |
| +5 Volts monitor |  |
| _ROLL_ROT | 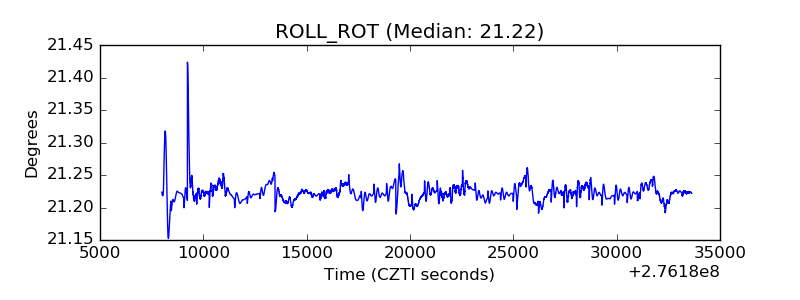 |
| _Roll_DEC |  |
| _Roll_RA | 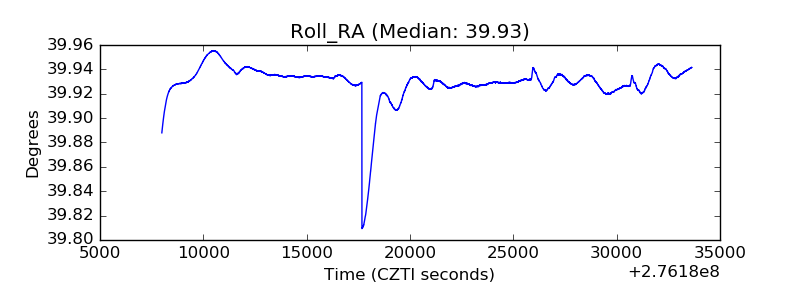 |
| Veto Counter | 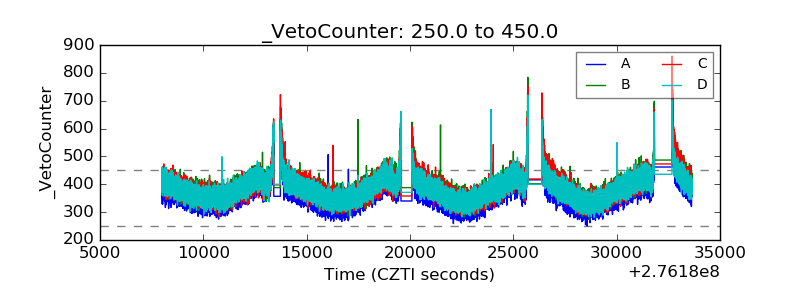 |