| Param | Original file | Final file |
|---|---|---|
| Filename | modeM0/AS1A05_225T04_9000002400_16288cztM0_level2.evt | modeM0/AS1A05_225T04_9000002400_16288cztM0_level2_quad_clean.evt |
| Size (bytes) | 74,390,400 | 6,670,080 |
| Size | 70.9 MB | 6.4 MB |
| Events in quadrant A | 489,623 | 31,429 |
| Events in quadrant B | 500,389 | 31,651 |
| Events in quadrant C | 499,706 | 29,650 |
| Events in quadrant D | 690,366 | 29,779 |
| Mode SS | |||
|---|---|---|---|
| Quadrant | BADHDUFLAG | Total packets | Discarded packets |
| A | 0 | 22 | 0 |
| B | 0 | 22 | 0 |
| C | 0 | 22 | 0 |
| D | 0 | 22 | 0 |
| Mode M0 | |||
|---|---|---|---|
| Quadrant | BADHDUFLAG | Total packets | Discarded packets |
| A | 0 | 2051 | 1 |
| B | 0 | 2055 | 0 |
| C | 0 | 2059 | 0 |
| D | 0 | 2687 | 0 |
| Quadrant | Total seconds | Saturated seconds | Saturation percentage |
|---|---|---|---|
| A | 1019 | 2 | 0.196271% |
| B | 1019 | 1 | 0.098135% |
| C | 1019 | 9 | 0.883219% |
| D | 1019 | 55 | 5.397448% |
Noise dominated data is calculated using 1-second bins in cleaned event files. If a bin has >2000 counts, and if more than 50% of those come from <1% of pixels, then it is considered to be noise-dominated and hence unusable.
| Quadrant | # 1 sec bins | Bins with >0 counts | Bins with >2000 counts | High rate bins dominated by noise | Noise dominated (total time) | Noise dominated (detector-on time) | Marked lightcurve |
|---|---|---|---|---|---|---|---|
| A | 1020 | 1020 | 0 | 0 | 0.00% | 0.00% | 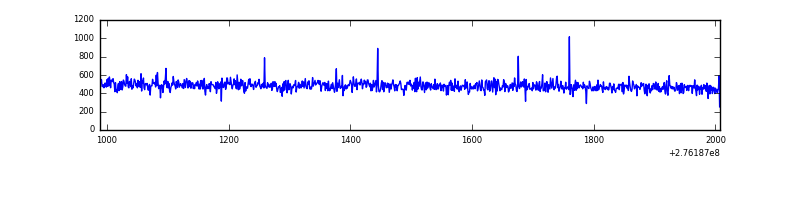 |
| B | 1020 | 1020 | 0 | 0 | 0.00% | 0.00% | 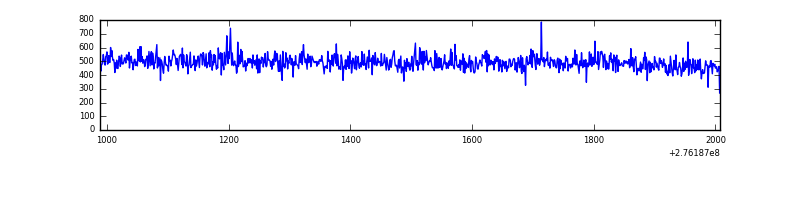 |
| C | 1020 | 1020 | 0 | 0 | 0.00% | 0.00% | 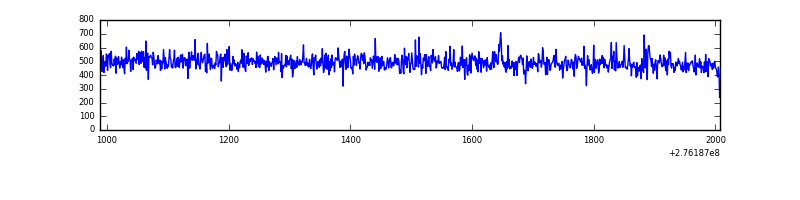 |
| D | 1020 | 1020 | 34 | 34 | 3.33% | 3.33% |  |
Top three noisy pixels from each quadrant. If the there are fewer than three noisy pixels in the level2.evt file, extra rows are filled as -1
| Pixel properties | Quadrant properties | ||||||
|---|---|---|---|---|---|---|---|
| Quadrant | DetID | PixID | Counts | Sigma | Mean | Median | Sigma |
| A | 0 | 226 | 1134 | 36.34 | 127 | 124 | 27.8 |
| A | 12 | 194 | 1002 | 31.59 | 127 | 124 | 27.8 |
| A | 3 | 137 | 917 | 28.53 | 127 | 124 | 27.8 |
| B | 0 | 198 | 3085 | 111.2 | 126 | 122 | 26.6 |
| B | 12 | 111 | 2886 | 103.73 | 126 | 122 | 26.6 |
| B | 0 | 214 | 2701 | 96.79 | 126 | 122 | 26.6 |
| C | 14 | 238 | 20393 | 668.92 | 121 | 121 | 30.3 |
| C | 3 | 233 | 3595 | 114.63 | 121 | 121 | 30.3 |
| C | 0 | 207 | 2336 | 73.09 | 121 | 121 | 30.3 |
| D | 10 | 70 | 209968 | 6476.62 | 122 | 118 | 32.4 |
| D | 1 | 52 | 20037 | 614.76 | 122 | 118 | 32.4 |
| D | 2 | 234 | 4114 | 123.33 | 122 | 118 | 32.4 |
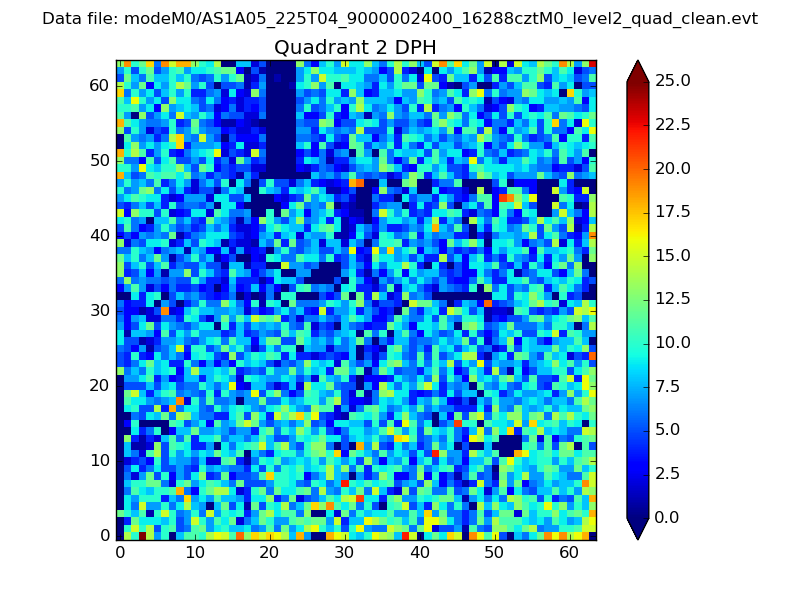
Histogram calculated using DETX and DETY for each event in the final _common_clean file
| Quadrant A | 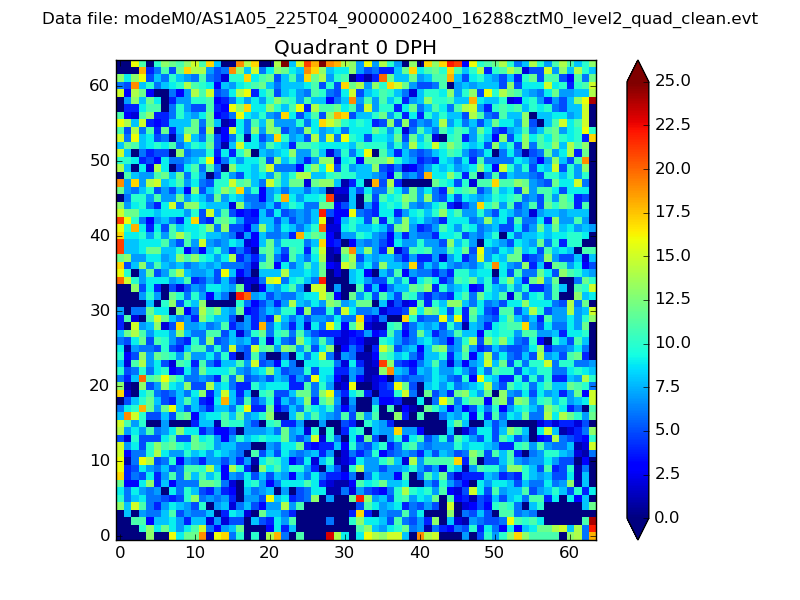 |
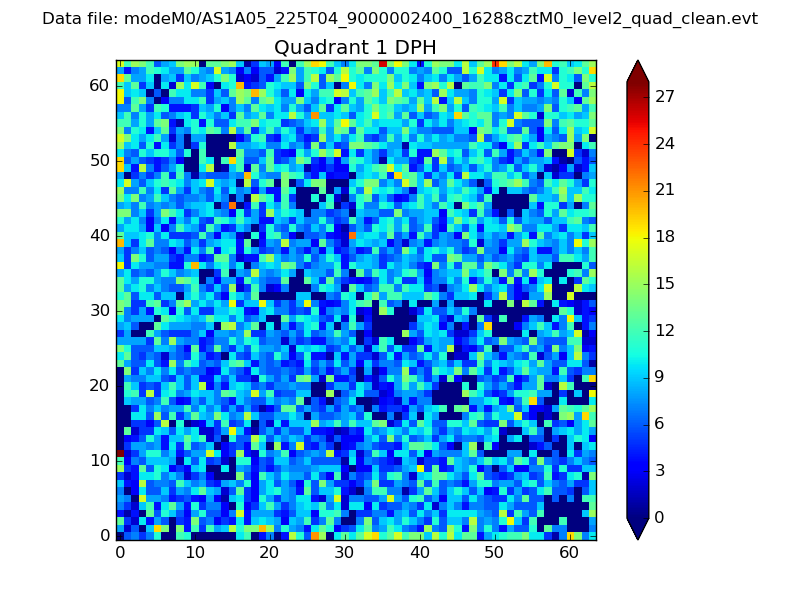 |
Quadrant B |
|---|---|---|---|
| Quadrant D | 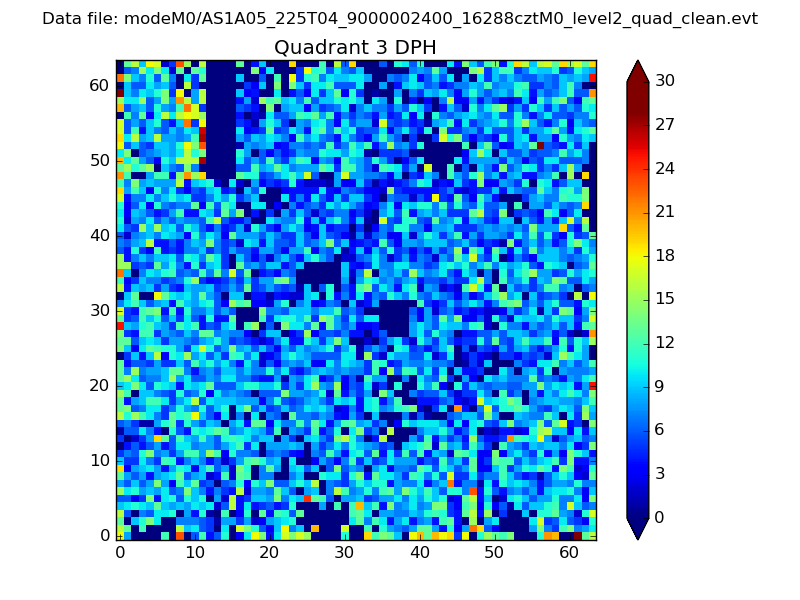 |
 |
Quadrant C |
| Plot type | Count rate plots | Images |
|---|---|---|
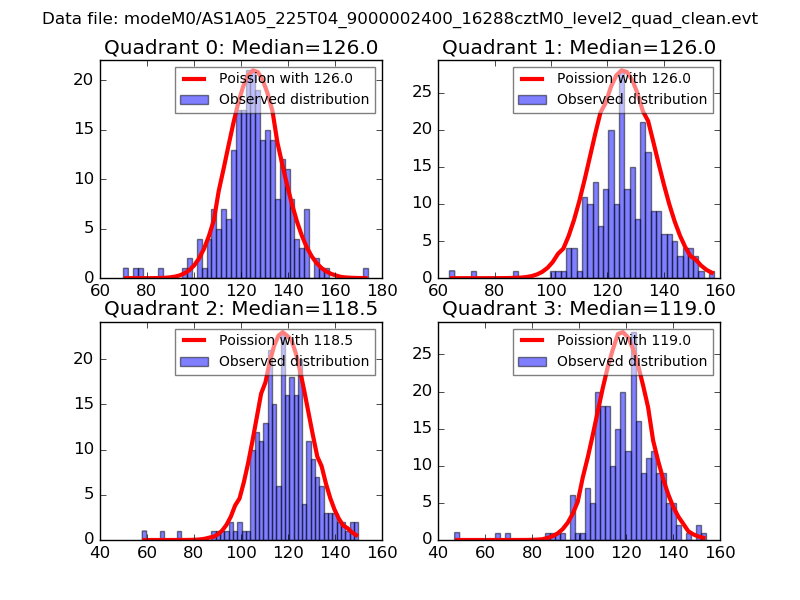
| Comparison with Poisson distribution Blue bars denote a histogram of data divided into 1 sec bins. Red curve is a Poisson curve with rate = median count rate of data. |
 |
 |
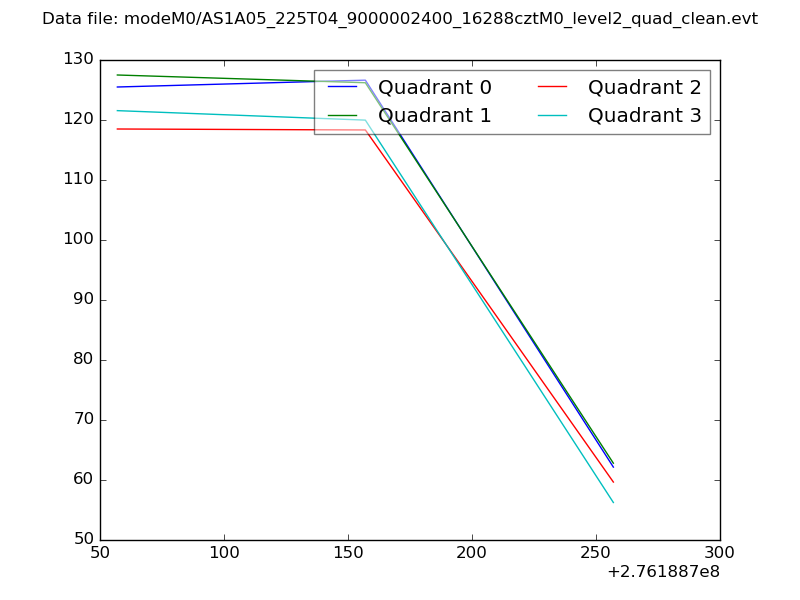
| Quadrant-wise count rates Data is divided into 100 sec bins |
 |
|
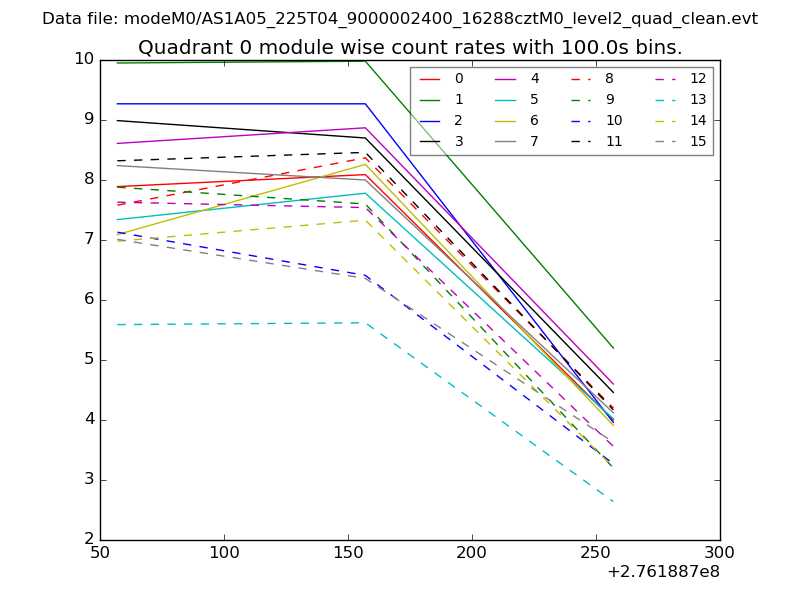
| Module-wise count rates for Quadrant A Data is divided into 100 sec bins |
 |
 |
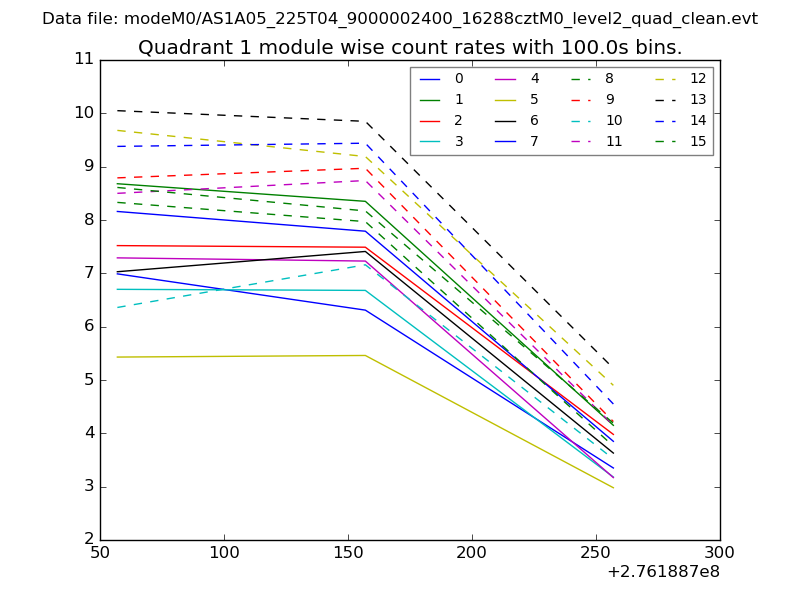
| Module-wise count rates for Quadrant B Data is divided into 100 sec bins |
 |
 |
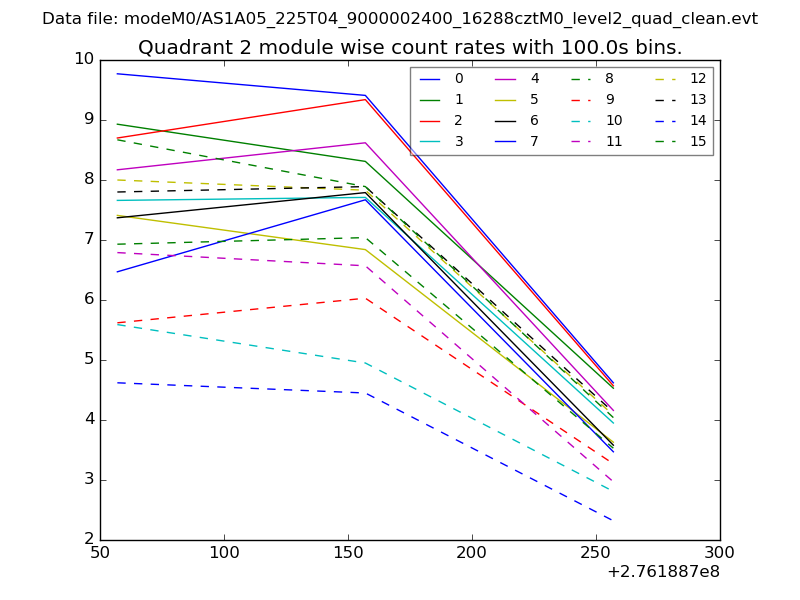
| Module-wise count rates for Quadrant C Data is divided into 100 sec bins |
 |
 |
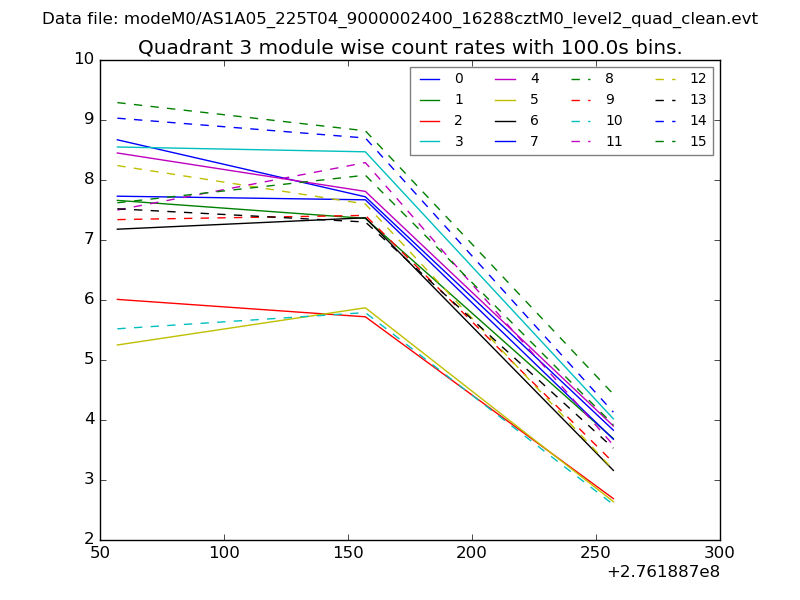
| Module-wise count rates for Quadrant D Data is divided into 100 sec bins |
 |
 |
| Parameter | Plot |
|---|---|
| CZT HV Monitor | 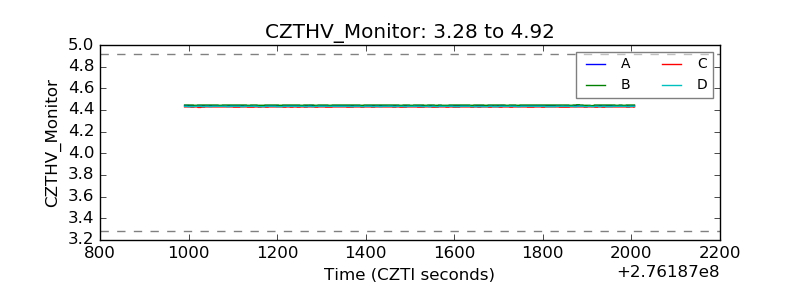 |
| D_VDD |  |
| Temperature 1 | 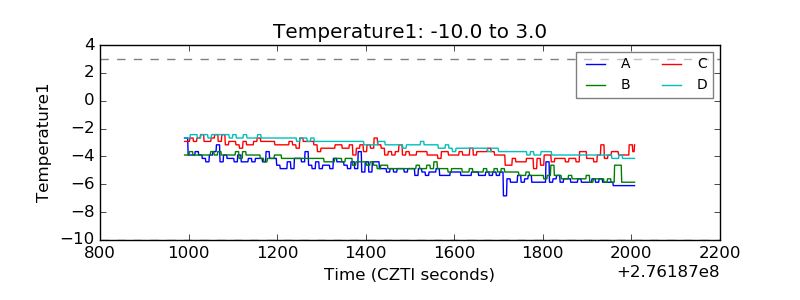 |
| Veto HV Monitor | 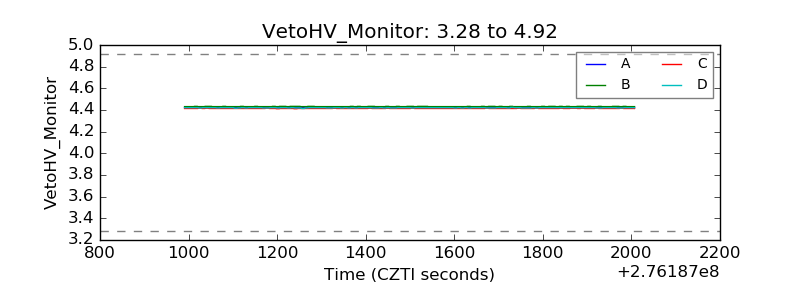 |
| Veto LLD | 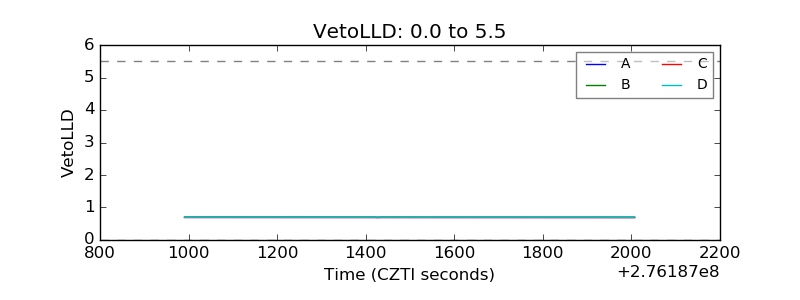 |
| Alpha Counter | 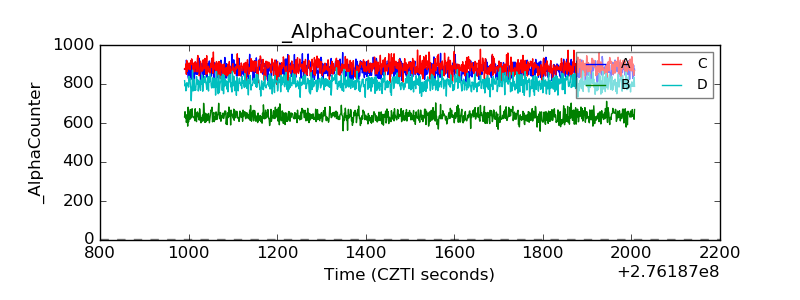 |
| _CPM_Rate | 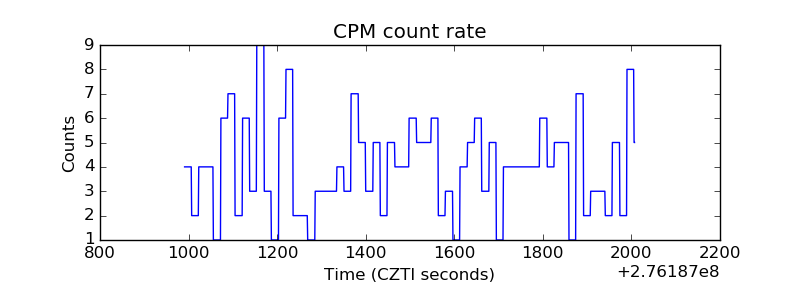 |
| CZT Counter | 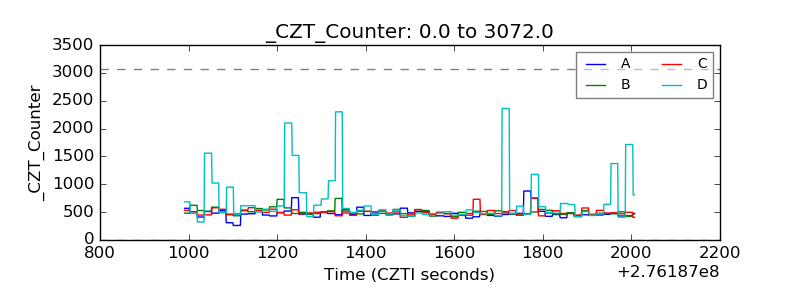 |
| +2.5 Volts monitor |  |
| +5 Volts monitor |  |
| _ROLL_ROT | 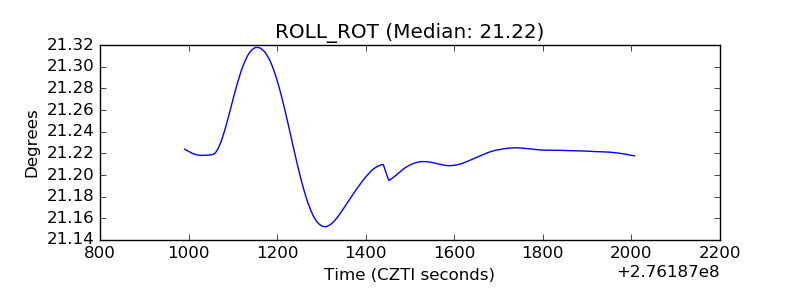 |
| _Roll_DEC | 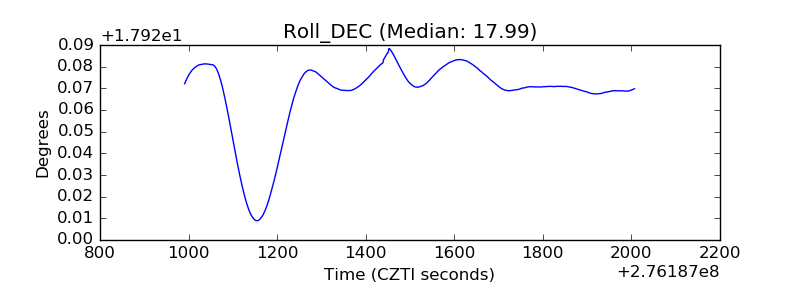 |
| _Roll_RA |  |
| Veto Counter | 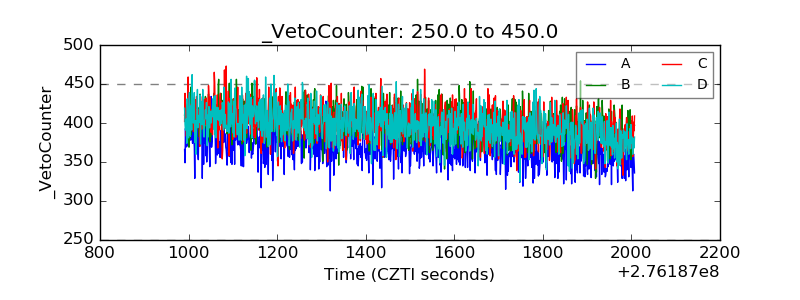 |