| Param | Original file | Final file |
|---|---|---|
| Filename | modeM0/AS1A05_225T04_9000002400_16289cztM0_level2.evt | modeM0/AS1A05_225T04_9000002400_16289cztM0_level2_quad_clean.evt |
| Size (bytes) | 476,438,400 | 85,824,000 |
| Size | 454.4 MB | 81.8 MB |
| Events in quadrant A | 3,373,691 | 536,704 |
| Events in quadrant B | 3,439,443 | 538,669 |
| Events in quadrant C | 3,320,112 | 520,036 |
| Events in quadrant D | 3,817,204 | 512,935 |
| Mode SS | |||
|---|---|---|---|
| Quadrant | BADHDUFLAG | Total packets | Discarded packets |
| A | 0 | 144 | 0 |
| B | 0 | 144 | 0 |
| C | 0 | 144 | 0 |
| D | 0 | 144 | 0 |
| Mode M0 | |||
|---|---|---|---|
| Quadrant | BADHDUFLAG | Total packets | Discarded packets |
| A | 0 | 14680 | 2 |
| B | 0 | 14656 | 1 |
| C | 0 | 14372 | 1 |
| D | 0 | 16061 | 1 |
| Mode M9 | |||
|---|---|---|---|
| Quadrant | BADHDUFLAG | Total packets | Discarded packets |
| A | 0 | 3 | 0 |
| B | 0 | 3 | 0 |
| C | 0 | 3 | 0 |
| D | 0 | 3 | 0 |
| Quadrant | Total seconds | Saturated seconds | Saturation percentage |
|---|---|---|---|
| A | 7040 | 72 | 1.022727% |
| B | 7040 | 61 | 0.866477% |
| C | 7040 | 80 | 1.136364% |
| D | 7040 | 133 | 1.889205% |
Noise dominated data is calculated using 1-second bins in cleaned event files. If a bin has >2000 counts, and if more than 50% of those come from <1% of pixels, then it is considered to be noise-dominated and hence unusable.
| Quadrant | # 1 sec bins | Bins with >0 counts | Bins with >2000 counts | High rate bins dominated by noise | Noise dominated (total time) | Noise dominated (detector-on time) | Marked lightcurve |
|---|---|---|---|---|---|---|---|
| A | 7366 | 7042 | 10 | 10 | 0.14% | 0.14% | 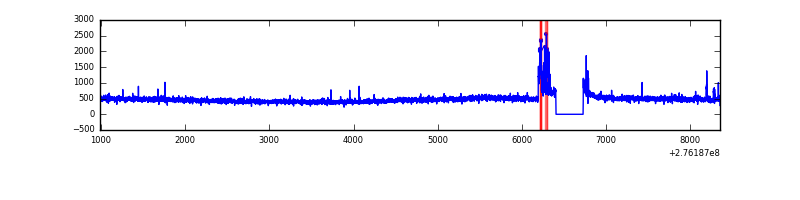 |
| B | 7366 | 7042 | 1 | 1 | 0.01% | 0.01% | 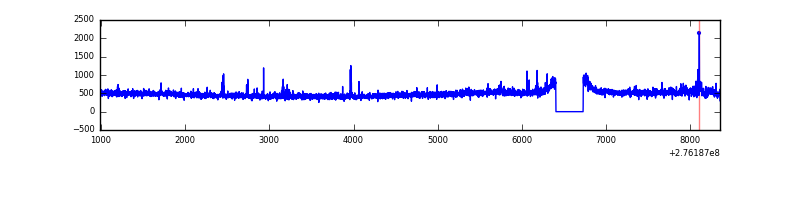 |
| C | 7366 | 7042 | 0 | 0 | 0.00% | 0.00% | 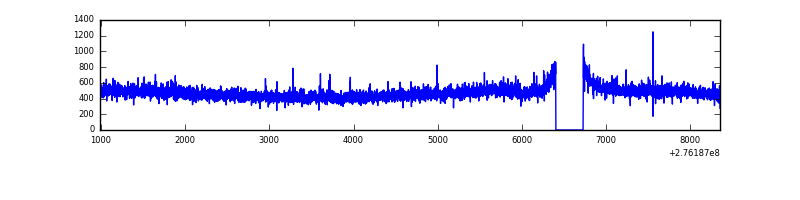 |
| D | 7366 | 7042 | 79 | 79 | 1.07% | 1.12% | 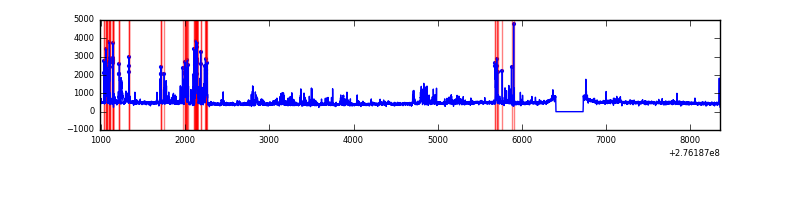 |
Top three noisy pixels from each quadrant. If the there are fewer than three noisy pixels in the level2.evt file, extra rows are filled as -1
| Pixel properties | Quadrant properties | ||||||
|---|---|---|---|---|---|---|---|
| Quadrant | DetID | PixID | Counts | Sigma | Mean | Median | Sigma |
| A | 15 | 174 | 111061 | 639.74 | 846 | 828 | 172.3 |
| A | 0 | 226 | 7449 | 38.43 | 846 | 828 | 172.3 |
| A | 12 | 194 | 6386 | 32.26 | 846 | 828 | 172.3 |
| B | 0 | 198 | 33304 | 197.99 | 846 | 822 | 164.1 |
| B | 5 | 65 | 32756 | 194.65 | 846 | 822 | 164.1 |
| B | 15 | 35 | 27150 | 160.48 | 846 | 822 | 164.1 |
| C | 14 | 238 | 125609 | 653.18 | 811 | 816 | 191.1 |
| C | 0 | 207 | 20341 | 102.2 | 811 | 816 | 191.1 |
| C | 3 | 233 | 10032 | 48.24 | 811 | 816 | 191.1 |
| D | 10 | 70 | 445305 | 2223.7 | 820 | 796 | 199.9 |
| D | 1 | 52 | 266331 | 1328.36 | 820 | 796 | 199.9 |
| D | 2 | 234 | 27298 | 132.58 | 820 | 796 | 199.9 |
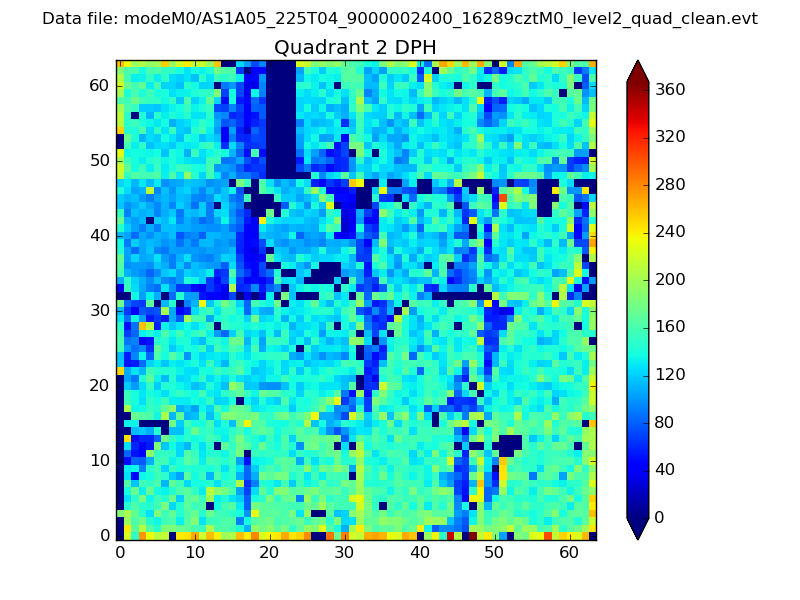
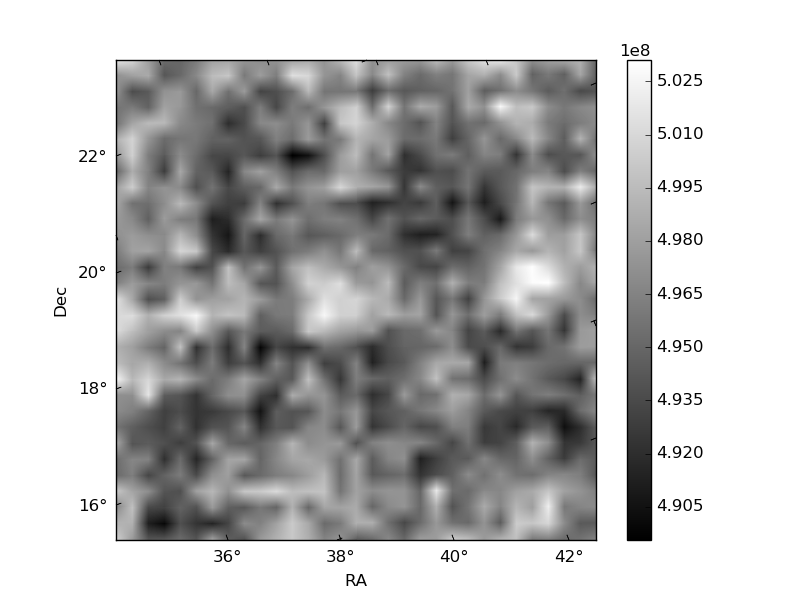
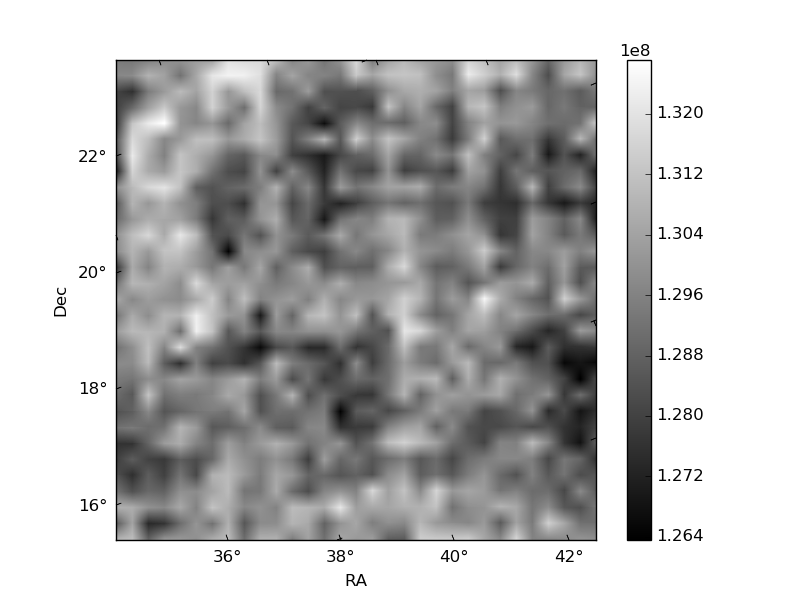
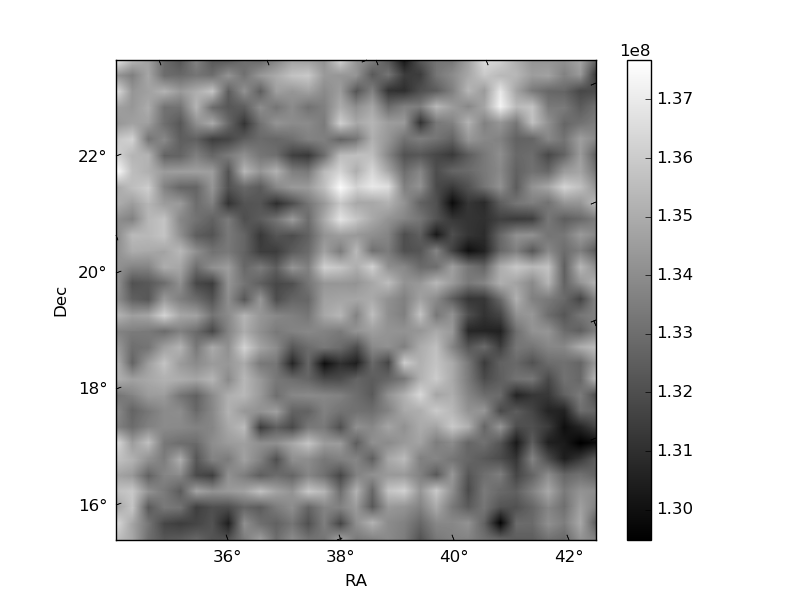
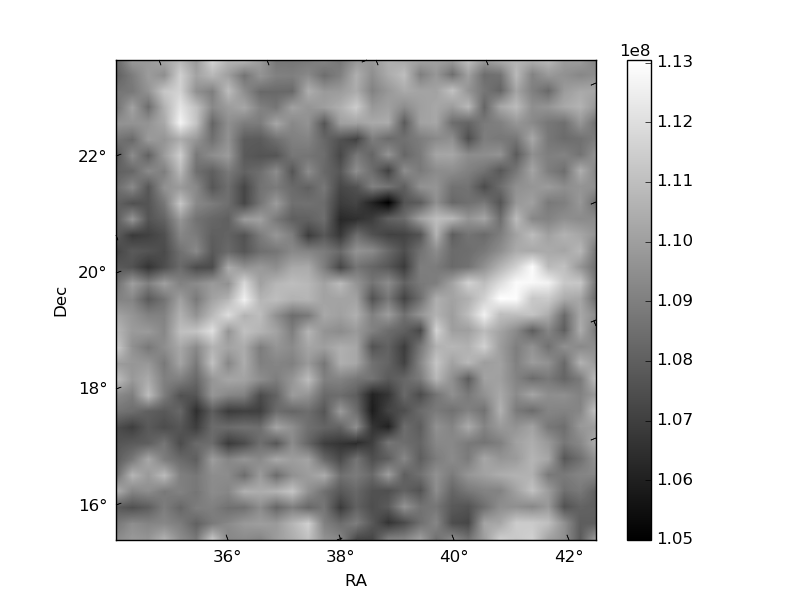
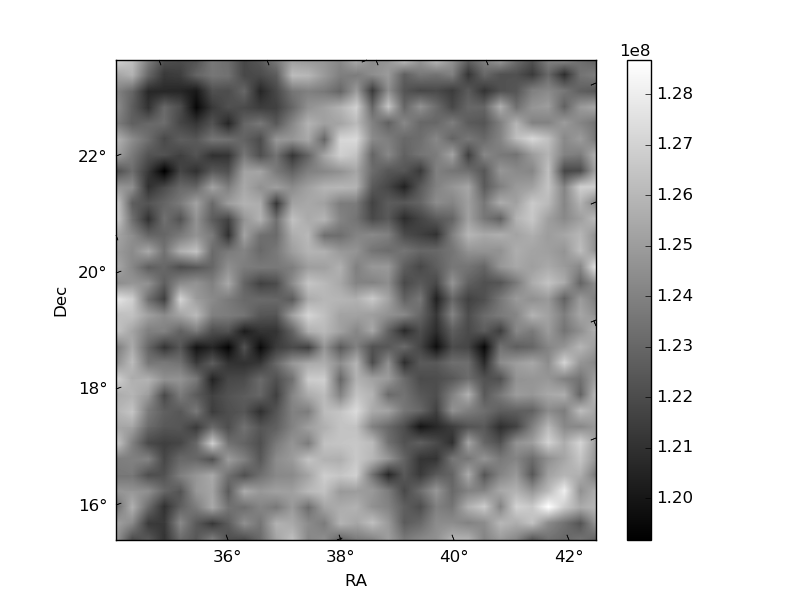
Histogram calculated using DETX and DETY for each event in the final _common_clean file
| Quadrant A | 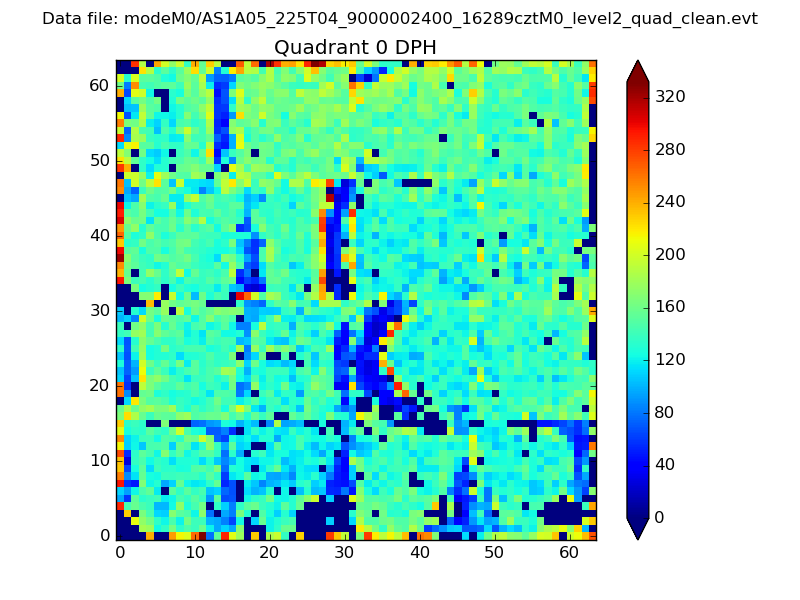 |
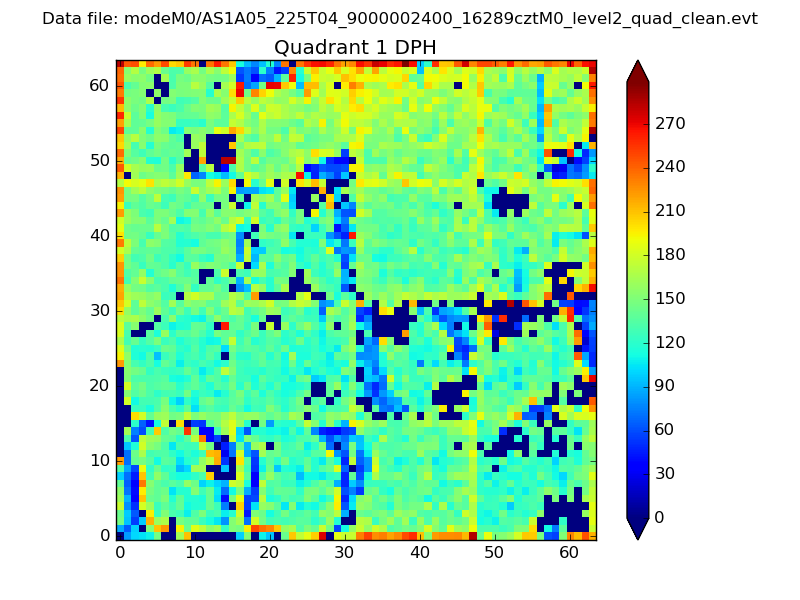 |
Quadrant B |
|---|---|---|---|
| Quadrant D | 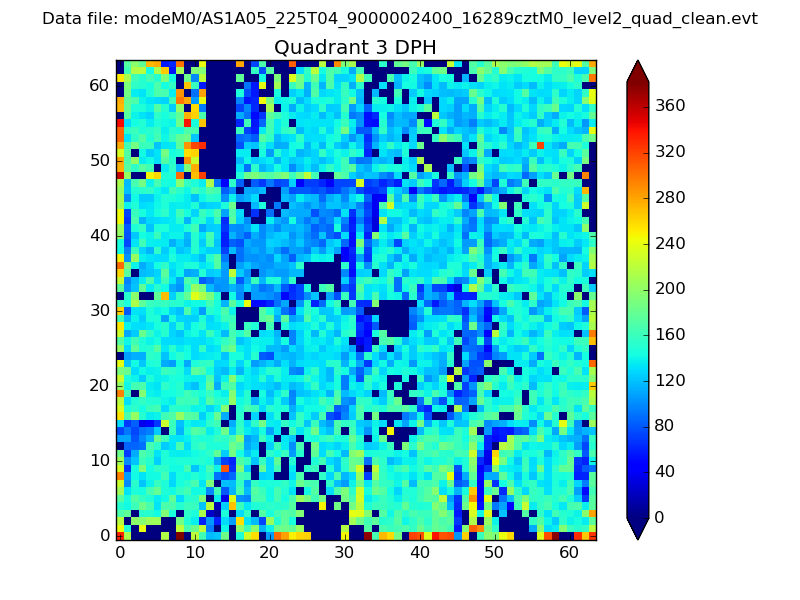 |
 |
Quadrant C |
| Plot type | Count rate plots | Images |
|---|---|---|
| Comparison with Poisson distribution Blue bars denote a histogram of data divided into 1 sec bins. Red curve is a Poisson curve with rate = median count rate of data. |
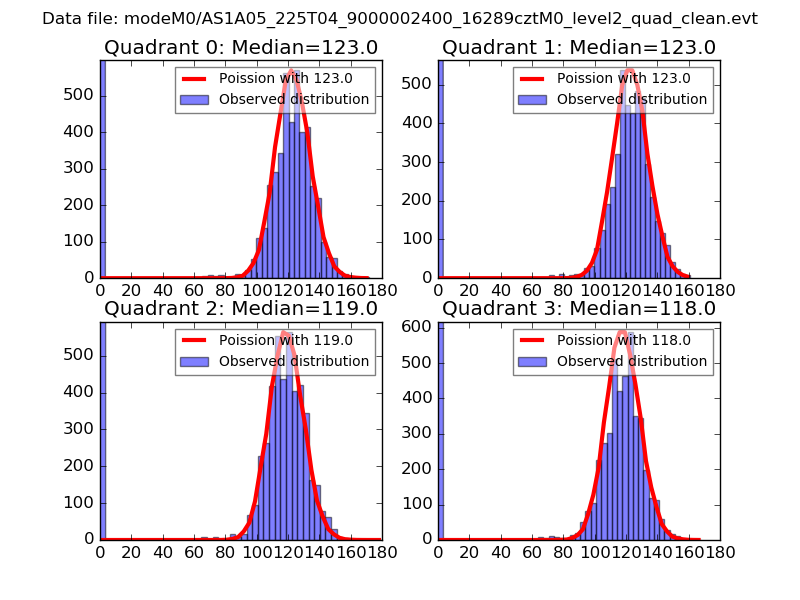 |
 |
| Quadrant-wise count rates Data is divided into 100 sec bins |
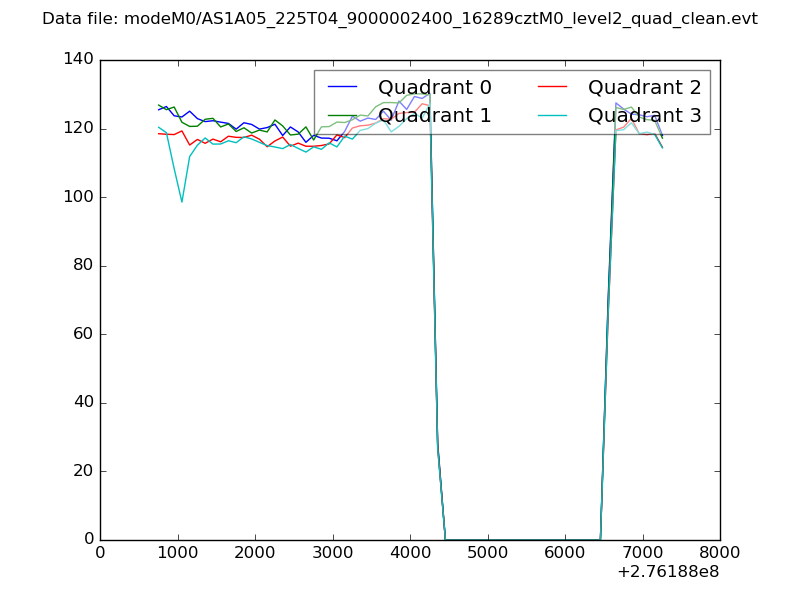 |
|
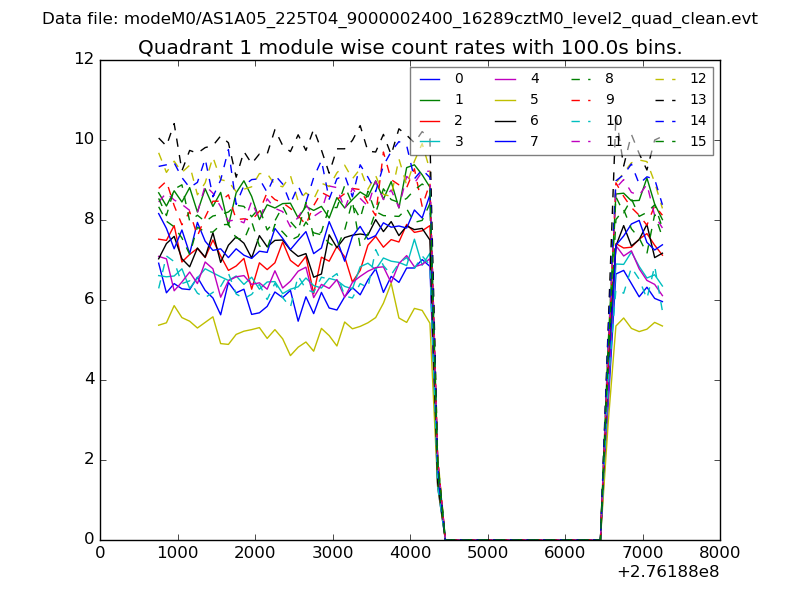
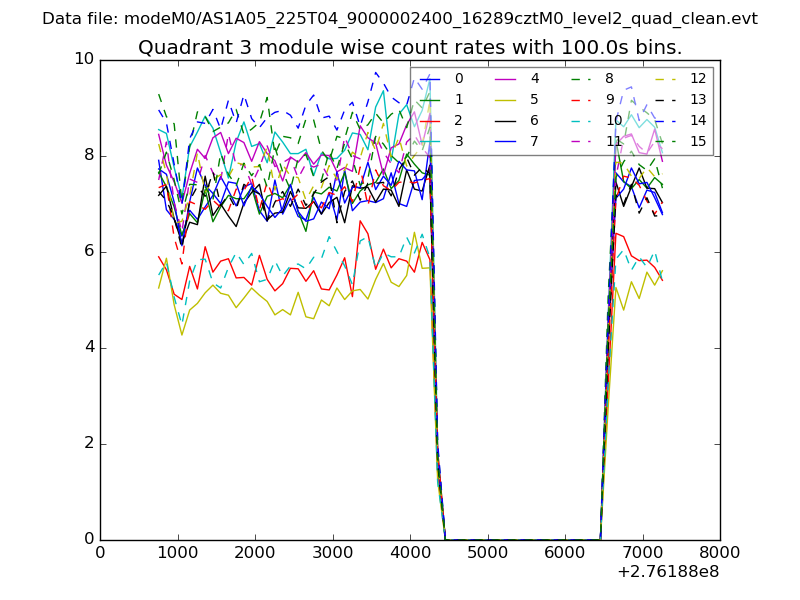
| Module-wise count rates for Quadrant A Data is divided into 100 sec bins |
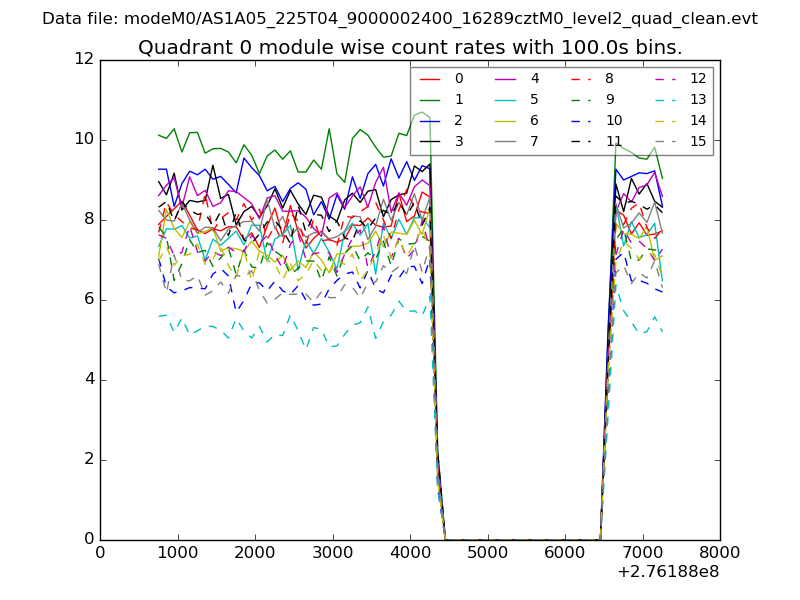 |
 |
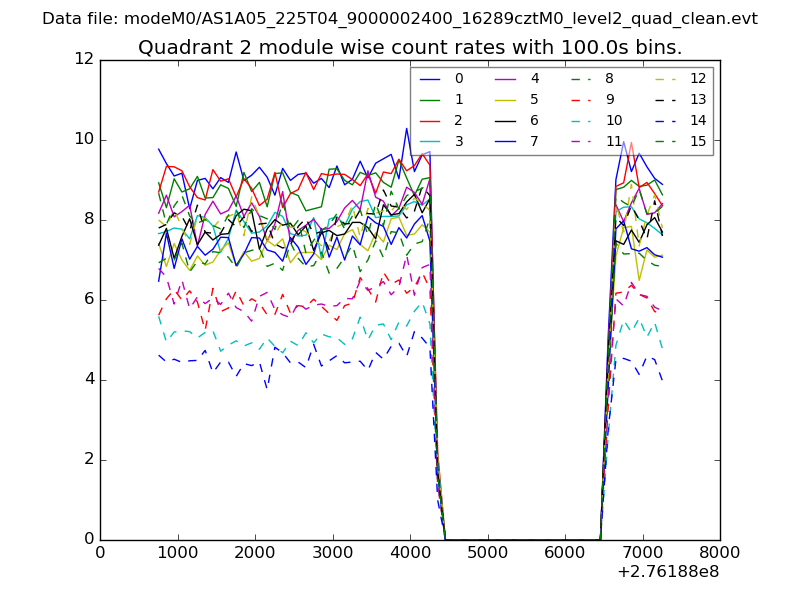
| Module-wise count rates for Quadrant B Data is divided into 100 sec bins |
 |
 |
| Module-wise count rates for Quadrant C Data is divided into 100 sec bins |
 |
 |
| Module-wise count rates for Quadrant D Data is divided into 100 sec bins |
 |
 |
| Parameter | Plot |
|---|---|
| CZT HV Monitor | 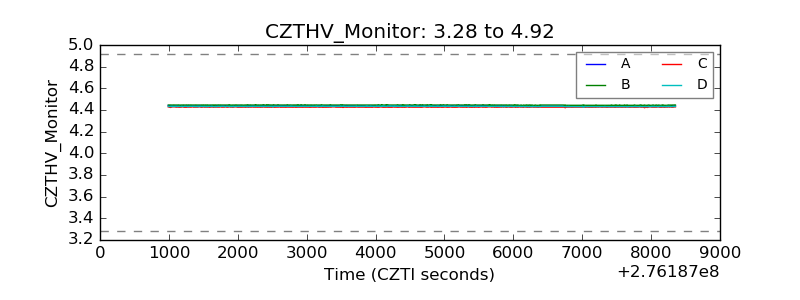 |
| D_VDD | 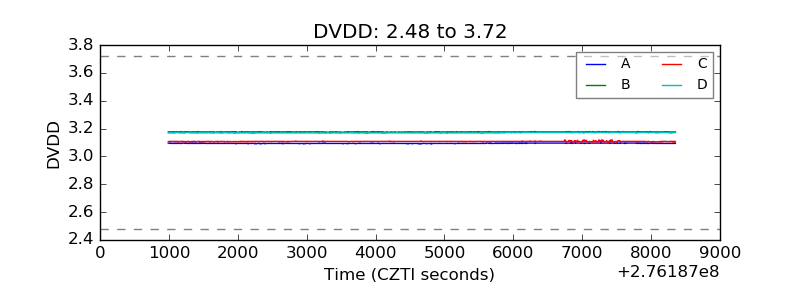 |
| Temperature 1 | 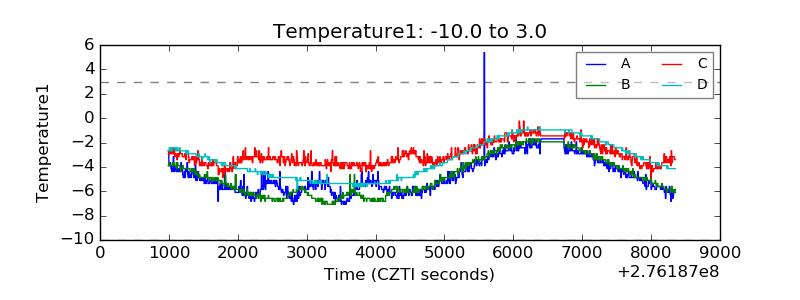 |
| Veto HV Monitor |  |
| Veto LLD | 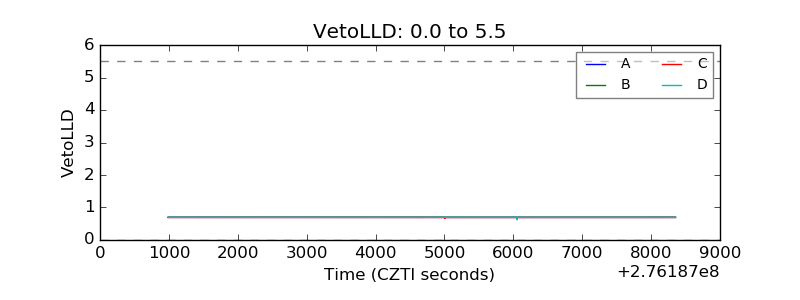 |
| Alpha Counter | 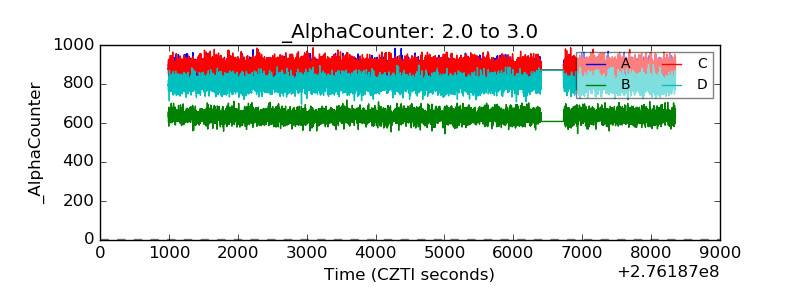 |
| _CPM_Rate | 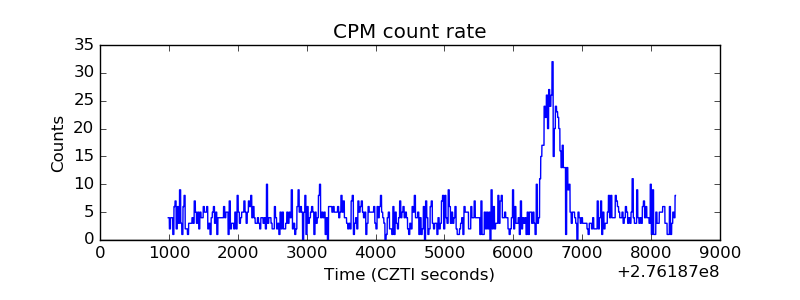 |
| CZT Counter | 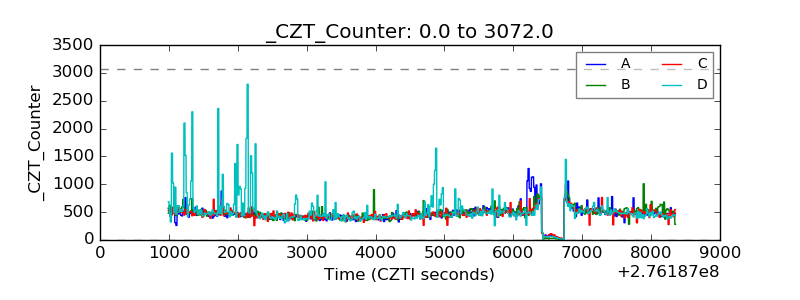 |
| +2.5 Volts monitor |  |
| +5 Volts monitor |  |
| _ROLL_ROT | 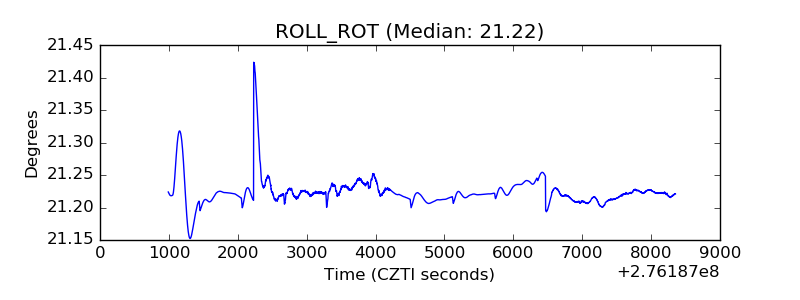 |
| _Roll_DEC | 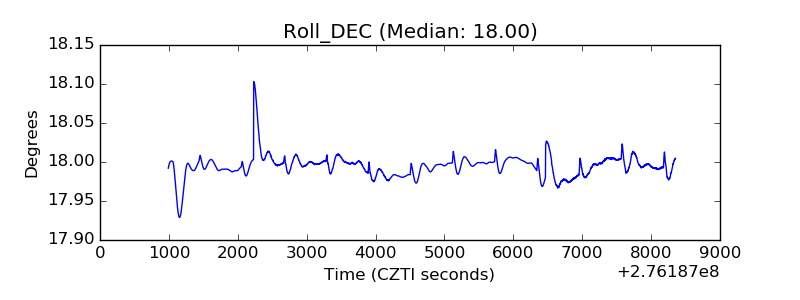 |
| _Roll_RA | 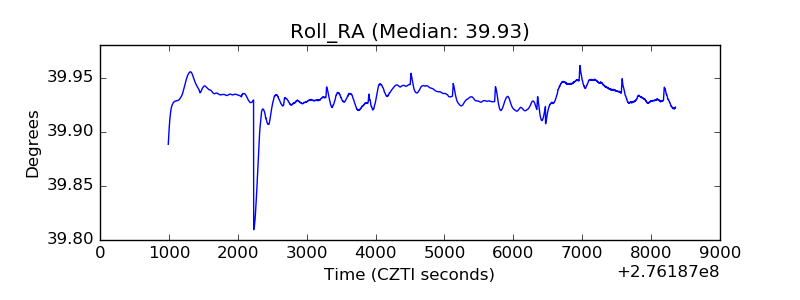 |
| Veto Counter | 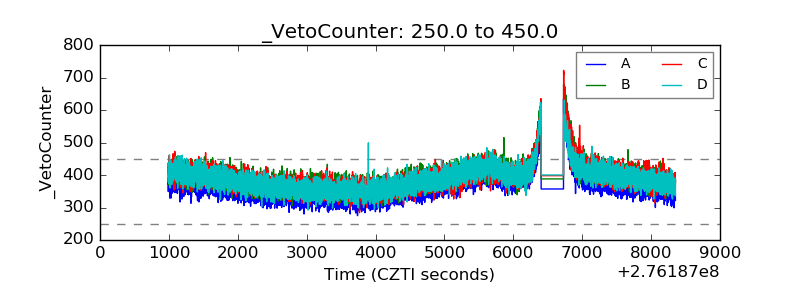 |