| Param | Original file | Final file |
|---|---|---|
| Filename | modeM0/AS1A05_225T04_9000002400_16291cztM0_level2.evt | modeM0/AS1A05_225T04_9000002400_16291cztM0_level2_quad_clean.evt |
| Size (bytes) | 705,490,560 | 136,877,760 |
| Size | 672.8 MB | 130.5 MB |
| Events in quadrant A | 5,622,803 | 863,345 |
| Events in quadrant B | 5,140,183 | 874,325 |
| Events in quadrant C | 5,150,119 | 844,034 |
| Events in quadrant D | 4,745,506 | 841,009 |
| Mode SS | |||
|---|---|---|---|
| Quadrant | BADHDUFLAG | Total packets | Discarded packets |
| A | 0 | 210 | 0 |
| B | 0 | 210 | 0 |
| C | 0 | 210 | 0 |
| D | 0 | 210 | 0 |
| Mode M0 | |||
|---|---|---|---|
| Quadrant | BADHDUFLAG | Total packets | Discarded packets |
| A | 0 | 23783 | 3 |
| B | 0 | 22071 | 2 |
| C | 0 | 22185 | 2 |
| D | 0 | 21613 | 2 |
| Mode M9 | |||
|---|---|---|---|
| Quadrant | BADHDUFLAG | Total packets | Discarded packets |
| A | 0 | 6 | 0 |
| B | 0 | 6 | 0 |
| C | 0 | 6 | 0 |
| D | 0 | 6 | 0 |
| Quadrant | Total seconds | Saturated seconds | Saturation percentage |
|---|---|---|---|
| A | 10438 | 248 | 2.375934% |
| B | 10438 | 68 | 0.651466% |
| C | 10438 | 77 | 0.737689% |
| D | 10438 | 43 | 0.411956% |
Noise dominated data is calculated using 1-second bins in cleaned event files. If a bin has >2000 counts, and if more than 50% of those come from <1% of pixels, then it is considered to be noise-dominated and hence unusable.
| Quadrant | # 1 sec bins | Bins with >0 counts | Bins with >2000 counts | High rate bins dominated by noise | Noise dominated (total time) | Noise dominated (detector-on time) | Marked lightcurve |
|---|---|---|---|---|---|---|---|
| A | 10974 | 10440 | 115 | 115 | 1.05% | 1.10% | 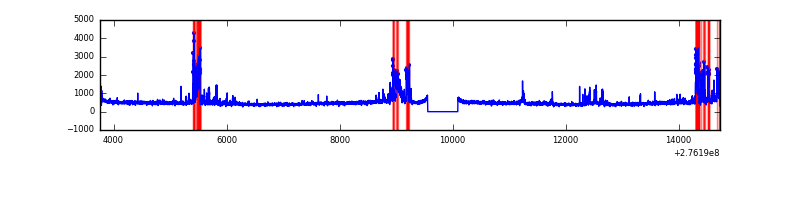 |
| B | 10974 | 10440 | 19 | 19 | 0.17% | 0.18% | 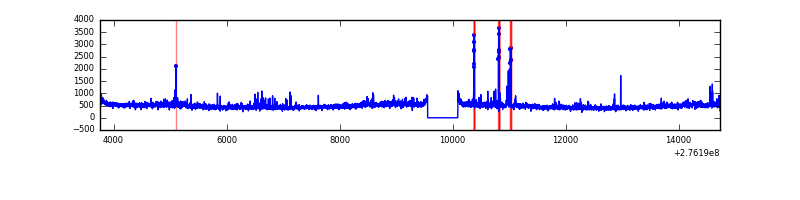 |
| C | 10974 | 10440 | 0 | 0 | 0.00% | 0.00% | 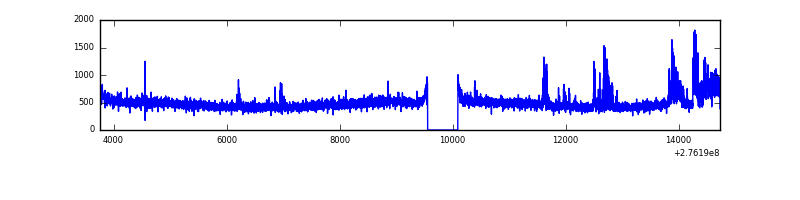 |
| D | 10974 | 10440 | 19 | 19 | 0.17% | 0.18% | 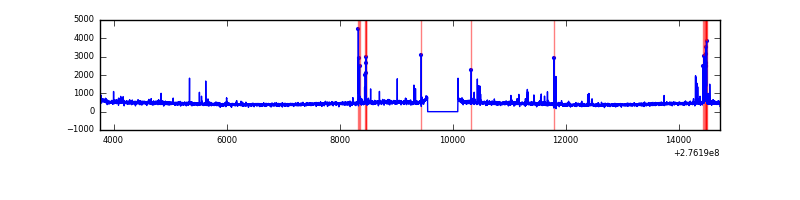 |
Top three noisy pixels from each quadrant. If the there are fewer than three noisy pixels in the level2.evt file, extra rows are filled as -1
| Pixel properties | Quadrant properties | ||||||
|---|---|---|---|---|---|---|---|
| Quadrant | DetID | PixID | Counts | Sigma | Mean | Median | Sigma |
| A | 15 | 174 | 950031 | 3862.94 | 1214 | 1187 | 245.6 |
| A | 0 | 226 | 10683 | 38.66 | 1214 | 1187 | 245.6 |
| A | 12 | 194 | 8940 | 31.56 | 1214 | 1187 | 245.6 |
| B | 5 | 65 | 109701 | 462.34 | 1220 | 1189 | 234.7 |
| B | 0 | 198 | 75102 | 314.92 | 1220 | 1189 | 234.7 |
| B | 0 | 189 | 63584 | 265.85 | 1220 | 1189 | 234.7 |
| C | 3 | 233 | 309668 | 1124.06 | 1171 | 1180 | 274.4 |
| C | 14 | 238 | 180165 | 652.18 | 1171 | 1180 | 274.4 |
| C | 0 | 207 | 78463 | 281.6 | 1171 | 1180 | 274.4 |
| D | 10 | 70 | 135275 | 463.59 | 1188 | 1153 | 289.3 |
| D | 1 | 52 | 74002 | 251.8 | 1188 | 1153 | 289.3 |
| D | 2 | 234 | 43150 | 145.16 | 1188 | 1153 | 289.3 |
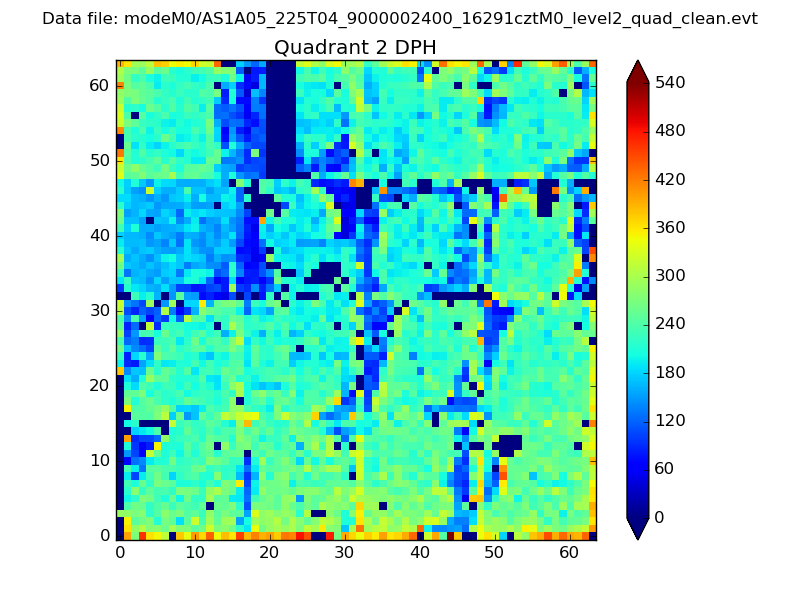
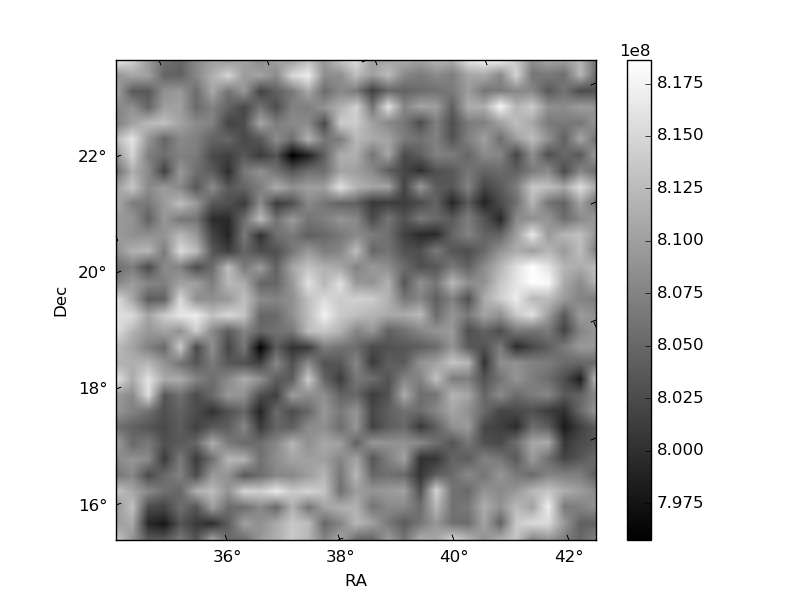
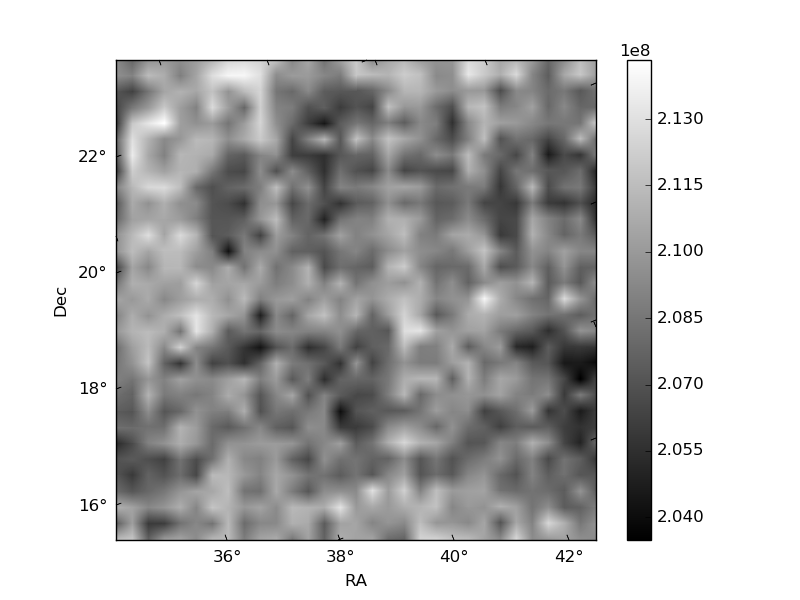
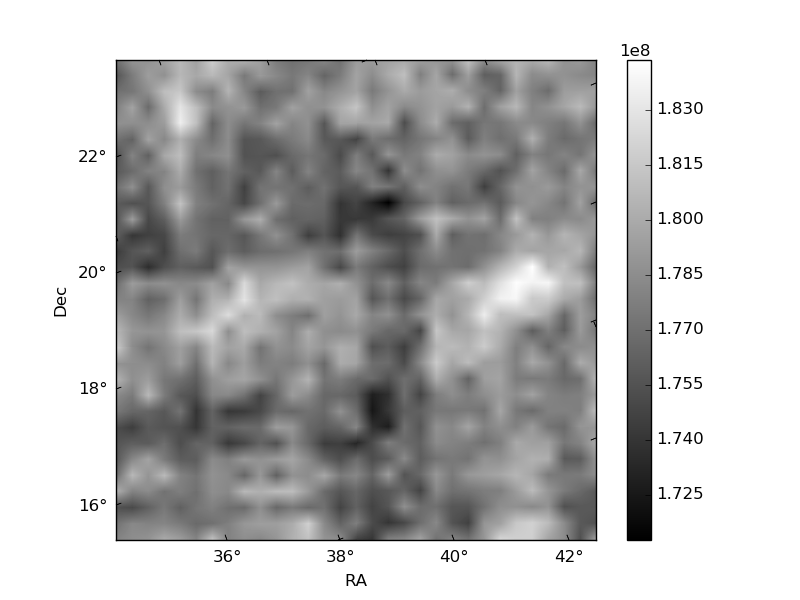
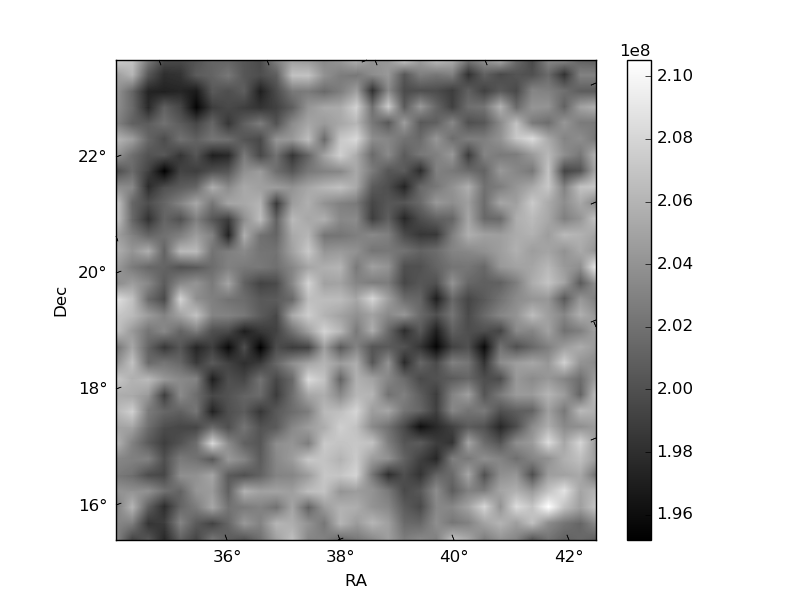
Histogram calculated using DETX and DETY for each event in the final _common_clean file
| Quadrant A | 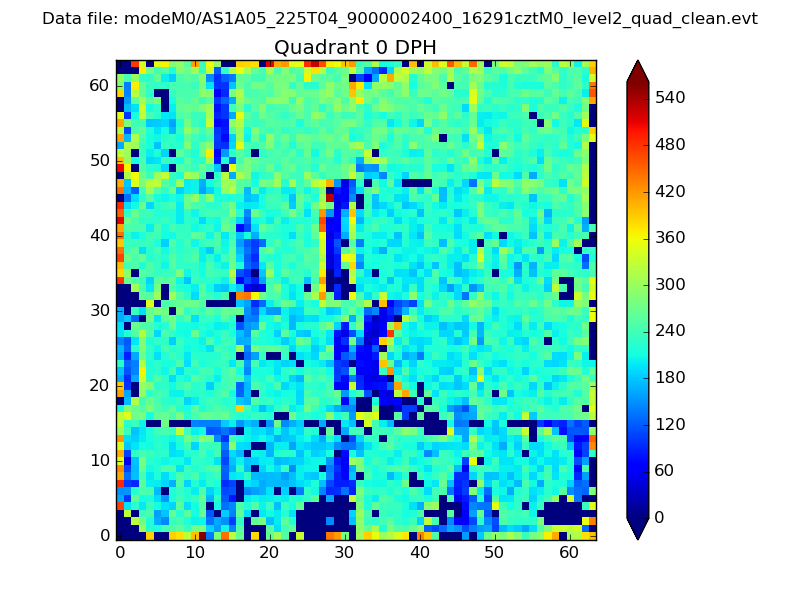 |
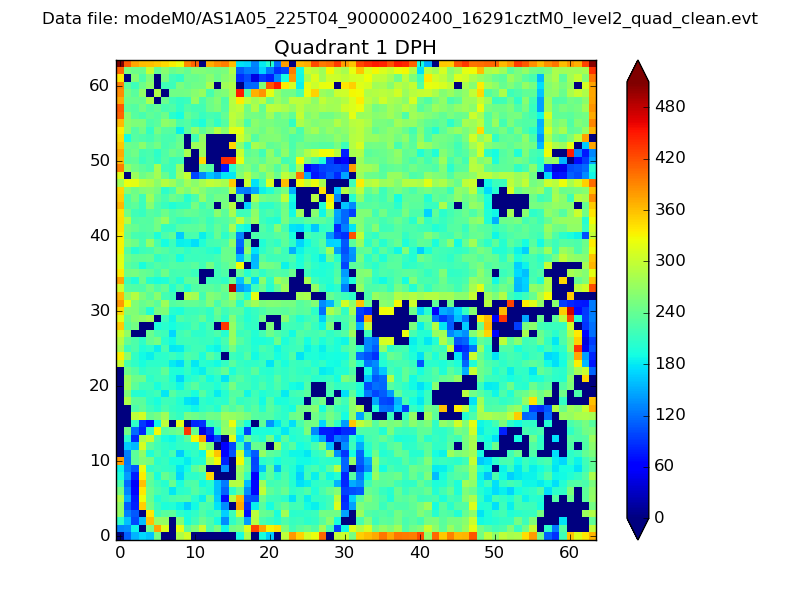 |
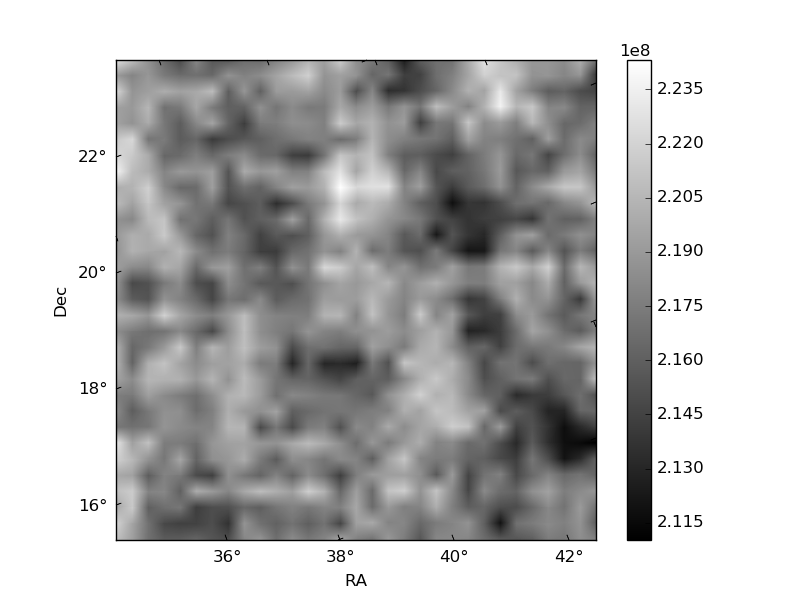
Quadrant B |
|---|---|---|---|
| Quadrant D | 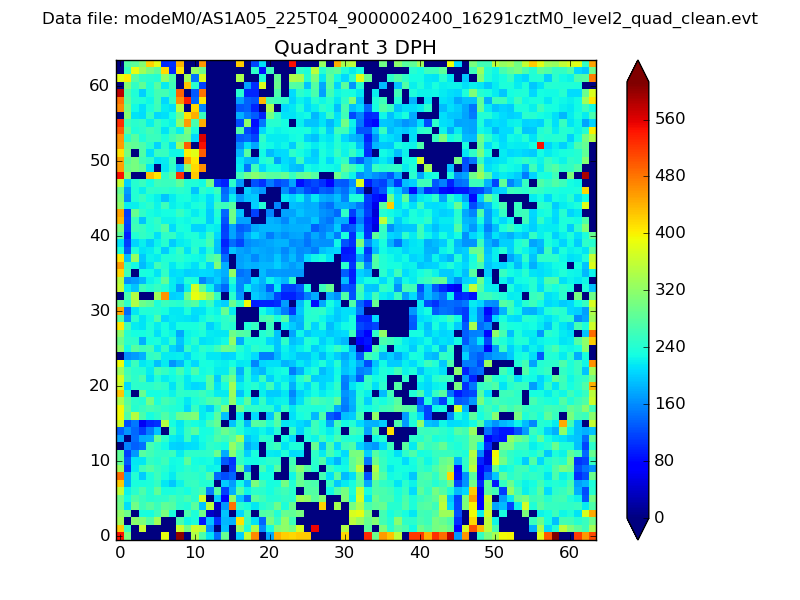 |
 |
Quadrant C |
| Plot type | Count rate plots | Images |
|---|---|---|
| Comparison with Poisson distribution Blue bars denote a histogram of data divided into 1 sec bins. Red curve is a Poisson curve with rate = median count rate of data. |
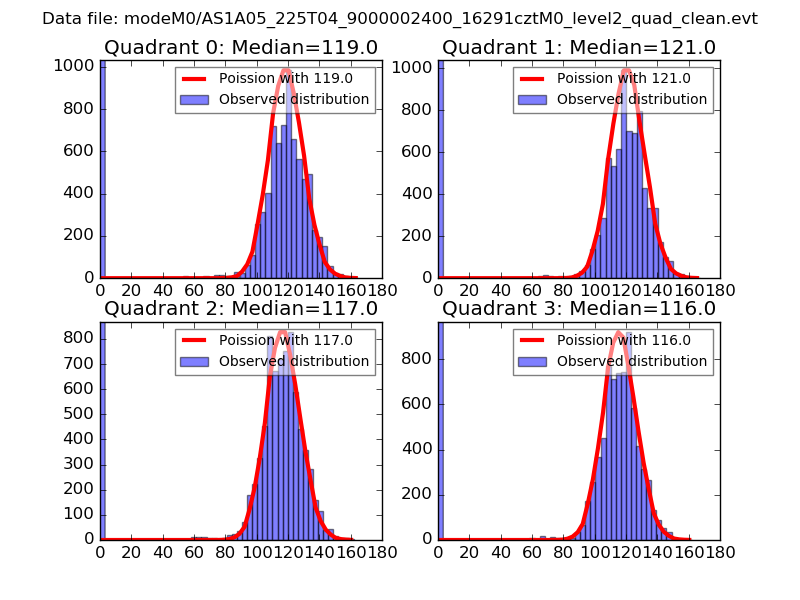 |
 |
| Quadrant-wise count rates Data is divided into 100 sec bins |
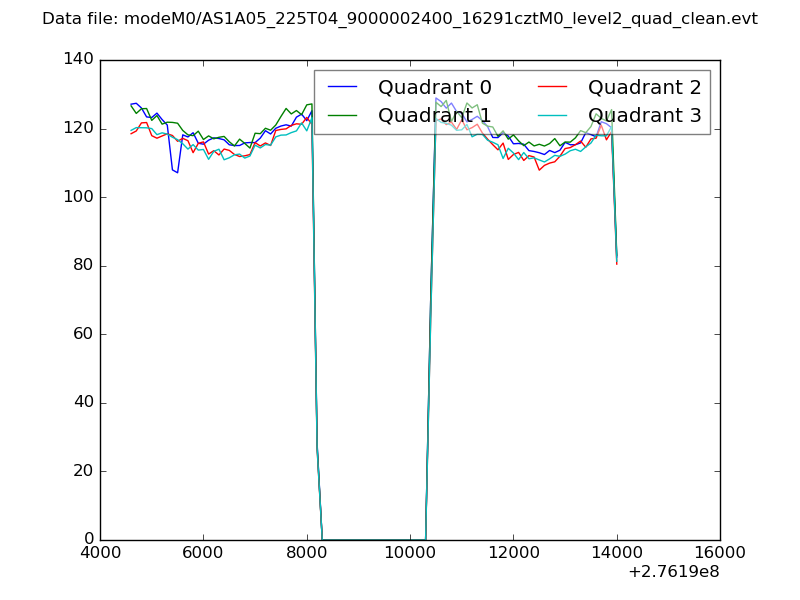 |
|
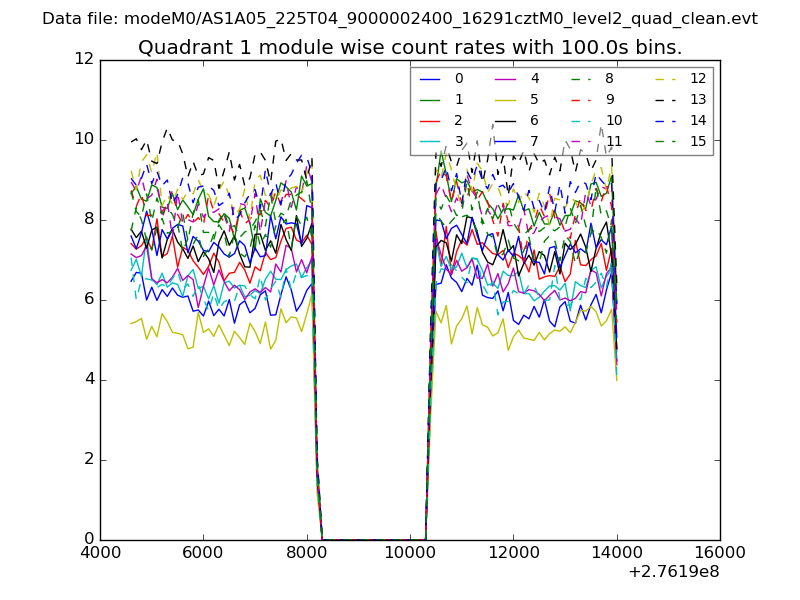
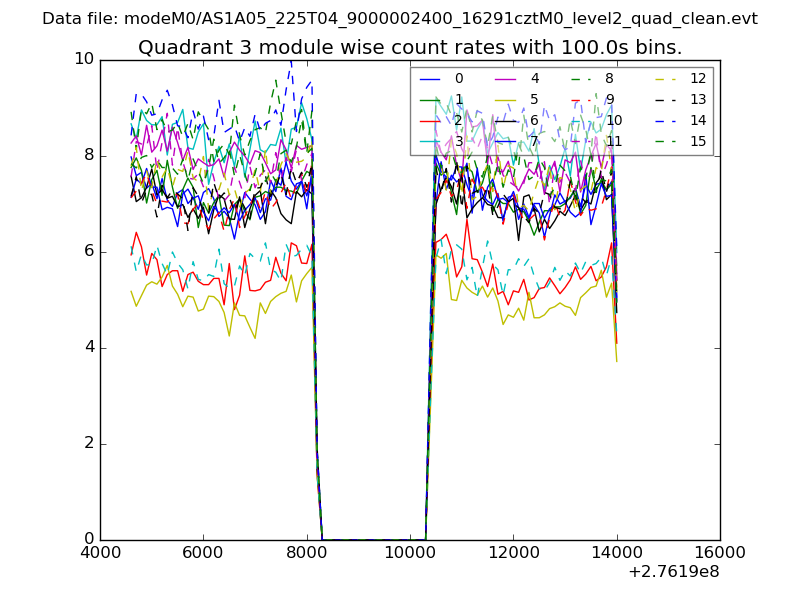
| Module-wise count rates for Quadrant A Data is divided into 100 sec bins |
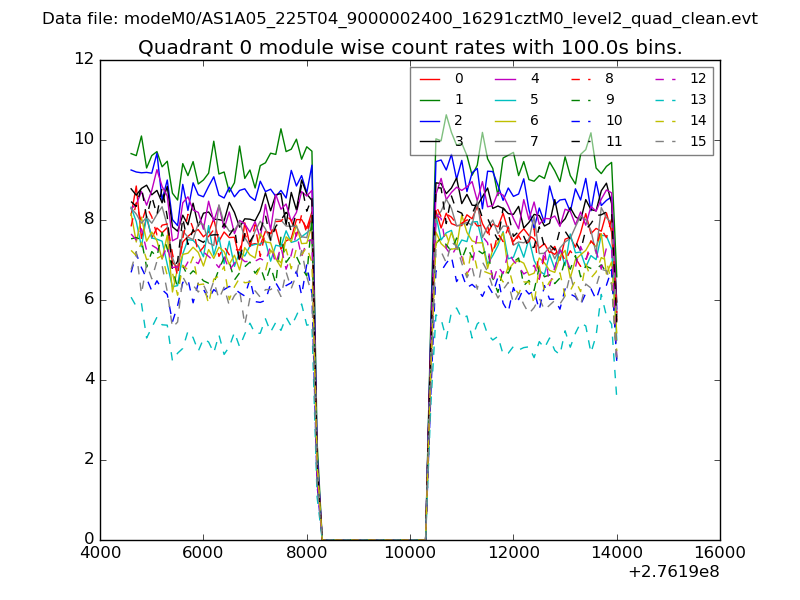 |
 |
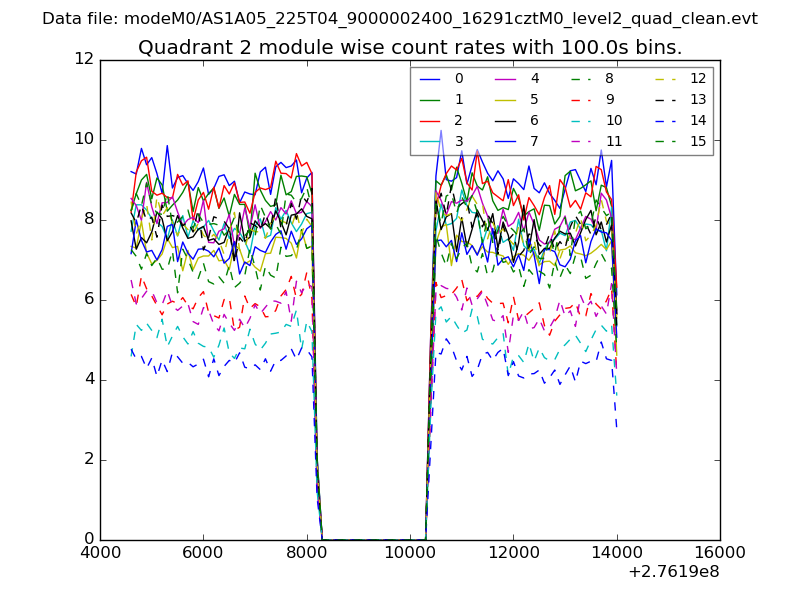
| Module-wise count rates for Quadrant B Data is divided into 100 sec bins |
 |
 |
| Module-wise count rates for Quadrant C Data is divided into 100 sec bins |
 |
 |
| Module-wise count rates for Quadrant D Data is divided into 100 sec bins |
 |
 |
| Parameter | Plot |
|---|---|
| CZT HV Monitor | 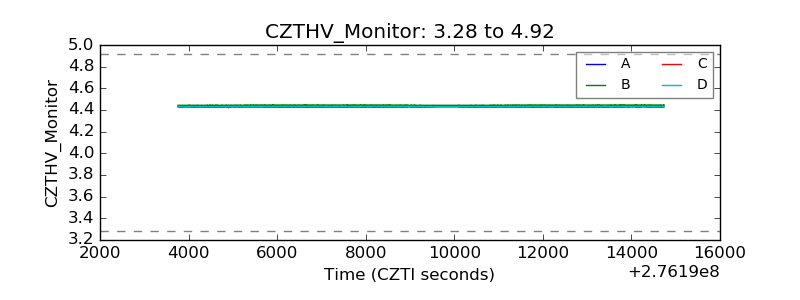 |
| D_VDD | 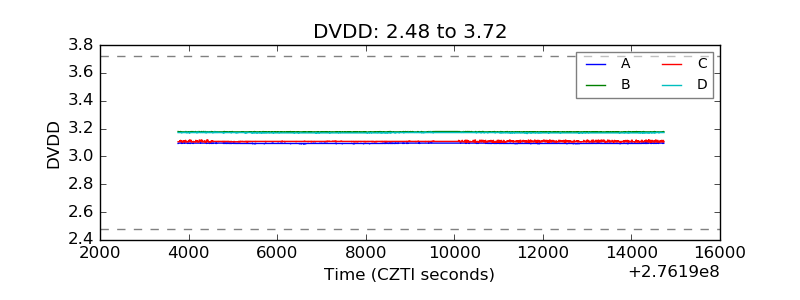 |
| Temperature 1 |  |
| Veto HV Monitor | 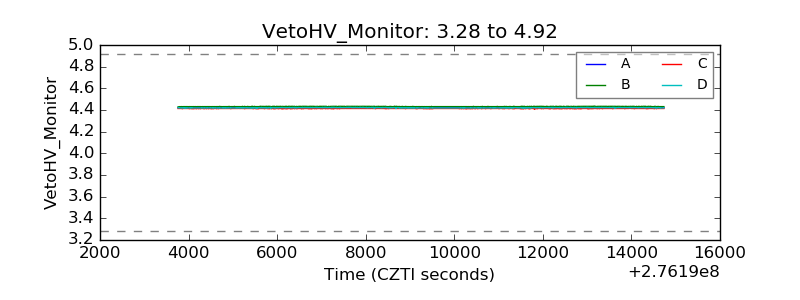 |
| Veto LLD | 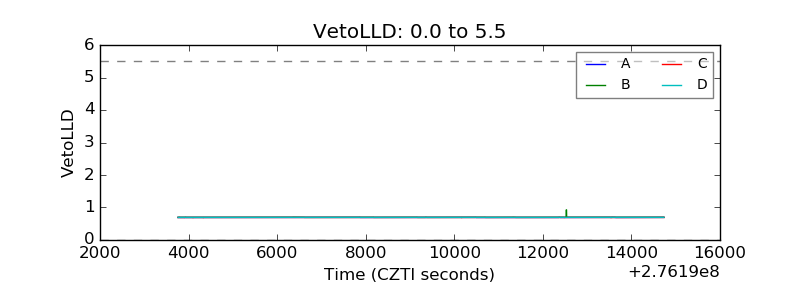 |
| Alpha Counter | 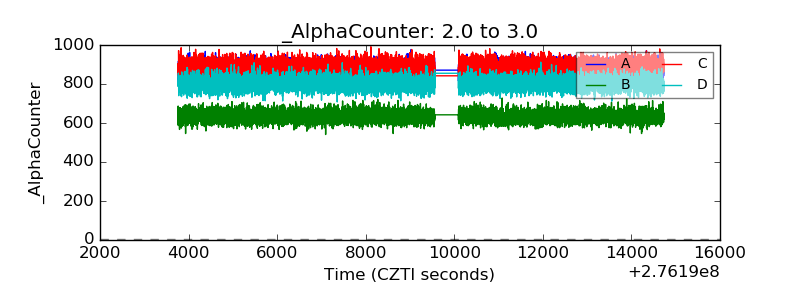 |
| _CPM_Rate | 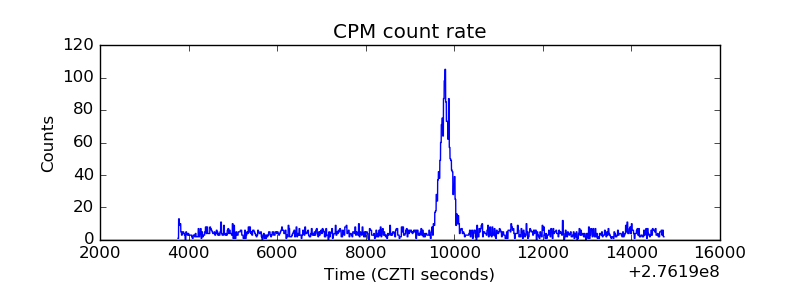 |
| CZT Counter | 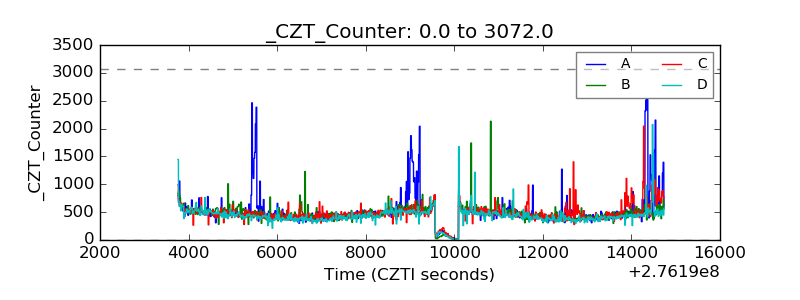 |
| +2.5 Volts monitor |  |
| +5 Volts monitor |  |
| _ROLL_ROT | 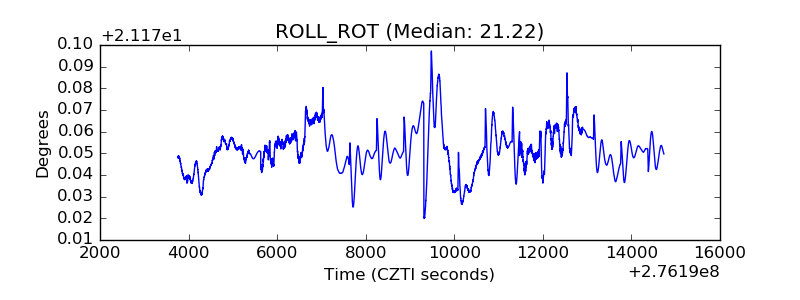 |
| _Roll_DEC | 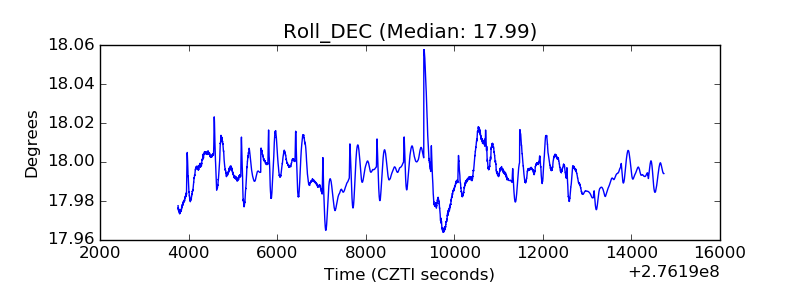 |
| _Roll_RA | 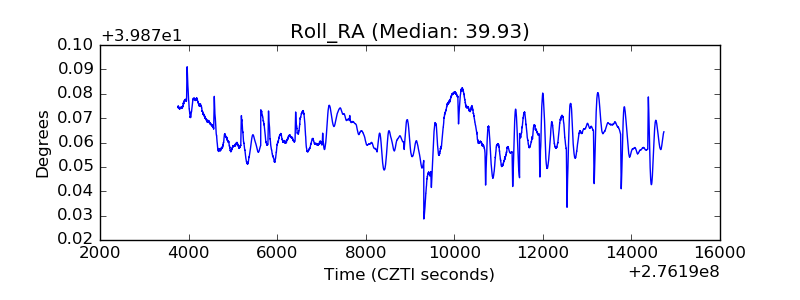 |
| Veto Counter | 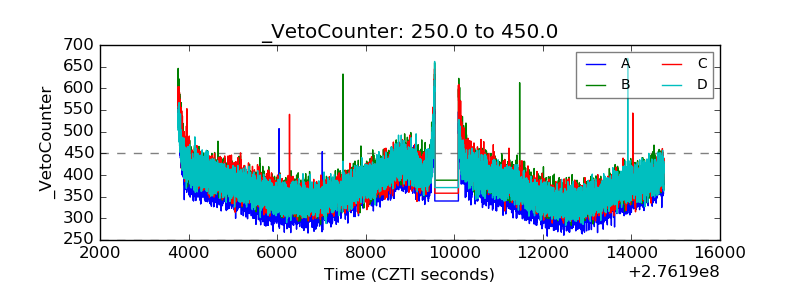 |