| Param | Original file | Final file |
|---|---|---|
| Filename | modeM0/AS1A05_225T04_9000002400_16293cztM0_level2.evt | modeM0/AS1A05_225T04_9000002400_16293cztM0_level2_quad_clean.evt |
| Size (bytes) | 602,061,120 | 97,027,200 |
| Size | 574.2 MB | 92.5 MB |
| Events in quadrant A | 4,331,098 | 596,615 |
| Events in quadrant B | 4,375,316 | 603,405 |
| Events in quadrant C | 4,792,820 | 579,885 |
| Events in quadrant D | 4,164,710 | 574,951 |
| Mode SS | |||
|---|---|---|---|
| Quadrant | BADHDUFLAG | Total packets | Discarded packets |
| A | 0 | 174 | 0 |
| B | 0 | 174 | 0 |
| C | 0 | 174 | 0 |
| D | 0 | 174 | 0 |
| Mode M0 | |||
|---|---|---|---|
| Quadrant | BADHDUFLAG | Total packets | Discarded packets |
| A | 0 | 18361 | 2 |
| B | 0 | 18436 | 2 |
| C | 0 | 19745 | 2 |
| D | 0 | 18150 | 2 |
| Mode M9 | |||
|---|---|---|---|
| Quadrant | BADHDUFLAG | Total packets | Discarded packets |
| A | 0 | 14 | 0 |
| B | 0 | 14 | 0 |
| C | 0 | 14 | 0 |
| D | 0 | 14 | 0 |
| Quadrant | Total seconds | Saturated seconds | Saturation percentage |
|---|---|---|---|
| A | 8391 | 151 | 1.799547% |
| B | 8391 | 98 | 1.167918% |
| C | 8391 | 201 | 2.395424% |
| D | 8391 | 73 | 0.869980% |
Noise dominated data is calculated using 1-second bins in cleaned event files. If a bin has >2000 counts, and if more than 50% of those come from <1% of pixels, then it is considered to be noise-dominated and hence unusable.
| Quadrant | # 1 sec bins | Bins with >0 counts | Bins with >2000 counts | High rate bins dominated by noise | Noise dominated (total time) | Noise dominated (detector-on time) | Marked lightcurve |
|---|---|---|---|---|---|---|---|
| A | 9917 | 8394 | 66 | 66 | 0.67% | 0.79% | 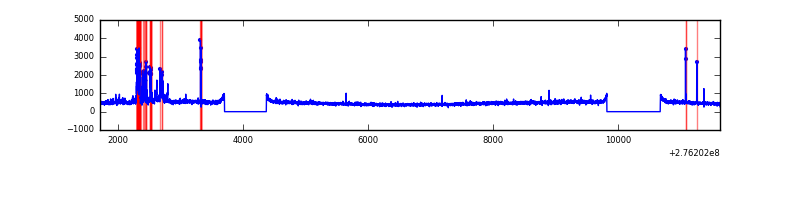 |
| B | 9917 | 8394 | 11 | 11 | 0.11% | 0.13% | 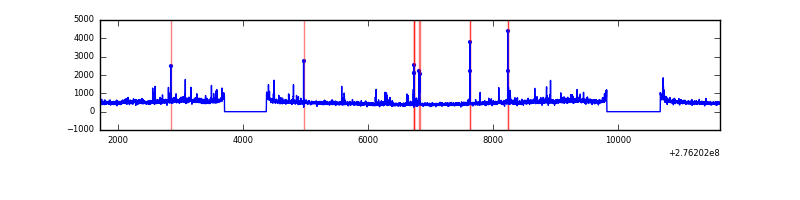 |
| C | 9917 | 8394 | 4 | 4 | 0.04% | 0.05% | 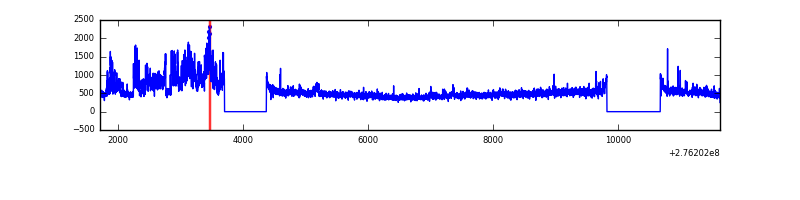 |
| D | 9917 | 8394 | 29 | 29 | 0.29% | 0.35% | 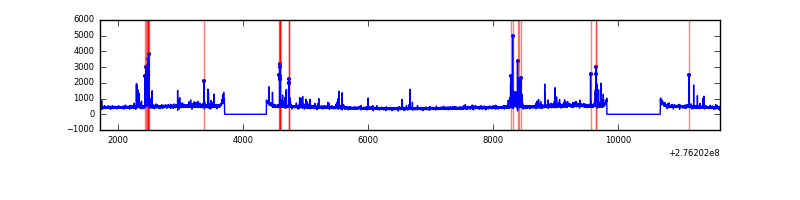 |
Top three noisy pixels from each quadrant. If the there are fewer than three noisy pixels in the level2.evt file, extra rows are filled as -1
| Pixel properties | Quadrant properties | ||||||
|---|---|---|---|---|---|---|---|
| Quadrant | DetID | PixID | Counts | Sigma | Mean | Median | Sigma |
| A | 15 | 174 | 362417 | 1734.4 | 1024 | 999 | 208.4 |
| A | 13 | 248 | 23972 | 110.24 | 1024 | 999 | 208.4 |
| A | 0 | 226 | 8851 | 37.68 | 1024 | 999 | 208.4 |
| B | 0 | 198 | 106061 | 533.26 | 1029 | 1004 | 197.0 |
| B | 0 | 189 | 66423 | 332.06 | 1029 | 1004 | 197.0 |
| B | 15 | 35 | 36881 | 182.11 | 1029 | 1004 | 197.0 |
| C | 3 | 233 | 794704 | 3447.35 | 978 | 982 | 230.2 |
| C | 14 | 238 | 150011 | 647.27 | 978 | 982 | 230.2 |
| C | 0 | 207 | 29947 | 125.8 | 978 | 982 | 230.2 |
| D | 10 | 70 | 191613 | 774.39 | 998 | 965 | 246.2 |
| D | 1 | 52 | 81646 | 327.72 | 998 | 965 | 246.2 |
| D | 12 | 110 | 58221 | 232.57 | 998 | 965 | 246.2 |
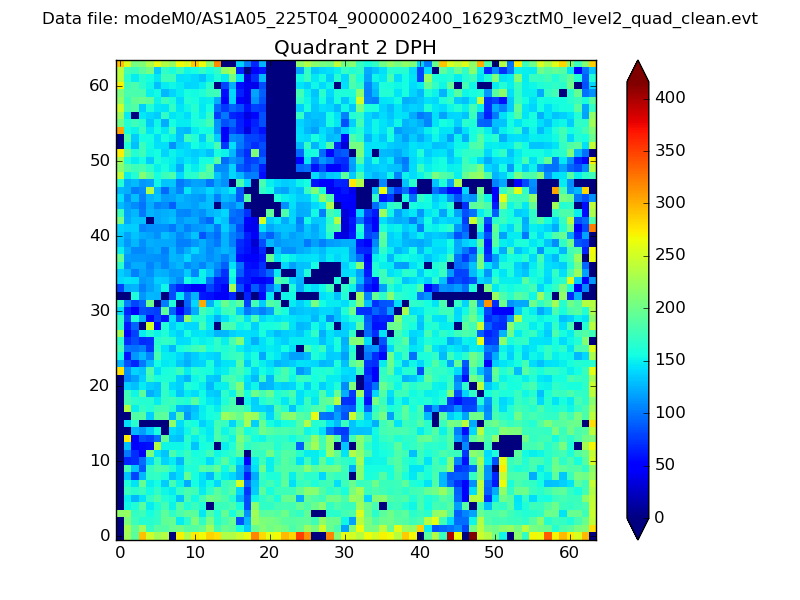
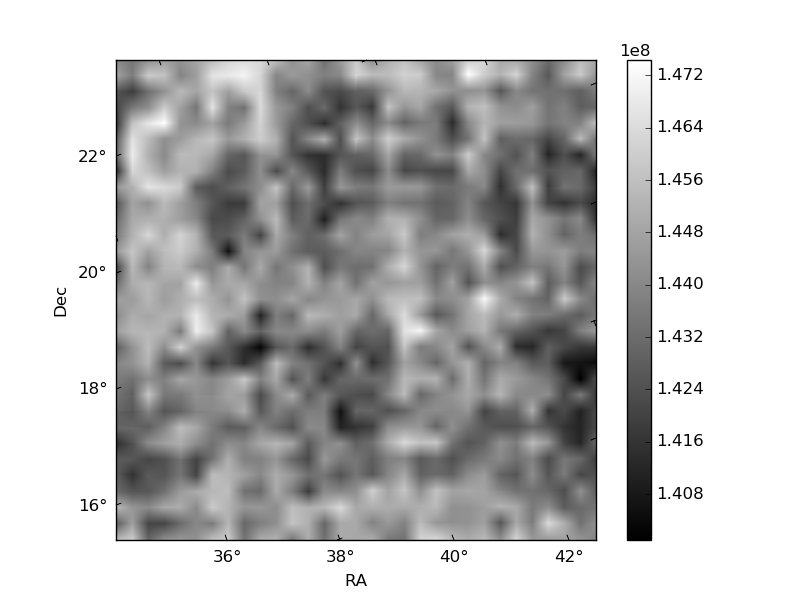
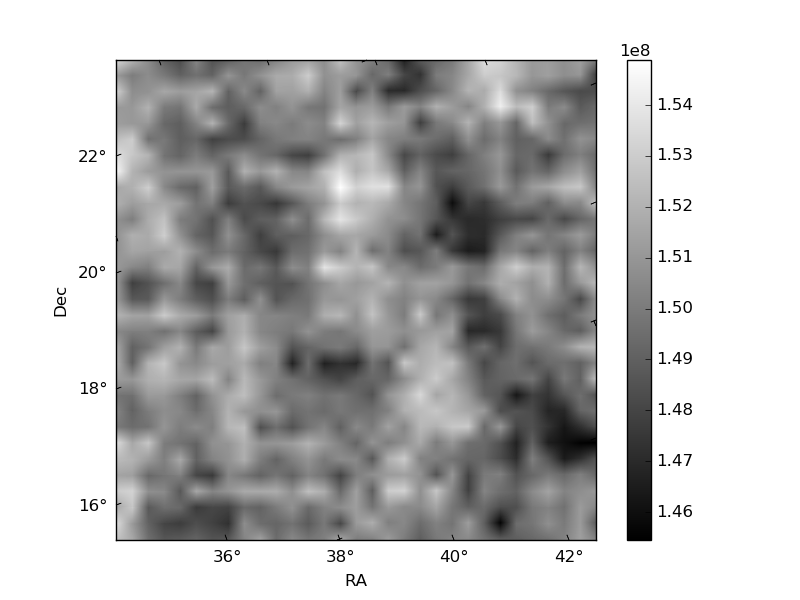
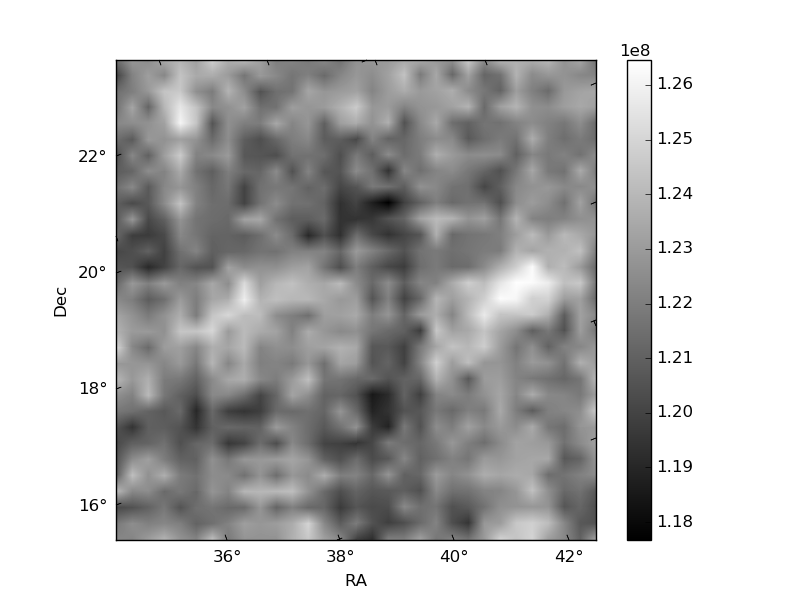
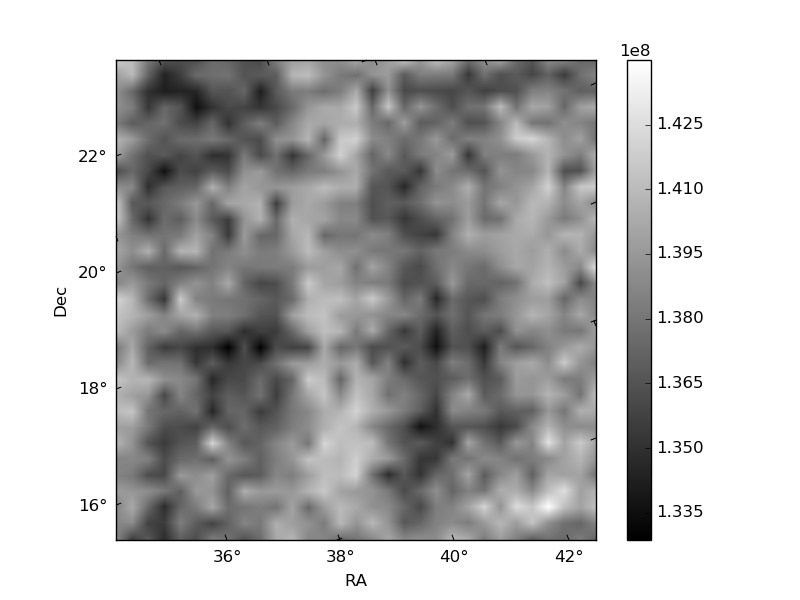
Histogram calculated using DETX and DETY for each event in the final _common_clean file
| Quadrant A | 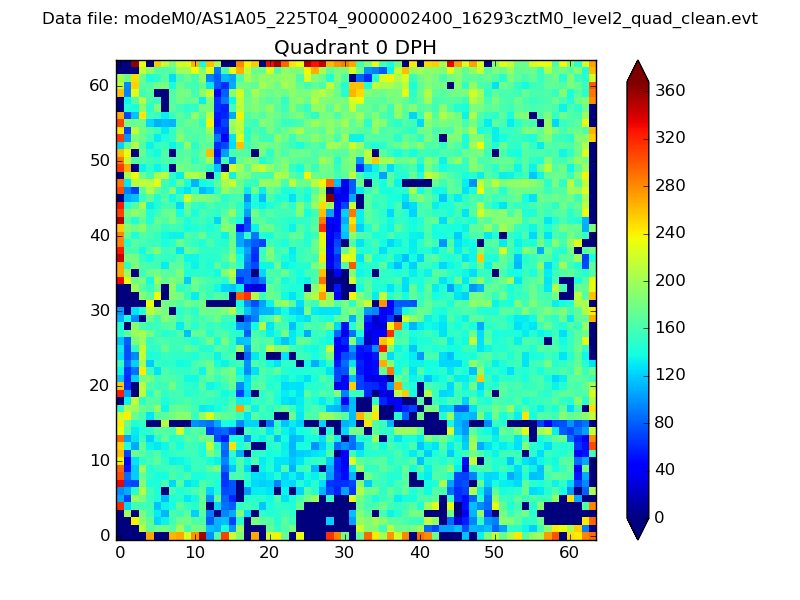 |
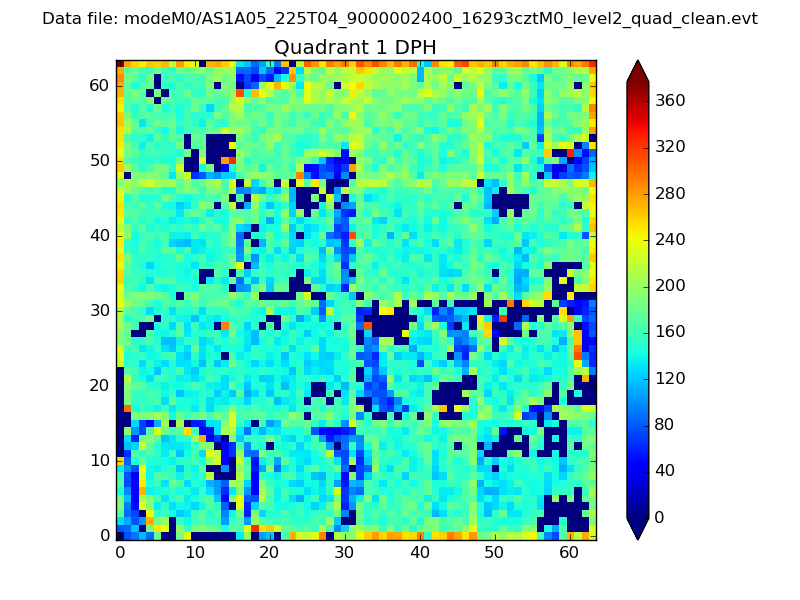 |
Quadrant B |
|---|---|---|---|
| Quadrant D | 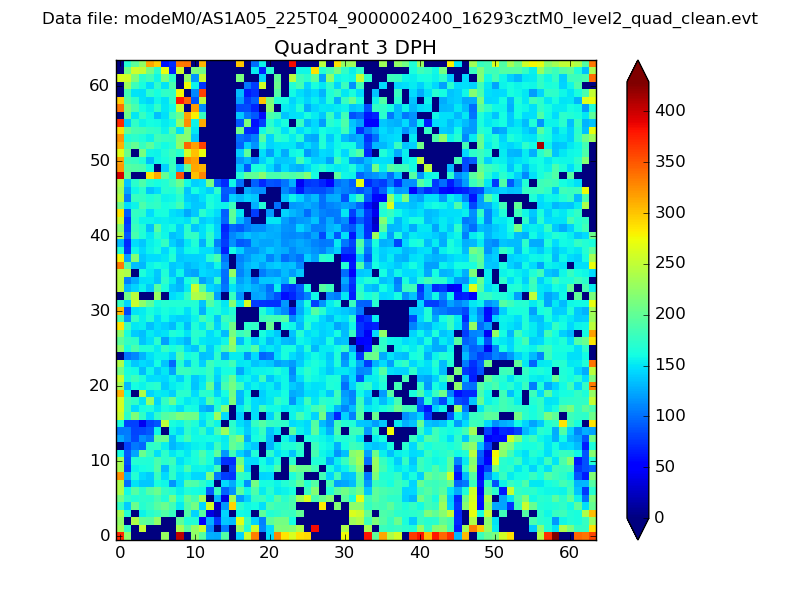 |
 |
Quadrant C |
| Plot type | Count rate plots | Images |
|---|---|---|
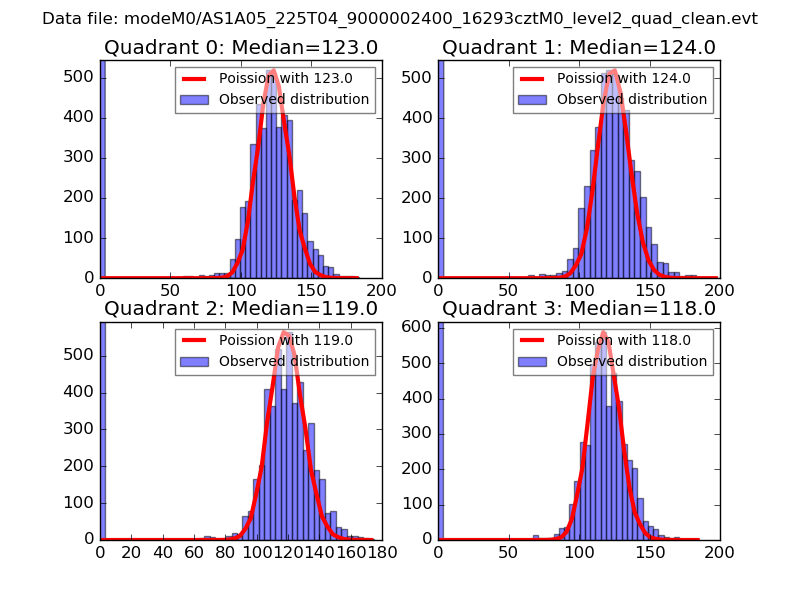
| Comparison with Poisson distribution Blue bars denote a histogram of data divided into 1 sec bins. Red curve is a Poisson curve with rate = median count rate of data. |
 |
 |
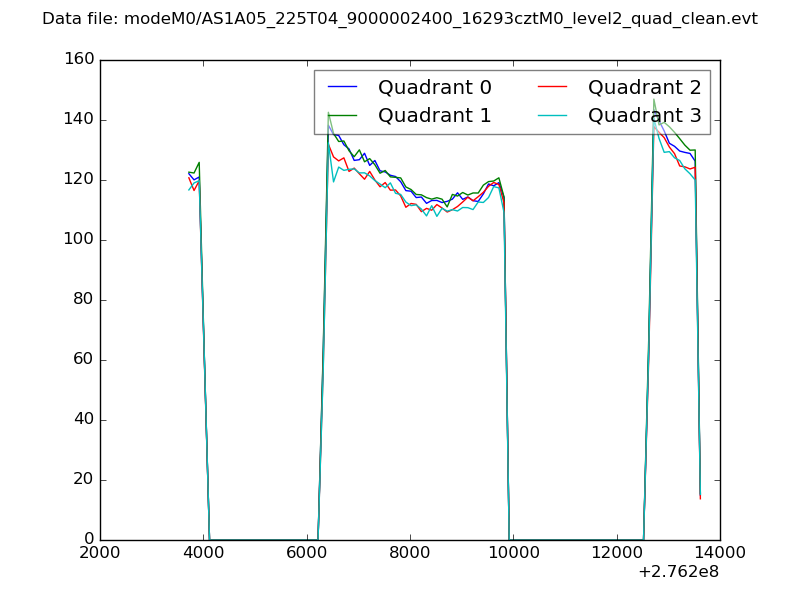
| Quadrant-wise count rates Data is divided into 100 sec bins |
 |
|
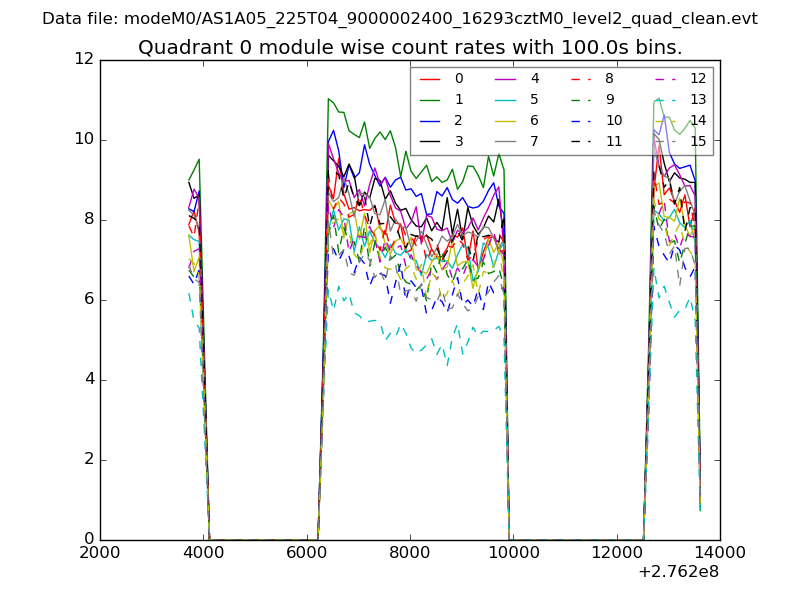
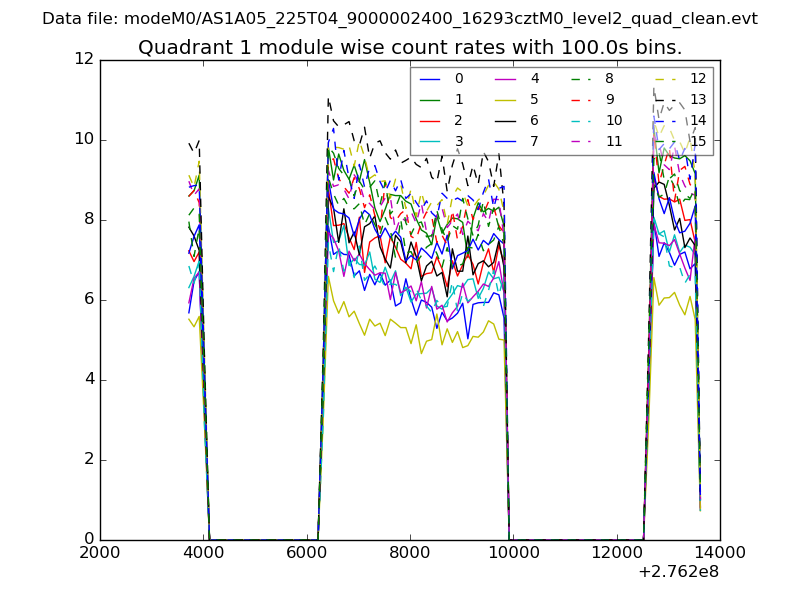
| Module-wise count rates for Quadrant A Data is divided into 100 sec bins |
 |
 |
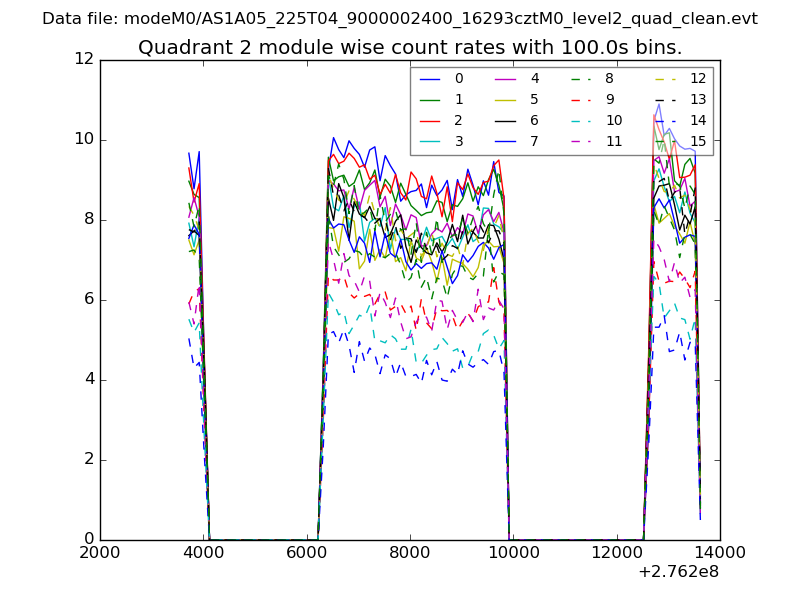
| Module-wise count rates for Quadrant B Data is divided into 100 sec bins |
 |
 |
| Module-wise count rates for Quadrant C Data is divided into 100 sec bins |
 |
 |
| Module-wise count rates for Quadrant D Data is divided into 100 sec bins |
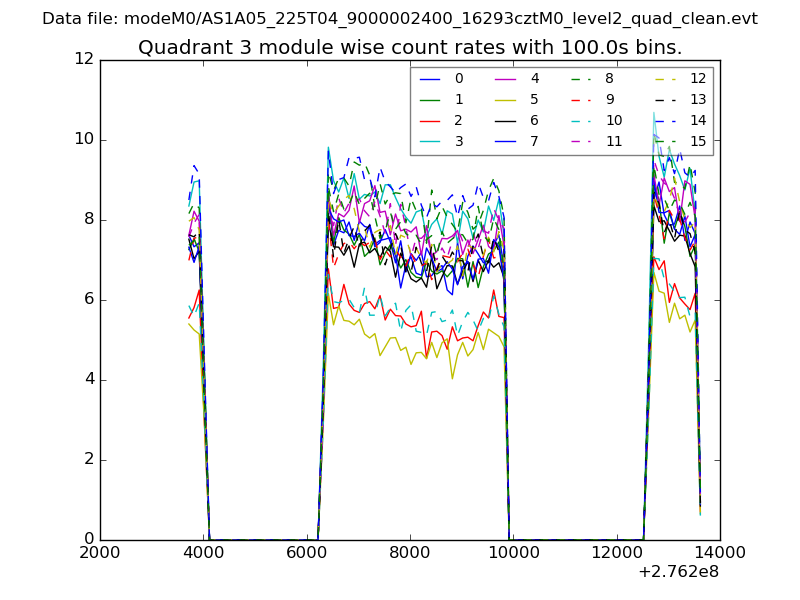 |
 |
| Parameter | Plot |
|---|---|
| CZT HV Monitor | 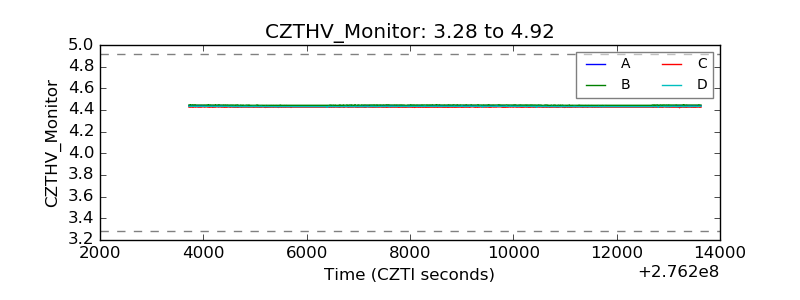 |
| D_VDD | 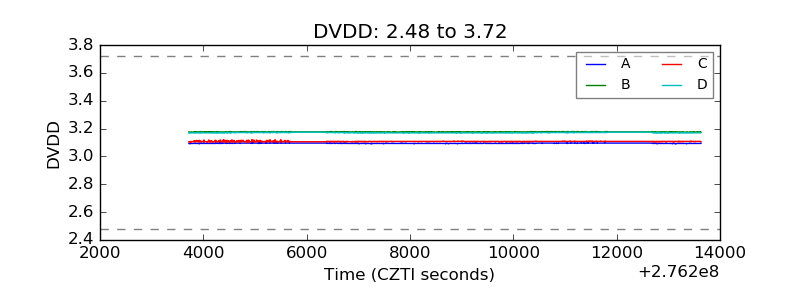 |
| Temperature 1 | 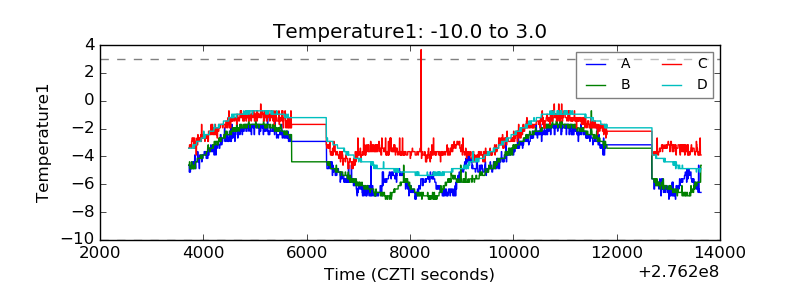 |
| Veto HV Monitor |  |
| Veto LLD | 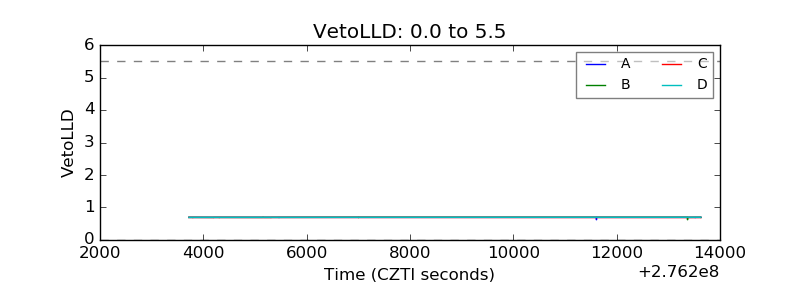 |
| Alpha Counter | 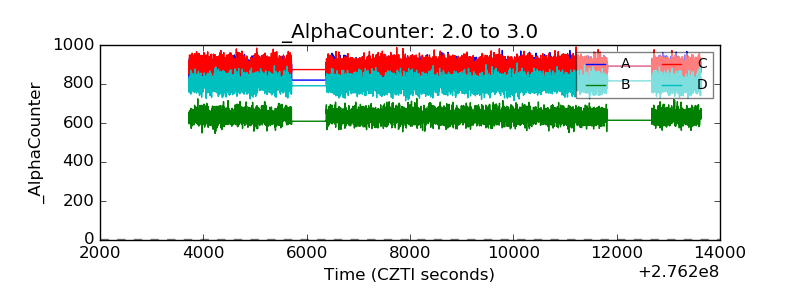 |
| _CPM_Rate | 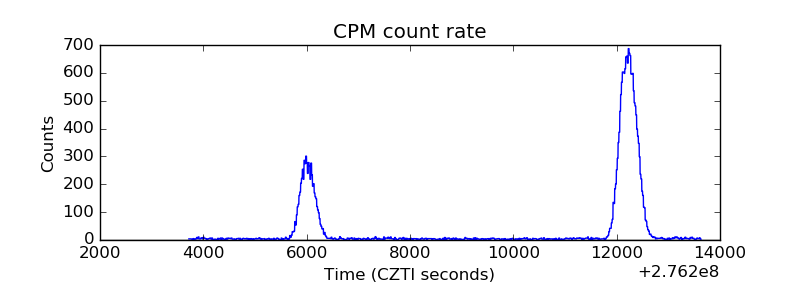 |
| CZT Counter | 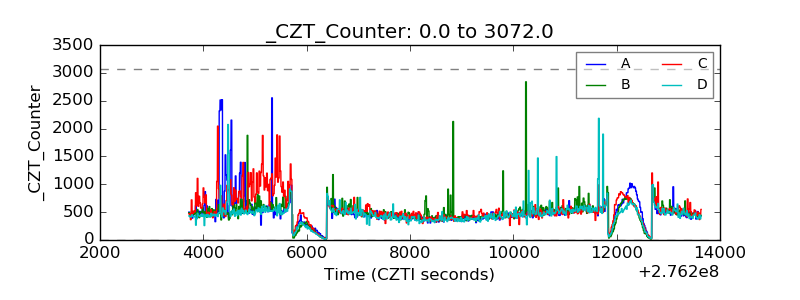 |
| +2.5 Volts monitor |  |
| +5 Volts monitor |  |
| _ROLL_ROT | 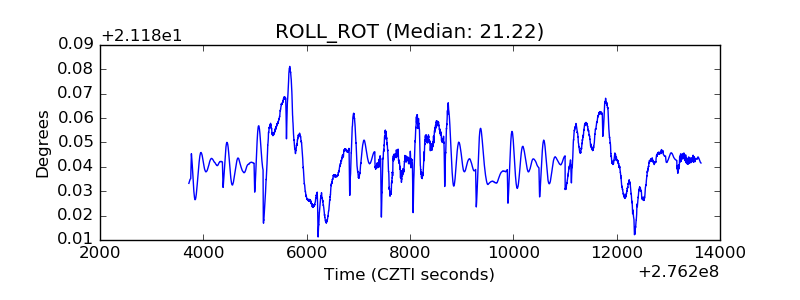 |
| _Roll_DEC | 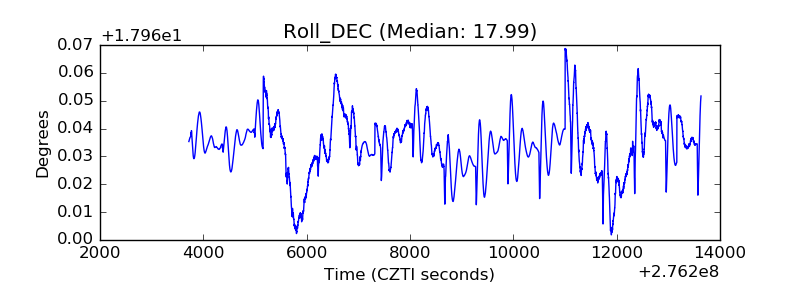 |
| _Roll_RA | 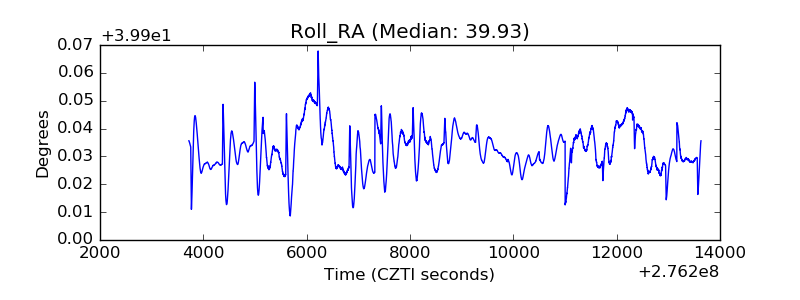 |
| Veto Counter | 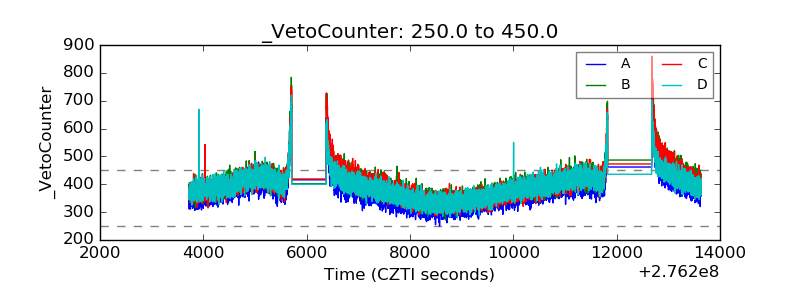 |