| Param | Original file | Final file |
|---|---|---|
| Filename | modeM0/AS1A05_034T01_9000002404cztM0_level2.fits | modeM0/AS1A05_034T01_9000002404cztM0_level2_quad_clean.evt |
| Size (bytes) | 749,888,640 | 704,211,840 |
| Size | 715.1 MB | 671.6 MB |
| Events in quadrant A | 4,591,058 | 4,087,188 |
| Events in quadrant B | 4,418,300 | 4,199,322 |
| Events in quadrant C | 4,565,218 | 4,118,248 |
| Events in quadrant D | 4,011,814 | 3,797,975 |
| Mode M0 | |||
|---|---|---|---|
| Quadrant | BADHDUFLAG | Total packets | Discarded packets |
| A | 0 | 164423 | 0 |
| B | 0 | 163289 | 0 |
| C | 0 | 156347 | 0 |
| D | 0 | 160214 | 0 |
| Mode SS | |||
|---|---|---|---|
| Quadrant | BADHDUFLAG | Total packets | Discarded packets |
| A | 0 | 1522 | 0 |
| B | 0 | 1522 | 0 |
| C | 0 | 1522 | 0 |
| D | 0 | 1522 | 0 |
| Mode M9 | |||
|---|---|---|---|
| Quadrant | BADHDUFLAG | Total packets | Discarded packets |
| A | 0 | 129 | 0 |
| B | 0 | 129 | 0 |
| C | 0 | 129 | 0 |
| D | 0 | 129 | 0 |
| Quadrant | Total seconds | Saturated seconds | Saturation percentage |
|---|---|---|---|
| A | 74732 | 1749 | 2.340363% |
| B | 74732 | 1330 | 1.779693% |
| C | 74732 | 1327 | 1.775678% |
| D | 74732 | 1020 | 1.364877% |
Noise dominated data is calculated using 1-second bins in cleaned event files. If a bin has >2000 counts, and if more than 50% of those come from <1% of pixels, then it is considered to be noise-dominated and hence unusable.
| Quadrant | # 1 sec bins | Bins with >0 counts | Bins with >2000 counts | High rate bins dominated by noise | Noise dominated (total time) | Noise dominated (detector-on time) | Marked lightcurve |
|---|---|---|---|---|---|---|---|
| A | 91398 | 74732 | 0 | 0 | 0.00% | 0.00% | 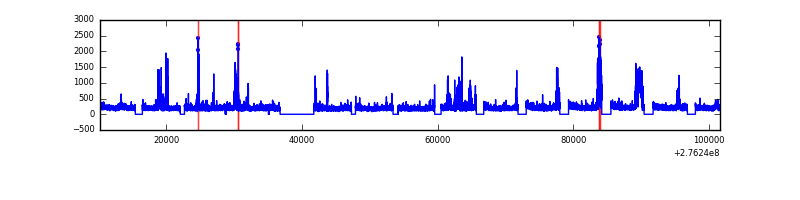 |
| B | 91398 | 74732 | 0 | 0 | 0.00% | 0.00% | 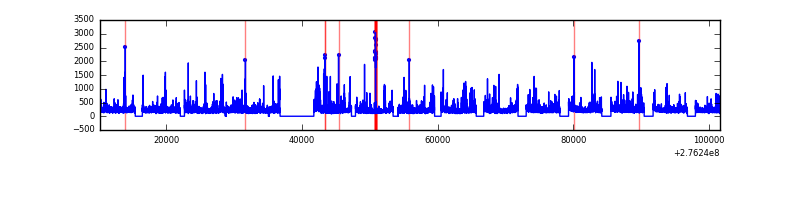 |
| C | 91398 | 74732 | 0 | 0 | 0.00% | 0.00% |  |
| D | 91398 | 74727 | 0 | 0 | 0.00% | 0.00% |  |
Top three noisy pixels from each quadrant. If the there are fewer than three noisy pixels in the level2.evt file, extra rows are filled as -1
| Pixel properties | Quadrant properties | ||||||
|---|---|---|---|---|---|---|---|
| Quadrant | DetID | PixID | Counts | Sigma | Mean | Median | Sigma |
| A | 0 | 29 | 4311 | 10.96 | 1193 | 1120 | 291.2 |
| A | 7 | 110 | 3518 | 8.23 | 1193 | 1120 | 291.2 |
| A | 15 | 236 | 3341 | 7.63 | 1193 | 1120 | 291.2 |
| B | 2 | 9 | 3711 | 11.43 | 1170 | 1120 | 226.7 |
| B | 2 | 8 | 3017 | 8.37 | 1170 | 1120 | 226.7 |
| B | 3 | 17 | 2944 | 8.04 | 1170 | 1120 | 226.7 |
| C | 1 | 81 | 3417 | 7.41 | 1205 | 1130 | 308.8 |
| C | 1 | 80 | 3364 | 7.23 | 1205 | 1130 | 308.8 |
| C | 12 | 241 | 3138 | 6.5 | 1205 | 1130 | 308.8 |
| D | 6 | 67 | 2802 | 5.84 | 1144 | 1043 | 301.1 |
| D | 10 | 189 | 2800 | 5.83 | 1144 | 1043 | 301.1 |
| D | 3 | 14 | 2784 | 5.78 | 1144 | 1043 | 301.1 |
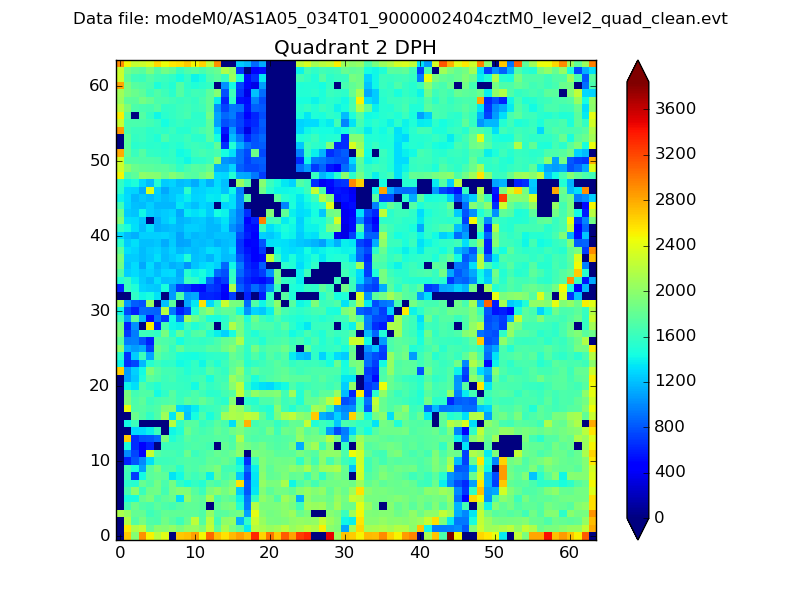
Histogram calculated using DETX and DETY for each event in the final _common_clean file
| Quadrant A | 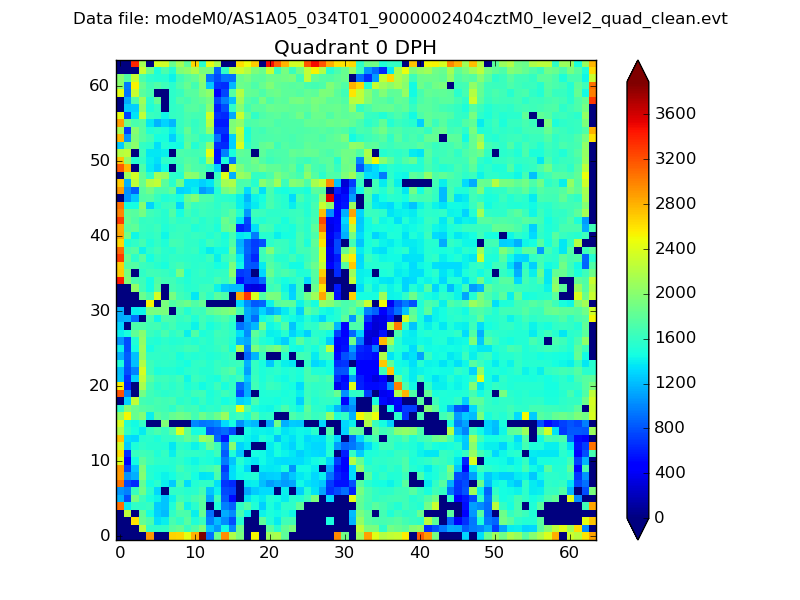 |
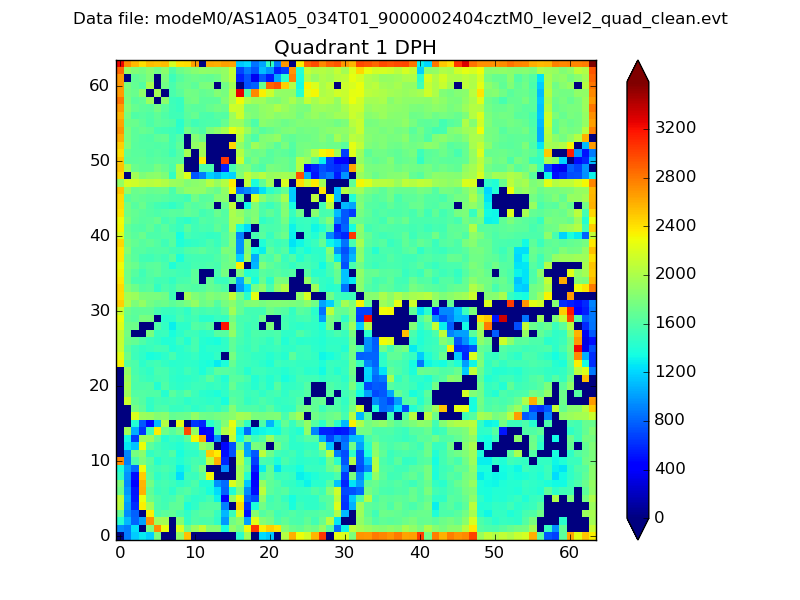 |
Quadrant B |
|---|---|---|---|
| Quadrant D | 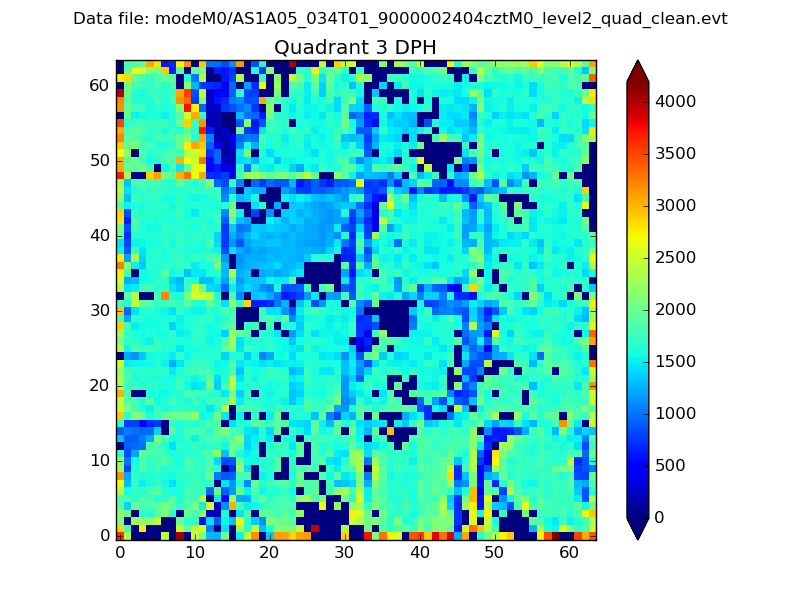 |
 |
Quadrant C |
| Plot type | Count rate plots | Images |
|---|---|---|
| Comparison with Poisson distribution Blue bars denote a histogram of data divided into 1 sec bins. Red curve is a Poisson curve with rate = median count rate of data. |
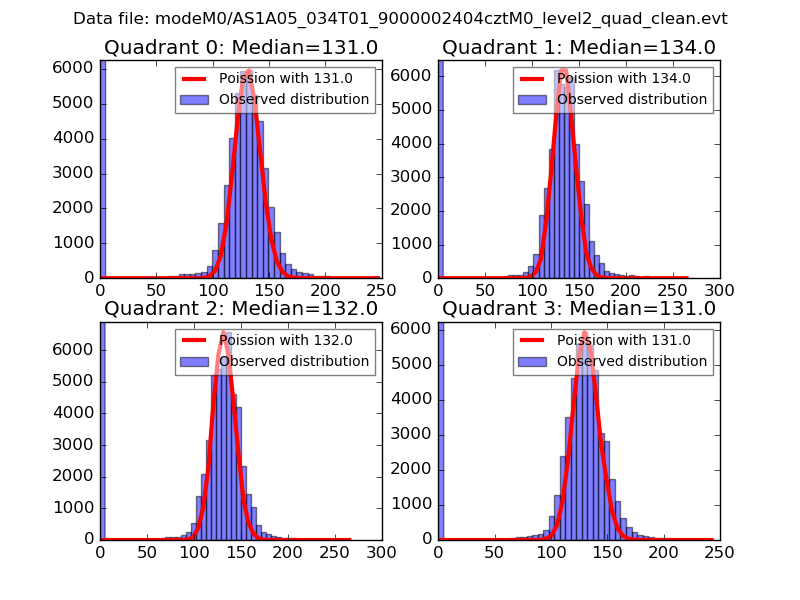 |
 |
| Quadrant-wise count rates Data is divided into 100 sec bins |
 |
|
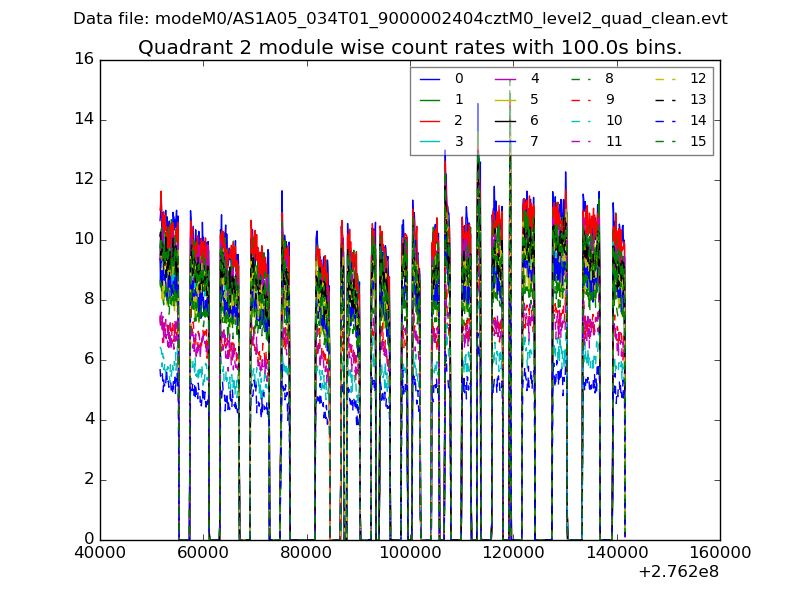
| Module-wise count rates for Quadrant A Data is divided into 100 sec bins |
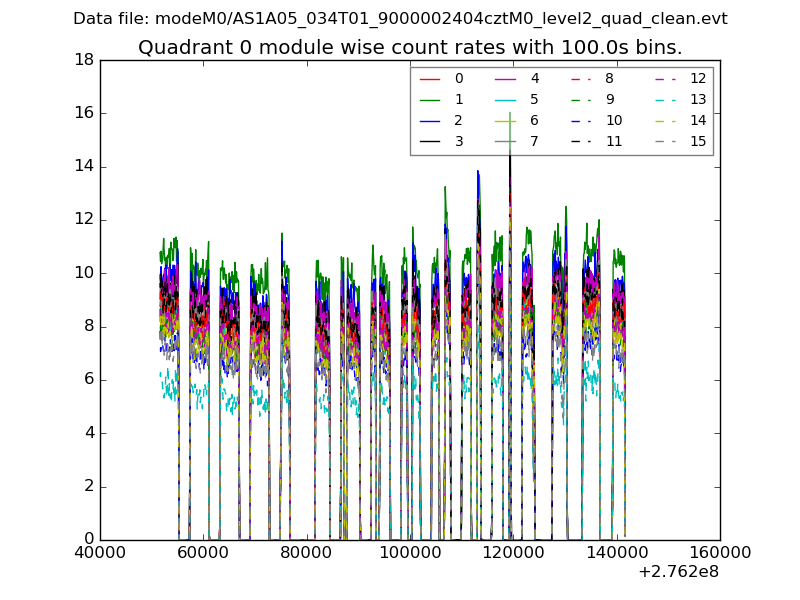 |
 |
| Module-wise count rates for Quadrant B Data is divided into 100 sec bins |
 |
 |
| Module-wise count rates for Quadrant C Data is divided into 100 sec bins |
 |
 |
| Module-wise count rates for Quadrant D Data is divided into 100 sec bins |
 |
 |
| Parameter | Plot |
|---|---|
| CZT HV Monitor |  |
| D_VDD |  |
| Temperature 1 |  |
| Veto HV Monitor |  |
| Veto LLD | 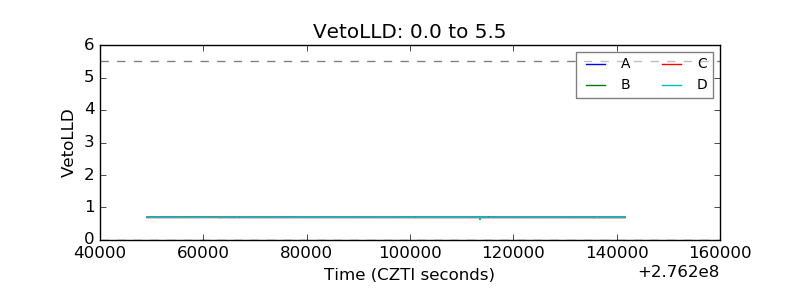 |
| Alpha Counter |  |
| _CPM_Rate | 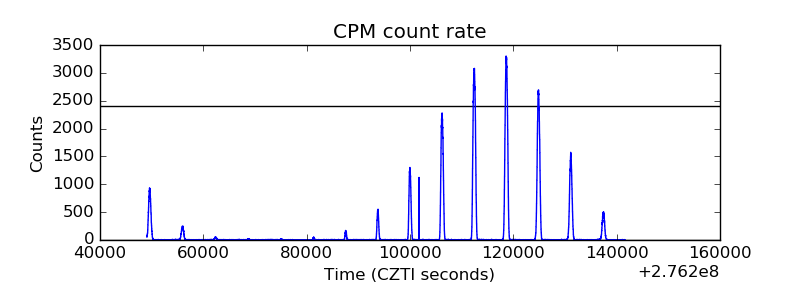 |
| CZT Counter |  |
| +2.5 Volts monitor |  |
| +5 Volts monitor |  |
| _ROLL_ROT |  |
| _Roll_DEC |  |
| _Roll_RA | 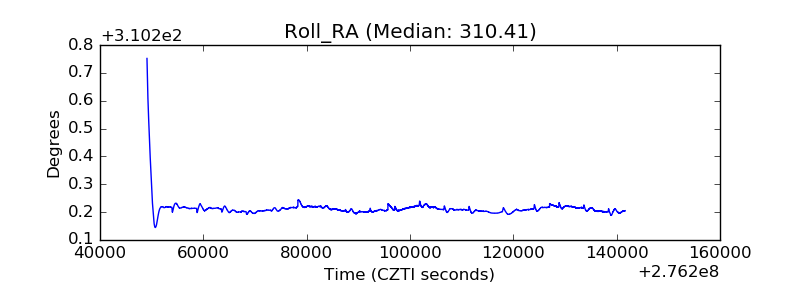 |
| Veto Counter |  |