| Param | Original file | Final file |
|---|---|---|
| Filename | modeM0/AS1A05_034T01_9000002404_16300cztM0_level2.evt | modeM0/AS1A05_034T01_9000002404_16300cztM0_level2_quad_clean.evt |
| Size (bytes) | 464,284,800 | 88,378,560 |
| Size | 442.8 MB | 84.3 MB |
| Events in quadrant A | 3,359,518 | 551,108 |
| Events in quadrant B | 3,536,889 | 561,721 |
| Events in quadrant C | 3,413,631 | 554,900 |
| Events in quadrant D | 3,304,358 | 550,410 |
| Mode M0 | |||
|---|---|---|---|
| Quadrant | BADHDUFLAG | Total packets | Discarded packets |
| A | 0 | 13751 | 3 |
| B | 0 | 14286 | 2 |
| C | 0 | 13935 | 2 |
| D | 0 | 13914 | 2 |
| Mode SS | |||
|---|---|---|---|
| Quadrant | BADHDUFLAG | Total packets | Discarded packets |
| A | 0 | 134 | 0 |
| B | 0 | 134 | 0 |
| C | 0 | 134 | 0 |
| D | 0 | 134 | 0 |
| Mode M9 | |||
|---|---|---|---|
| Quadrant | BADHDUFLAG | Total packets | Discarded packets |
| A | 0 | 22 | 0 |
| B | 0 | 22 | 0 |
| C | 0 | 22 | 0 |
| D | 0 | 22 | 0 |
| Quadrant | Total seconds | Saturated seconds | Saturation percentage |
|---|---|---|---|
| A | 6569 | 111 | 1.689755% |
| B | 6569 | 148 | 2.253007% |
| C | 6569 | 175 | 2.664028% |
| D | 6569 | 105 | 1.598417% |
Noise dominated data is calculated using 1-second bins in cleaned event files. If a bin has >2000 counts, and if more than 50% of those come from <1% of pixels, then it is considered to be noise-dominated and hence unusable.
| Quadrant | # 1 sec bins | Bins with >0 counts | Bins with >2000 counts | High rate bins dominated by noise | Noise dominated (total time) | Noise dominated (detector-on time) | Marked lightcurve |
|---|---|---|---|---|---|---|---|
| A | 7615 | 6571 | 0 | 0 | 0.00% | 0.00% | 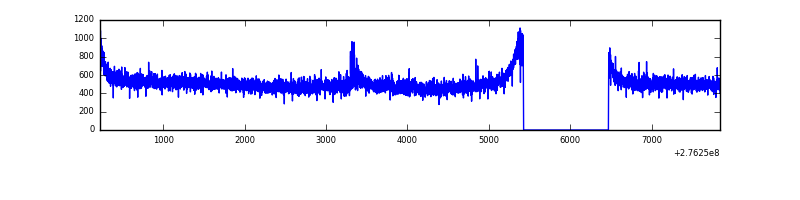 |
| B | 7615 | 6571 | 7 | 7 | 0.09% | 0.11% | 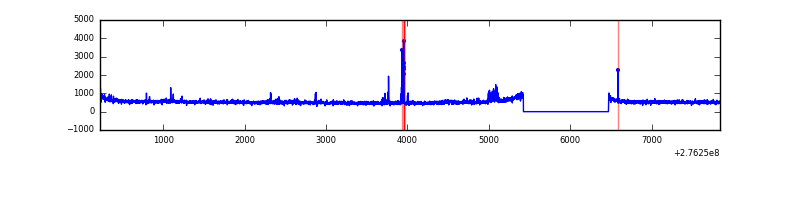 |
| C | 7615 | 6571 | 1 | 1 | 0.01% | 0.02% | 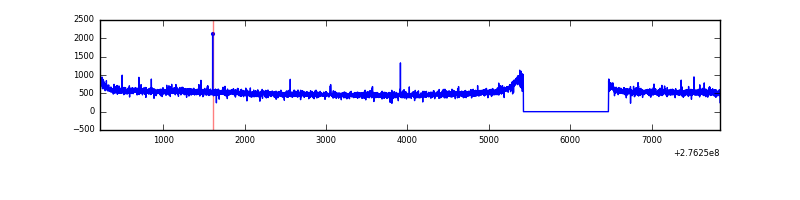 |
| D | 7615 | 6571 | 7 | 7 | 0.09% | 0.11% | 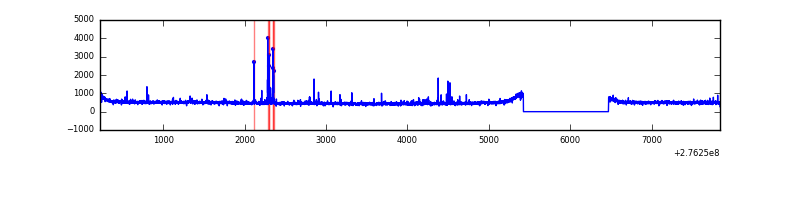 |
Top three noisy pixels from each quadrant. If the there are fewer than three noisy pixels in the level2.evt file, extra rows are filled as -1
| Pixel properties | Quadrant properties | ||||||
|---|---|---|---|---|---|---|---|
| Quadrant | DetID | PixID | Counts | Sigma | Mean | Median | Sigma |
| A | 15 | 174 | 56002 | 321.16 | 859 | 841 | 171.8 |
| A | 0 | 226 | 7725 | 40.08 | 859 | 841 | 171.8 |
| A | 12 | 194 | 6327 | 31.94 | 859 | 841 | 171.8 |
| B | 0 | 189 | 52962 | 320.73 | 857 | 835 | 162.5 |
| B | 15 | 35 | 45196 | 272.95 | 857 | 835 | 162.5 |
| B | 0 | 198 | 37676 | 226.68 | 857 | 835 | 162.5 |
| C | 14 | 238 | 130029 | 676.01 | 831 | 837 | 191.1 |
| C | 7 | 247 | 22345 | 112.54 | 831 | 837 | 191.1 |
| C | 0 | 207 | 18340 | 91.58 | 831 | 837 | 191.1 |
| D | 10 | 70 | 53947 | 243.32 | 841 | 823 | 218.3 |
| D | 1 | 52 | 27398 | 121.72 | 841 | 823 | 218.3 |
| D | 2 | 234 | 23051 | 101.81 | 841 | 823 | 218.3 |
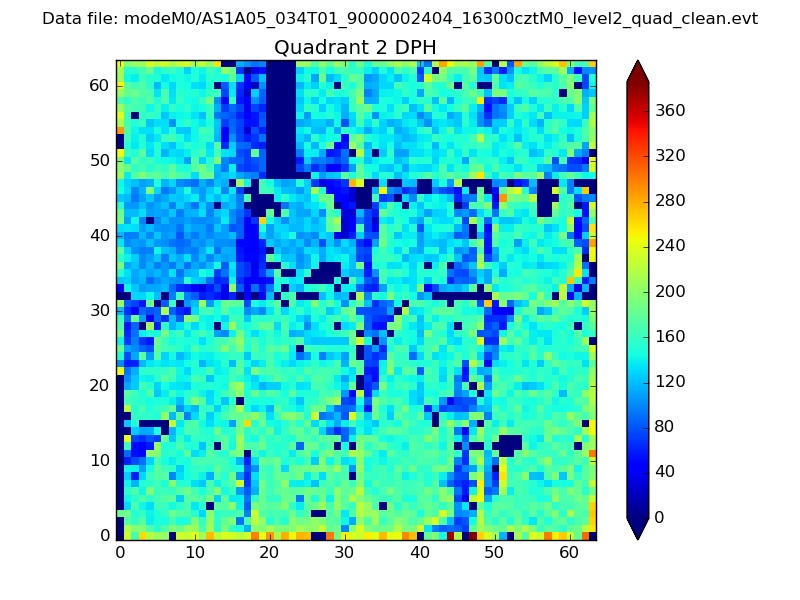
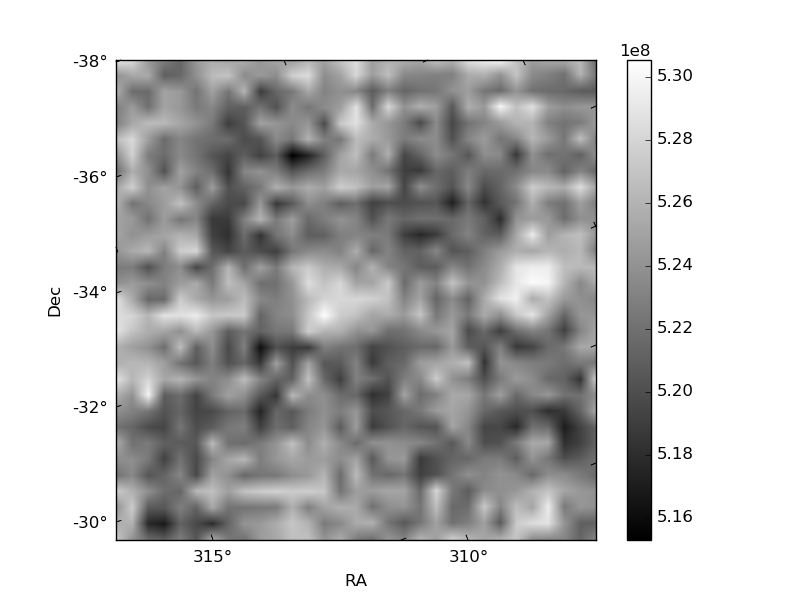
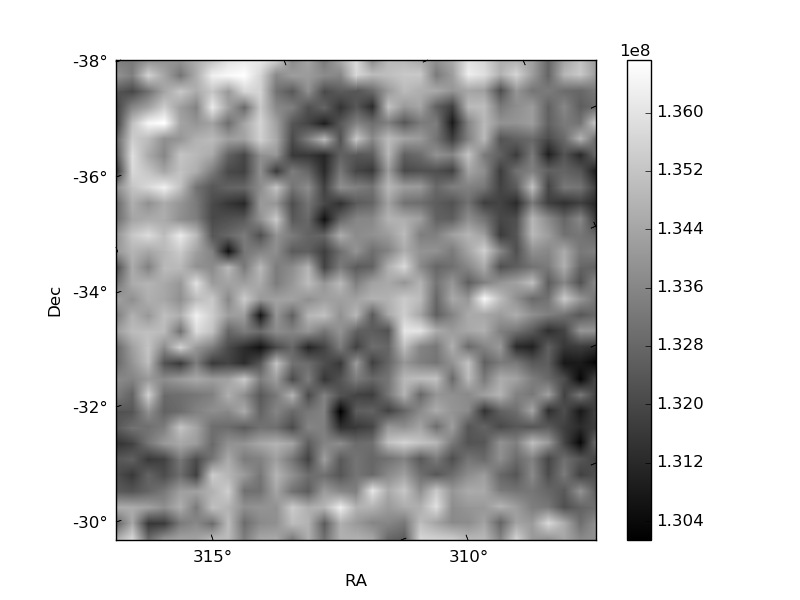
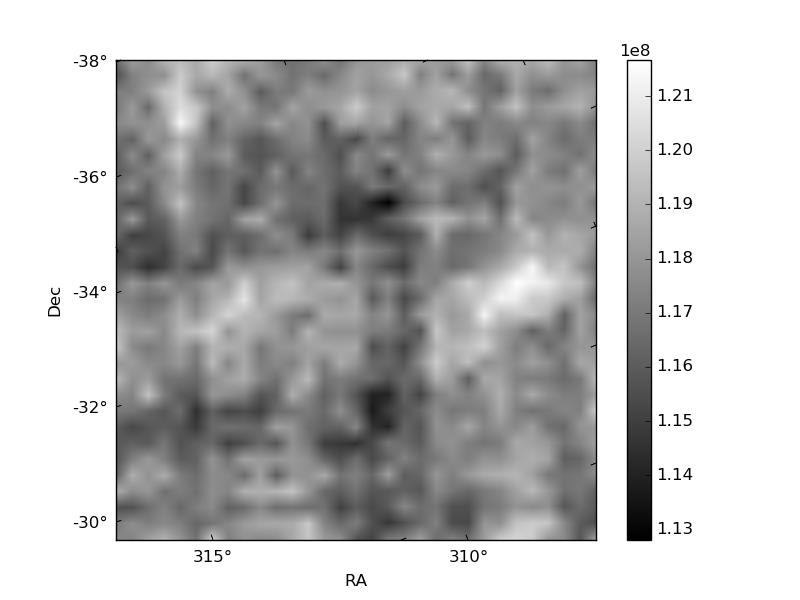
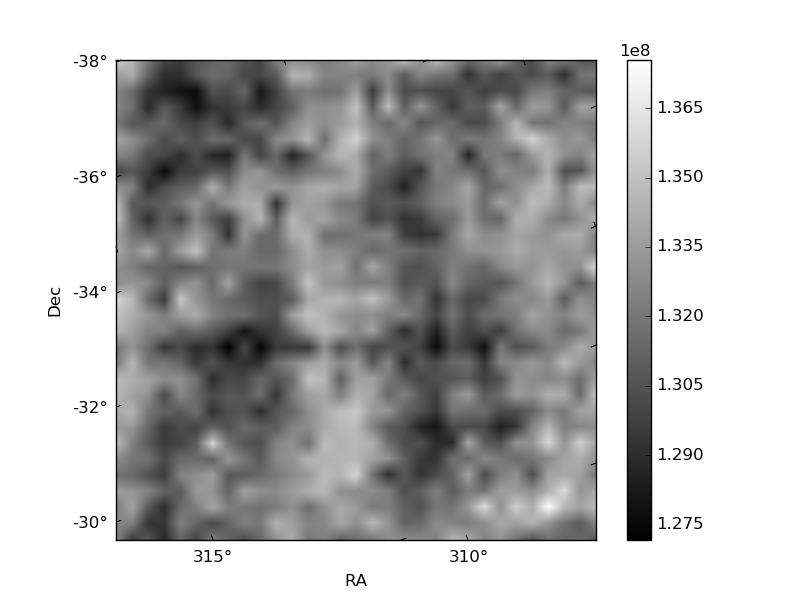
Histogram calculated using DETX and DETY for each event in the final _common_clean file
| Quadrant A | 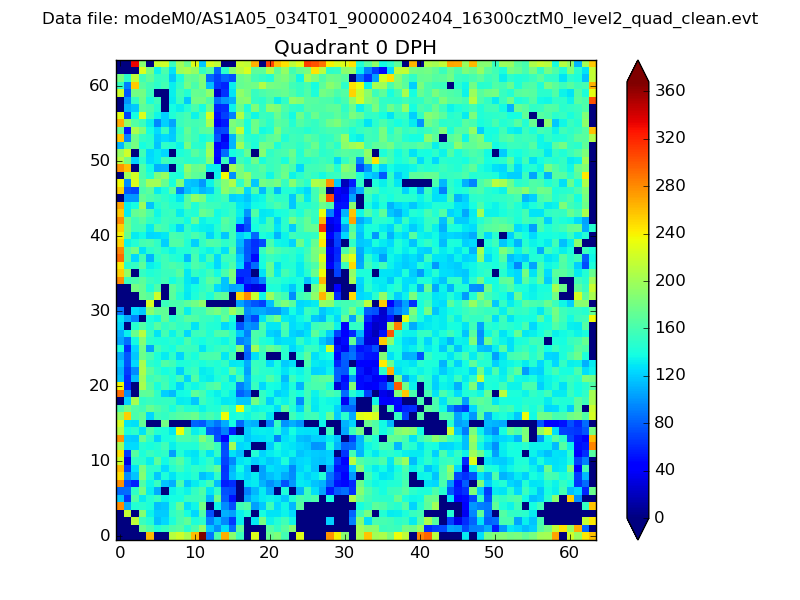 |
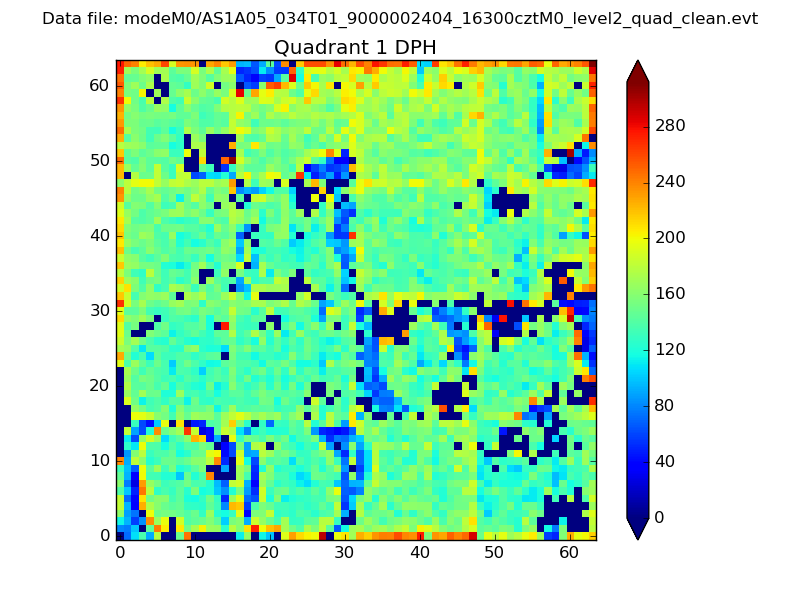 |
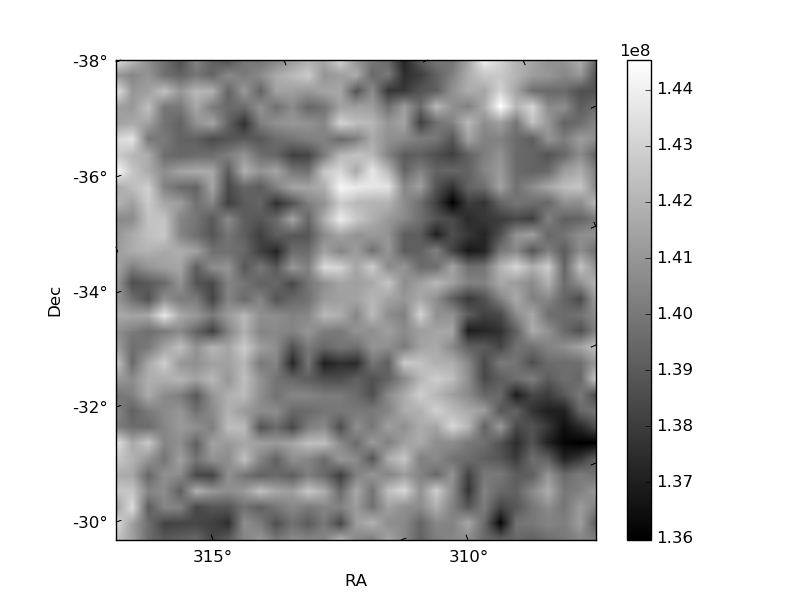
Quadrant B |
|---|---|---|---|
| Quadrant D | 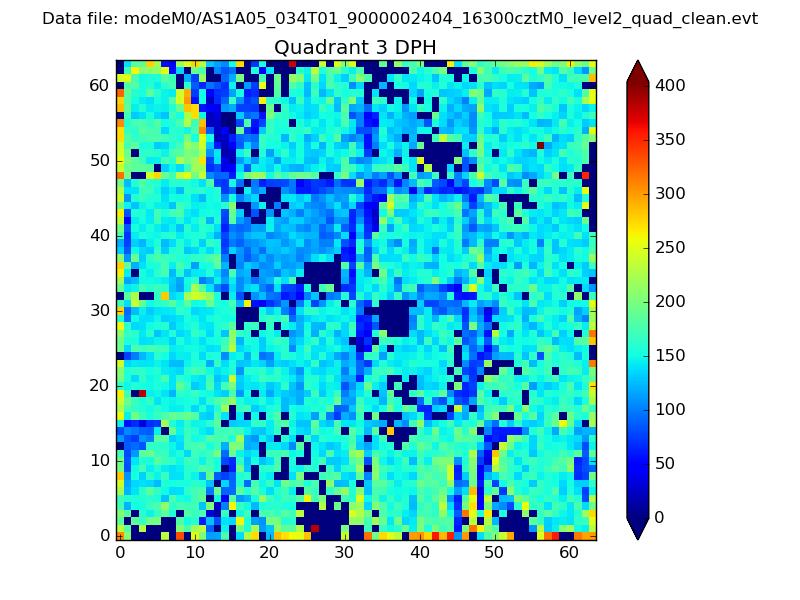 |
 |
Quadrant C |
| Plot type | Count rate plots | Images |
|---|---|---|
| Comparison with Poisson distribution Blue bars denote a histogram of data divided into 1 sec bins. Red curve is a Poisson curve with rate = median count rate of data. |
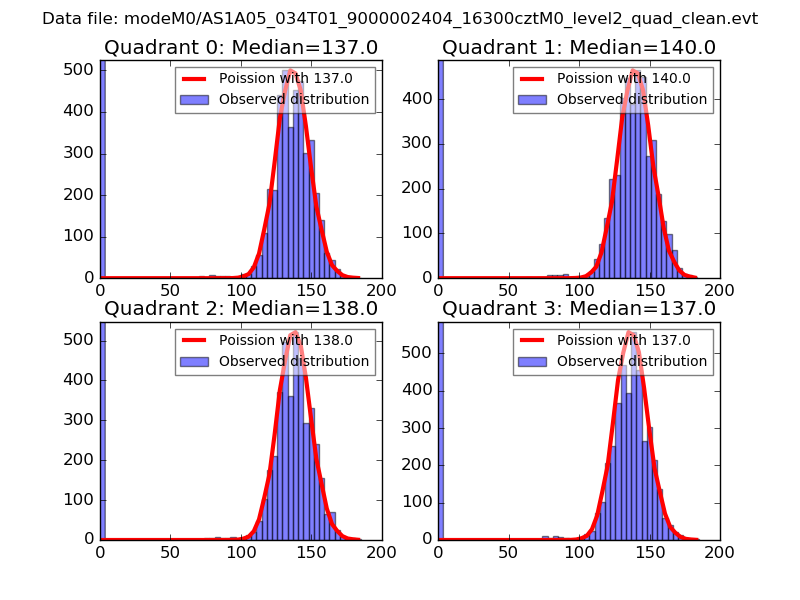 |
 |
| Quadrant-wise count rates Data is divided into 100 sec bins |
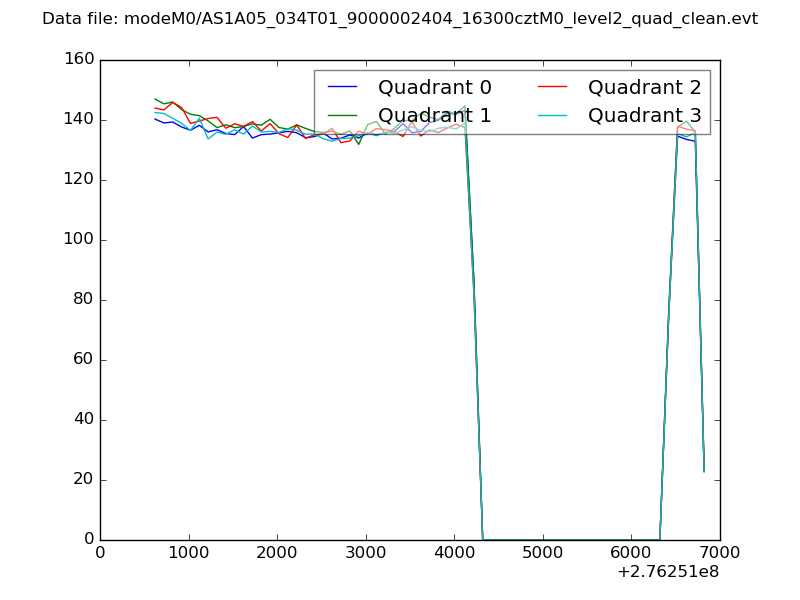 |
|
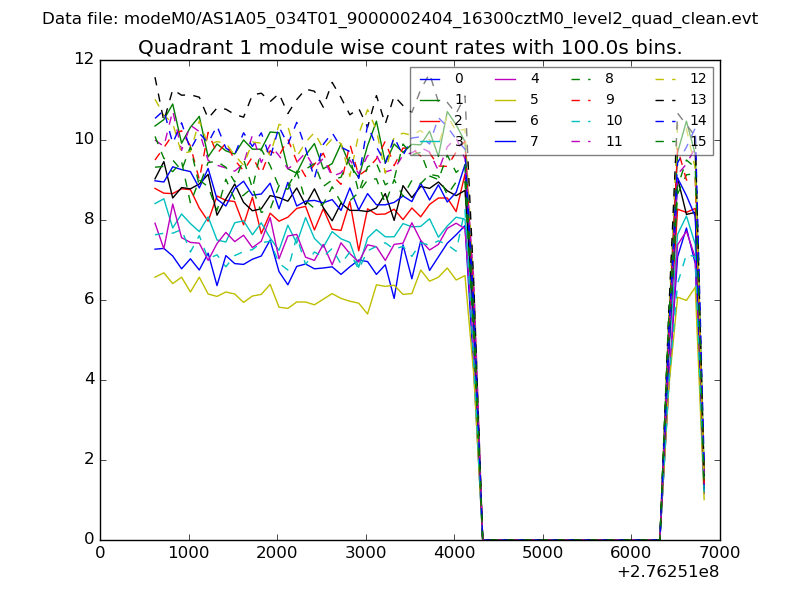
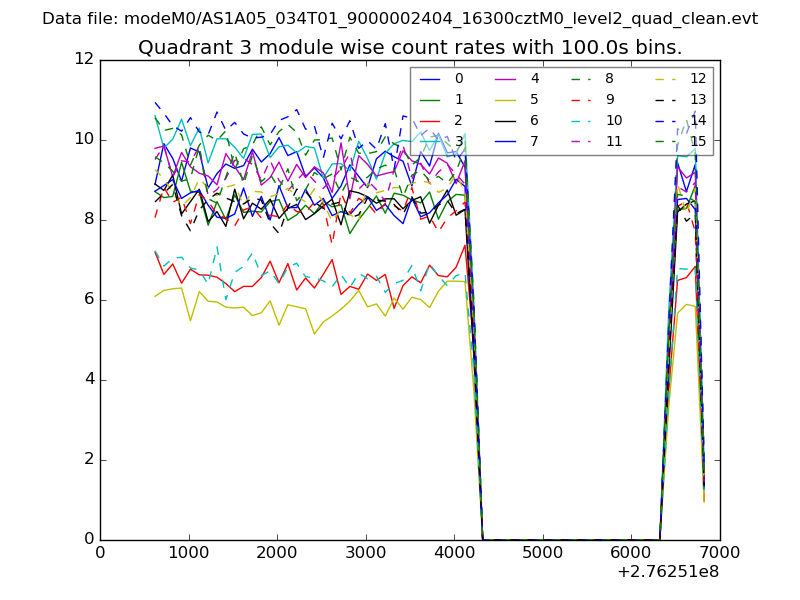
| Module-wise count rates for Quadrant A Data is divided into 100 sec bins |
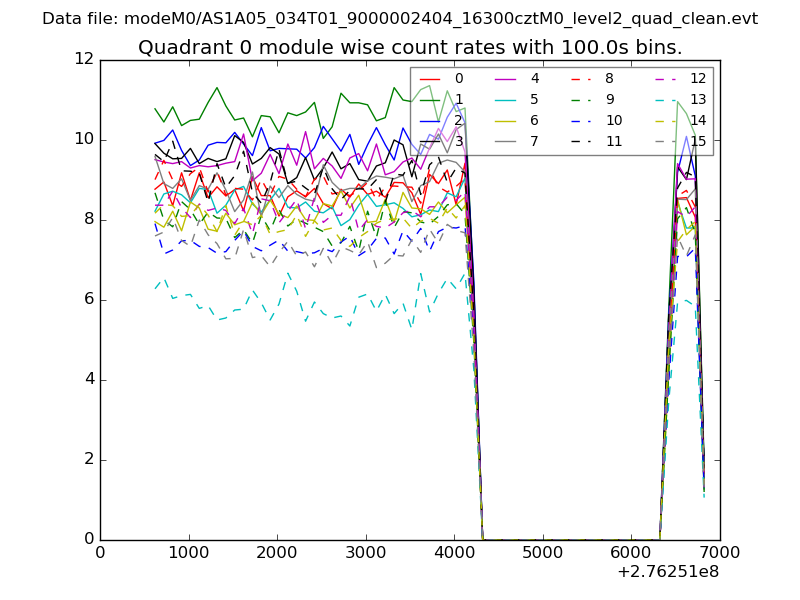 |
 |
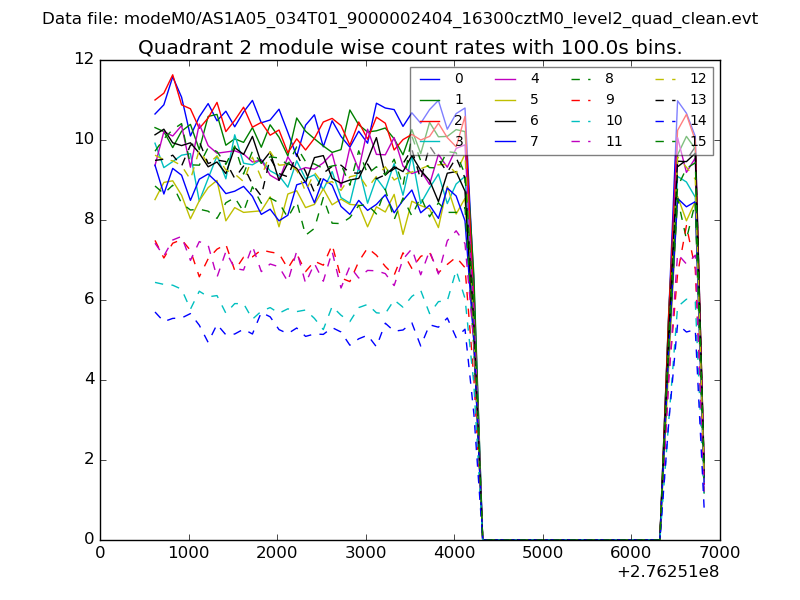
| Module-wise count rates for Quadrant B Data is divided into 100 sec bins |
 |
 |
| Module-wise count rates for Quadrant C Data is divided into 100 sec bins |
 |
 |
| Module-wise count rates for Quadrant D Data is divided into 100 sec bins |
 |
 |
| Parameter | Plot |
|---|---|
| CZT HV Monitor | 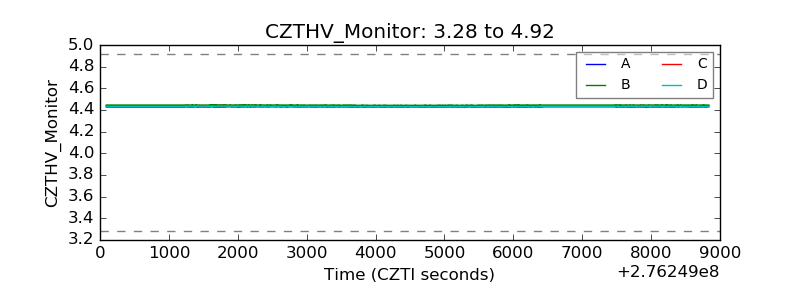 |
| D_VDD | 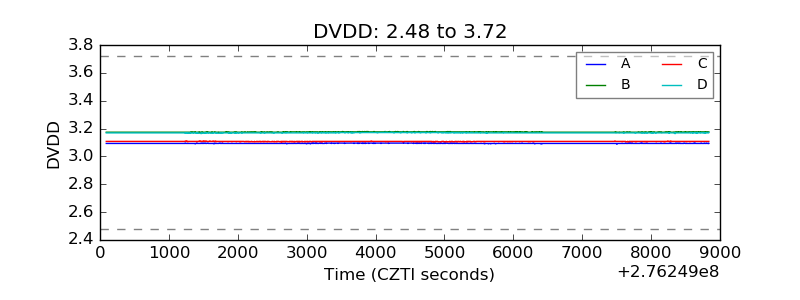 |
| Temperature 1 | 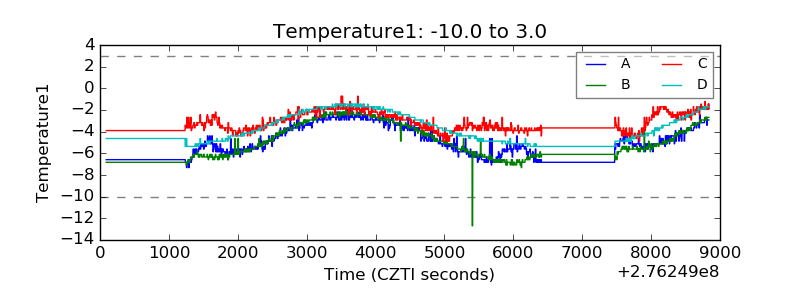 |
| Veto HV Monitor |  |
| Veto LLD | 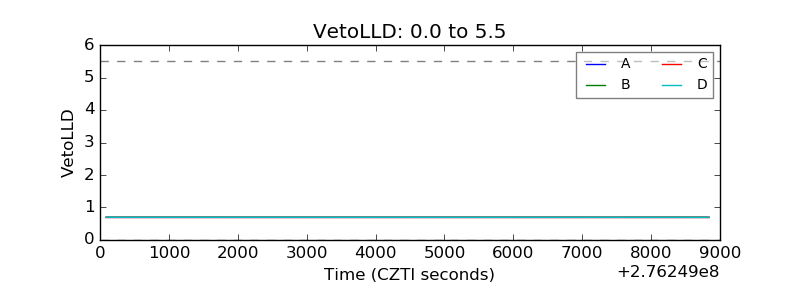 |
| Alpha Counter | 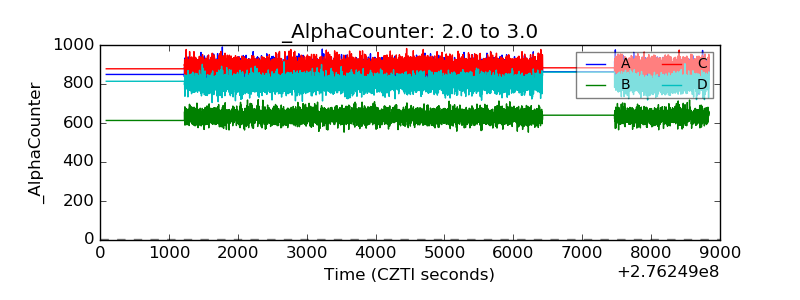 |
| _CPM_Rate | 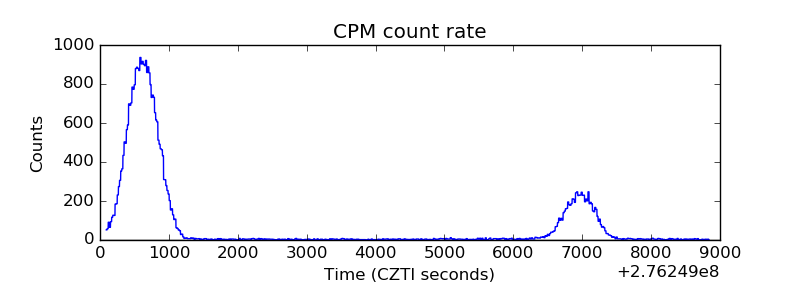 |
| CZT Counter | 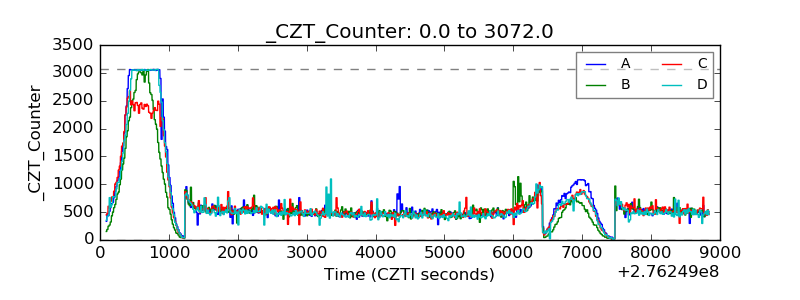 |
| +2.5 Volts monitor |  |
| +5 Volts monitor |  |
| _ROLL_ROT | 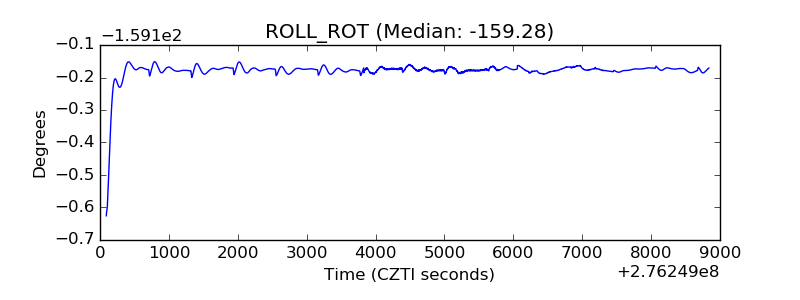 |
| _Roll_DEC | 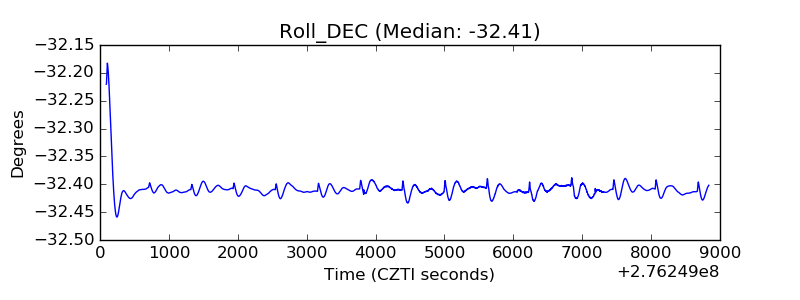 |
| _Roll_RA | 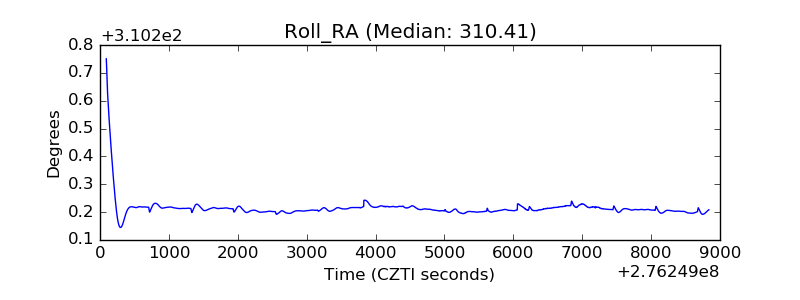 |
| Veto Counter | 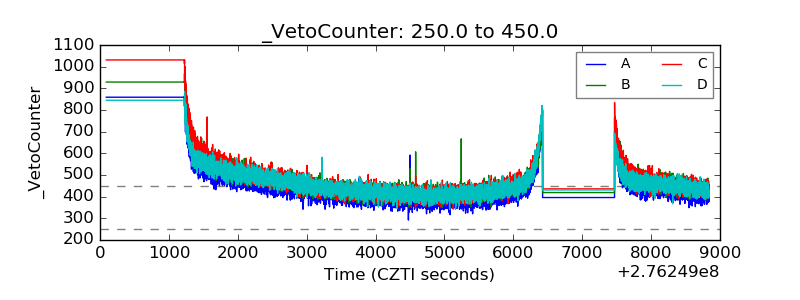 |