| Param | Original file | Final file |
|---|---|---|
| Filename | modeM0/AS1A05_034T01_9000002404_16302cztM0_level2.evt | modeM0/AS1A05_034T01_9000002404_16302cztM0_level2_quad_clean.evt |
| Size (bytes) | 849,087,360 | 175,294,080 |
| Size | 809.8 MB | 167.2 MB |
| Events in quadrant A | 6,485,567 | 1,104,549 |
| Events in quadrant B | 6,369,374 | 1,130,348 |
| Events in quadrant C | 6,042,343 | 1,114,097 |
| Events in quadrant D | 5,977,737 | 1,103,698 |
| Mode M0 | |||
|---|---|---|---|
| Quadrant | BADHDUFLAG | Total packets | Discarded packets |
| A | 0 | 27234 | 3 |
| B | 0 | 26645 | 2 |
| C | 0 | 25806 | 2 |
| D | 0 | 26207 | 2 |
| Mode SS | |||
|---|---|---|---|
| Quadrant | BADHDUFLAG | Total packets | Discarded packets |
| A | 0 | 252 | 0 |
| B | 0 | 252 | 0 |
| C | 0 | 252 | 0 |
| D | 0 | 252 | 0 |
| Mode M9 | |||
|---|---|---|---|
| Quadrant | BADHDUFLAG | Total packets | Discarded packets |
| A | 0 | 8 | 0 |
| B | 0 | 8 | 0 |
| C | 0 | 8 | 0 |
| D | 0 | 8 | 0 |
| Quadrant | Total seconds | Saturated seconds | Saturation percentage |
|---|---|---|---|
| A | 12400 | 362 | 2.919355% |
| B | 12400 | 359 | 2.895161% |
| C | 12400 | 346 | 2.790323% |
| D | 12400 | 258 | 2.080645% |
Noise dominated data is calculated using 1-second bins in cleaned event files. If a bin has >2000 counts, and if more than 50% of those come from <1% of pixels, then it is considered to be noise-dominated and hence unusable.
| Quadrant | # 1 sec bins | Bins with >0 counts | Bins with >2000 counts | High rate bins dominated by noise | Noise dominated (total time) | Noise dominated (detector-on time) | Marked lightcurve |
|---|---|---|---|---|---|---|---|
| A | 13136 | 12405 | 32 | 32 | 0.24% | 0.26% | 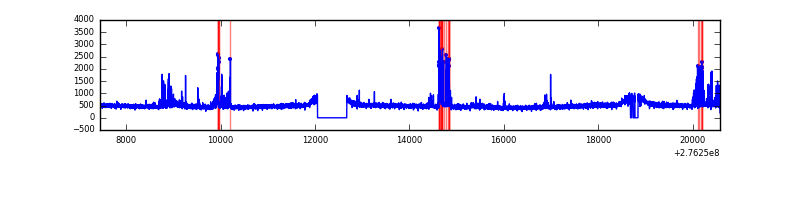 |
| B | 13136 | 12405 | 9 | 9 | 0.07% | 0.07% | 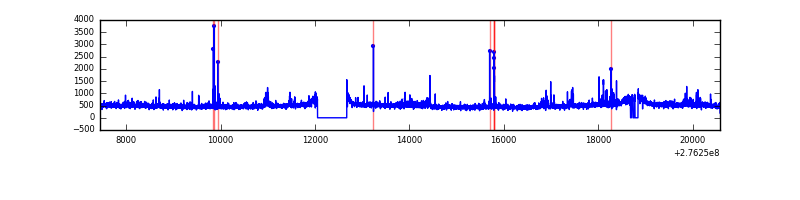 |
| C | 13136 | 12405 | 0 | 0 | 0.00% | 0.00% | 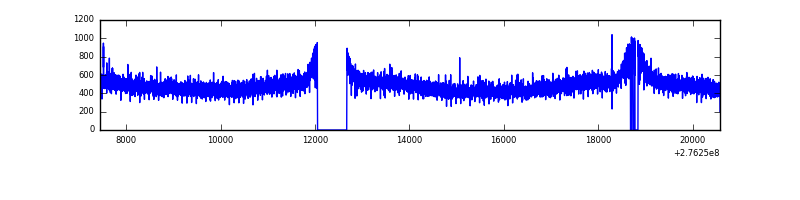 |
| D | 13136 | 12405 | 36 | 36 | 0.27% | 0.29% | 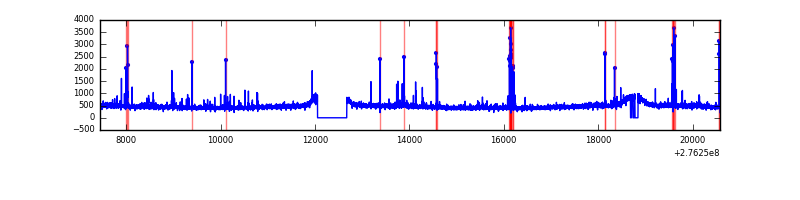 |
Top three noisy pixels from each quadrant. If the there are fewer than three noisy pixels in the level2.evt file, extra rows are filled as -1
| Pixel properties | Quadrant properties | ||||||
|---|---|---|---|---|---|---|---|
| Quadrant | DetID | PixID | Counts | Sigma | Mean | Median | Sigma |
| A | 15 | 174 | 600831 | 1937.38 | 1529 | 1495 | 309.4 |
| A | 0 | 226 | 13142 | 37.65 | 1529 | 1495 | 309.4 |
| A | 12 | 194 | 11399 | 32.02 | 1529 | 1495 | 309.4 |
| B | 0 | 189 | 81854 | 276.8 | 1529 | 1490 | 290.3 |
| B | 0 | 198 | 79916 | 270.12 | 1529 | 1490 | 290.3 |
| B | 15 | 35 | 71639 | 241.61 | 1529 | 1490 | 290.3 |
| C | 14 | 238 | 227007 | 660.77 | 1474 | 1485 | 341.3 |
| C | 3 | 233 | 27389 | 75.9 | 1474 | 1485 | 341.3 |
| C | 7 | 247 | 18016 | 48.43 | 1474 | 1485 | 341.3 |
| D | 10 | 70 | 157070 | 399.78 | 1491 | 1459 | 389.2 |
| D | 2 | 234 | 51227 | 127.86 | 1491 | 1459 | 389.2 |
| D | 1 | 52 | 50156 | 125.11 | 1491 | 1459 | 389.2 |
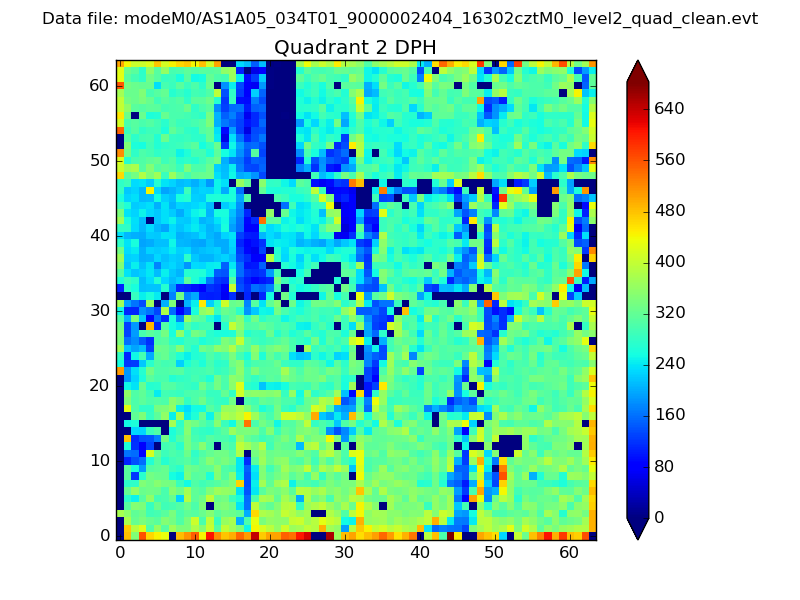
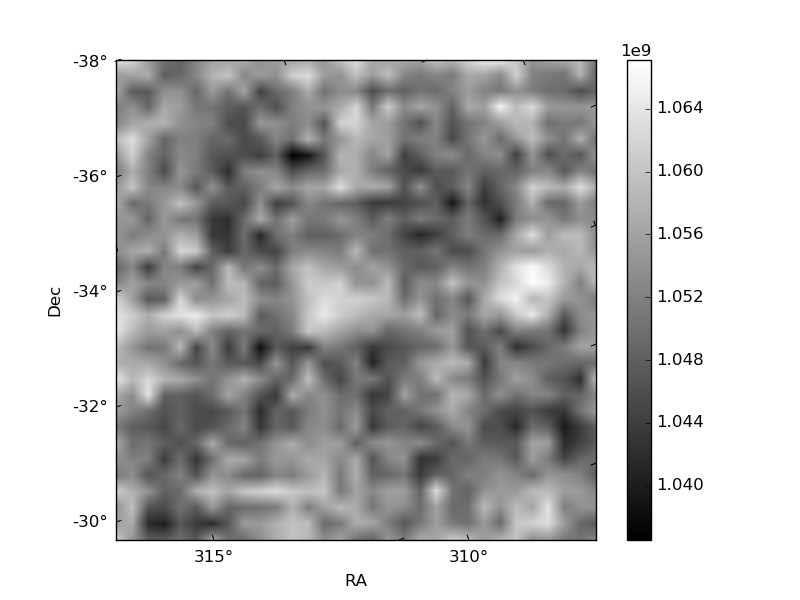
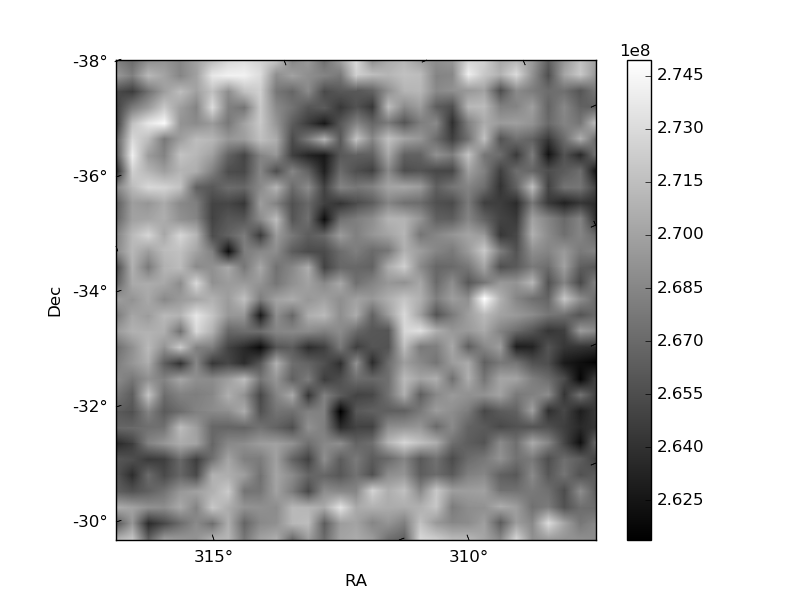
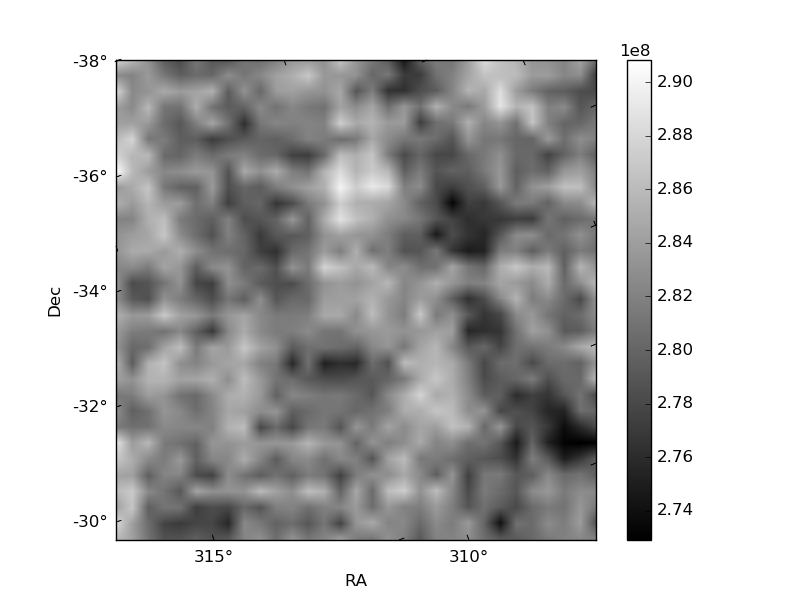
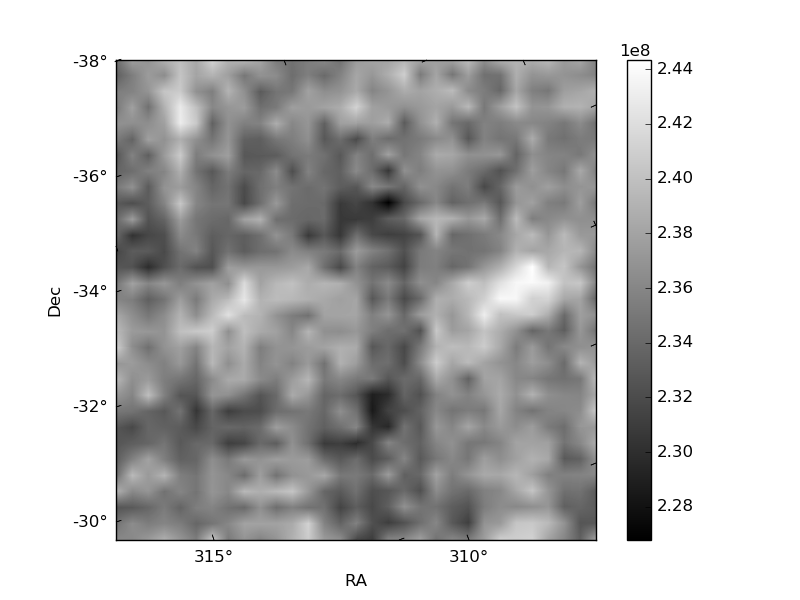
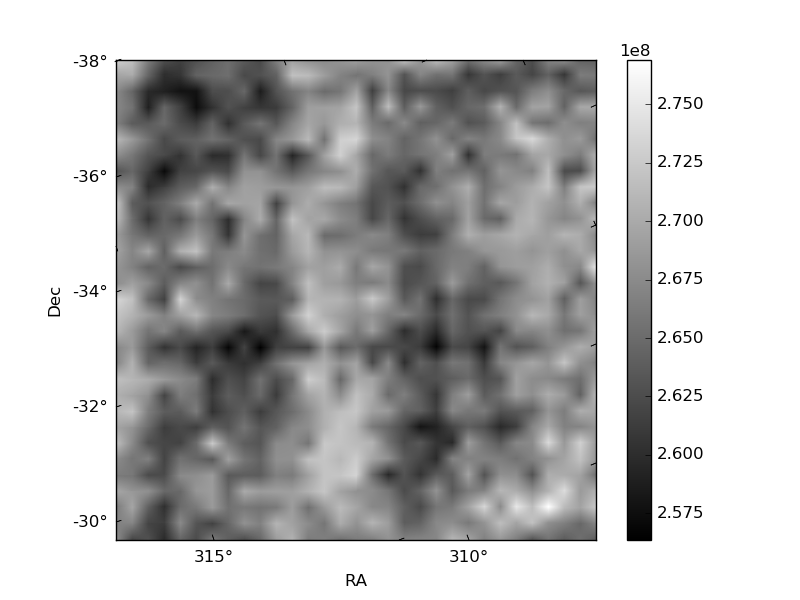
Histogram calculated using DETX and DETY for each event in the final _common_clean file
| Quadrant A | 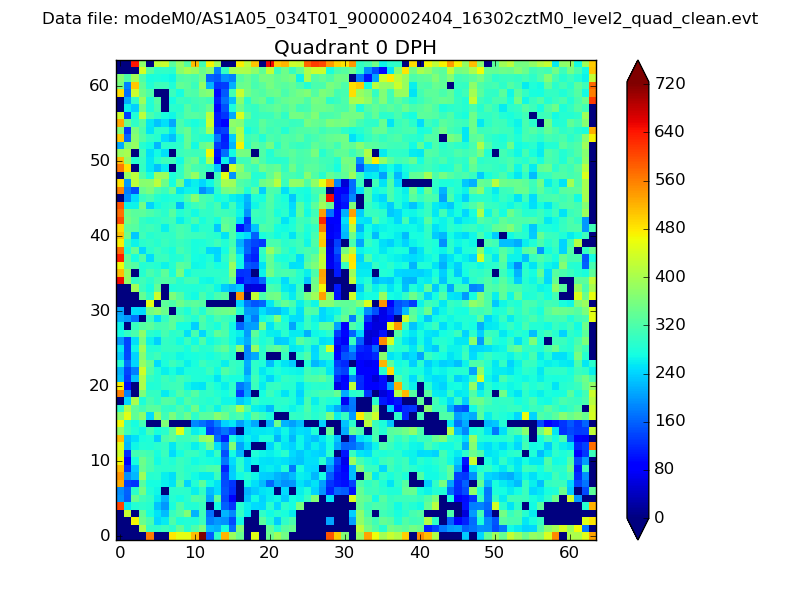 |
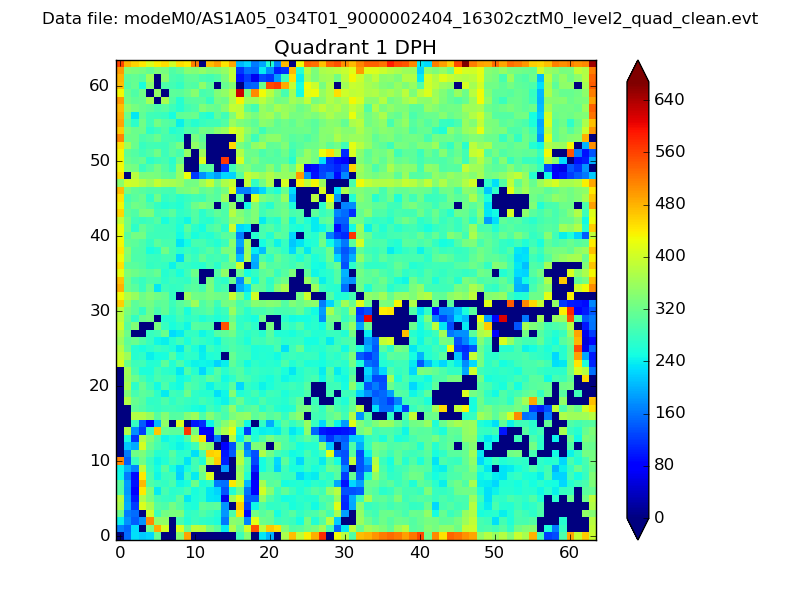 |
Quadrant B |
|---|---|---|---|
| Quadrant D | 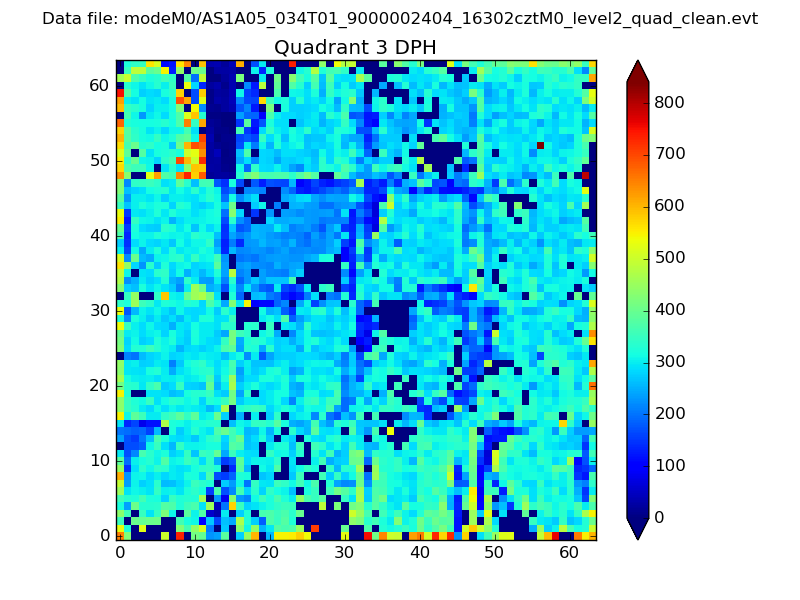 |
 |
Quadrant C |
| Plot type | Count rate plots | Images |
|---|---|---|
| Comparison with Poisson distribution Blue bars denote a histogram of data divided into 1 sec bins. Red curve is a Poisson curve with rate = median count rate of data. |
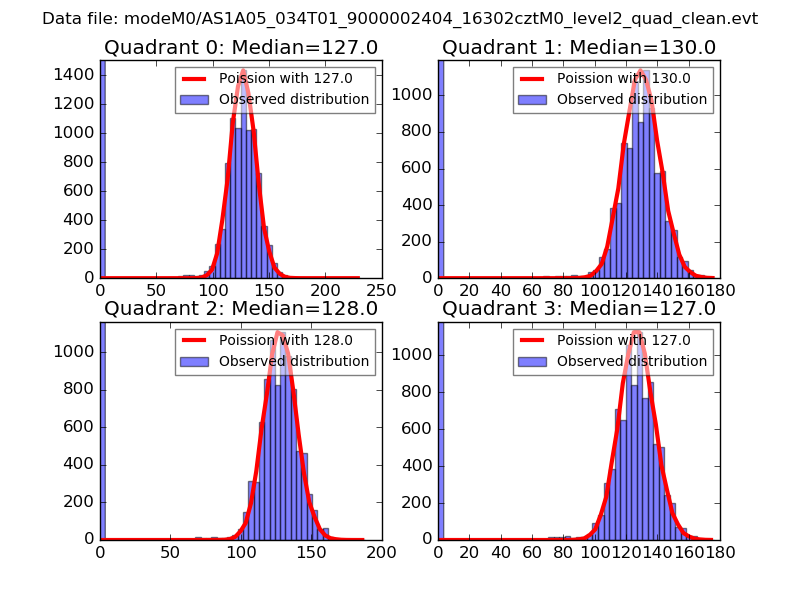 |
 |
| Quadrant-wise count rates Data is divided into 100 sec bins |
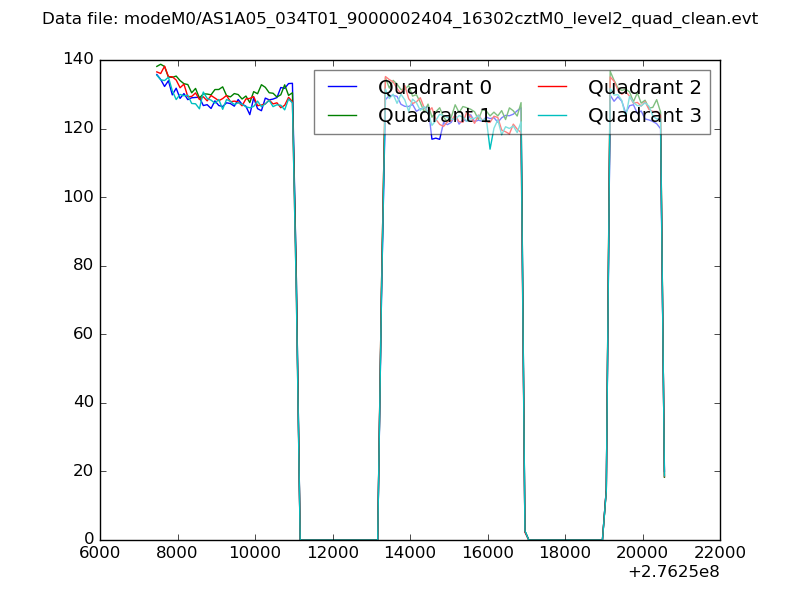 |
|
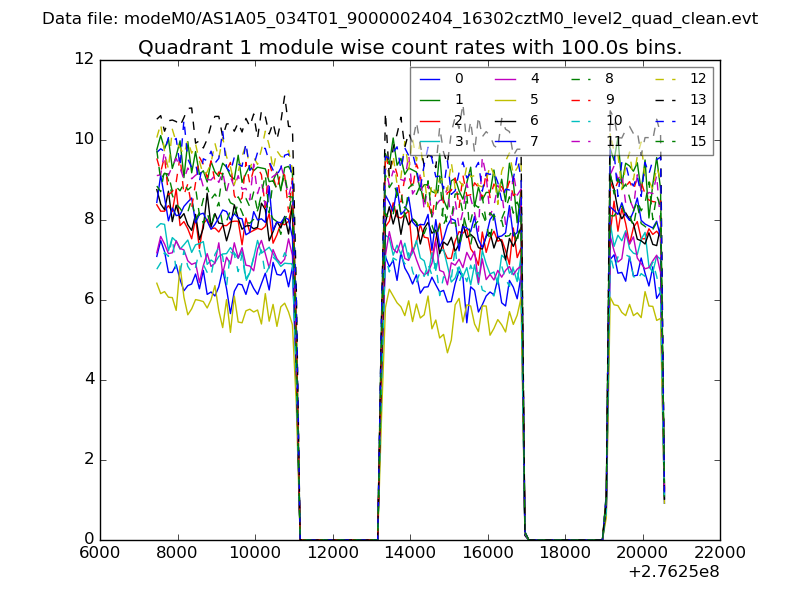
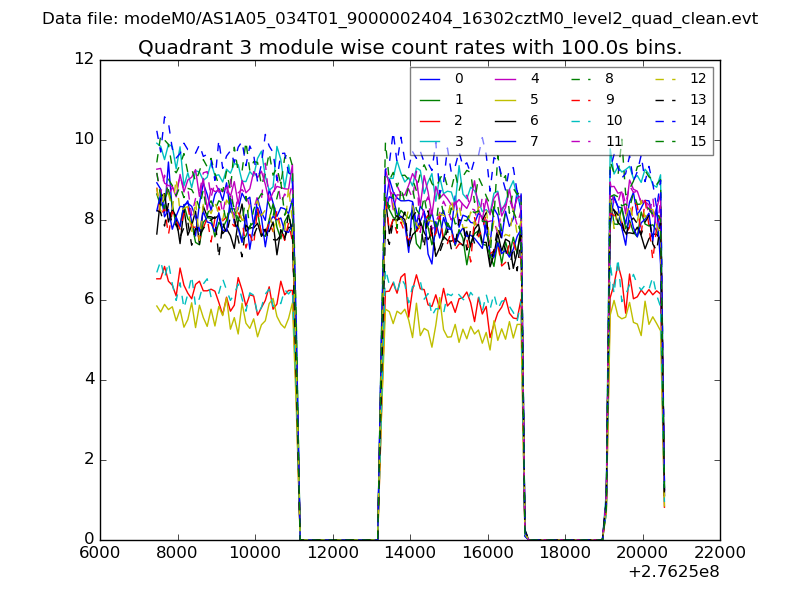
| Module-wise count rates for Quadrant A Data is divided into 100 sec bins |
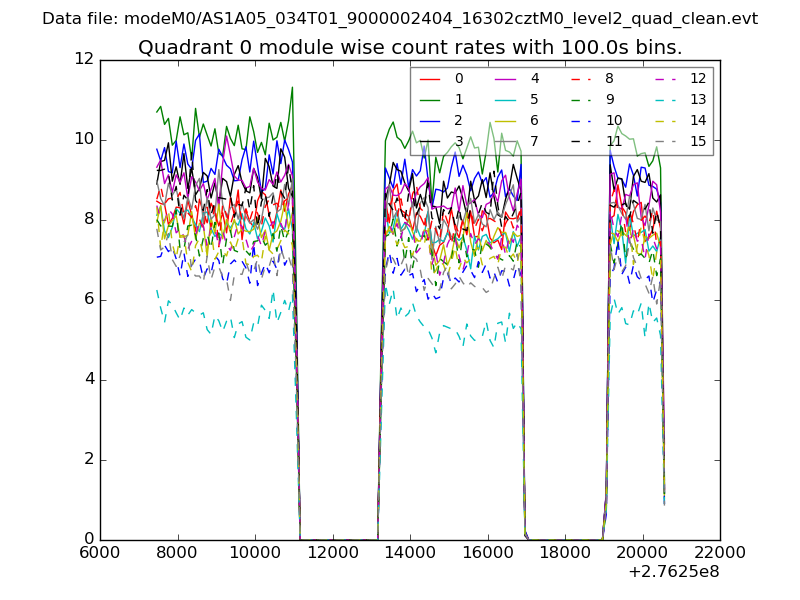 |
 |
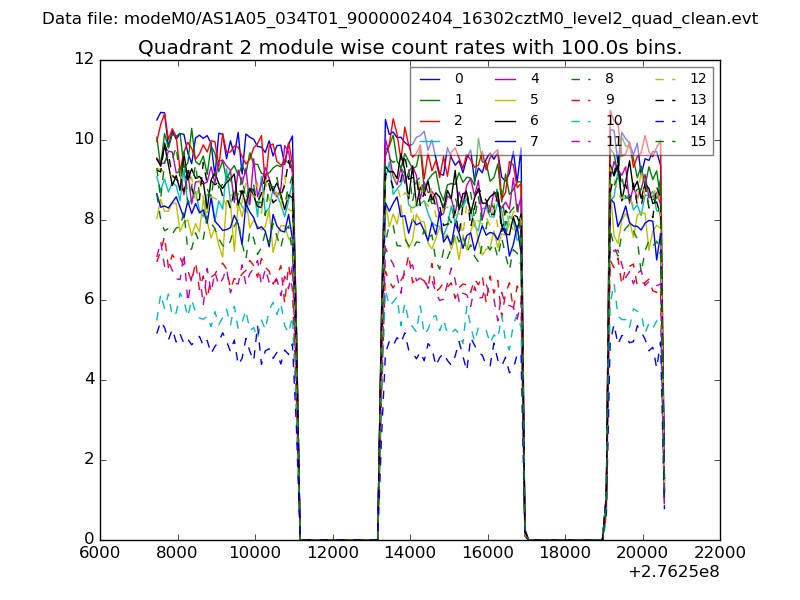
| Module-wise count rates for Quadrant B Data is divided into 100 sec bins |
 |
 |
| Module-wise count rates for Quadrant C Data is divided into 100 sec bins |
 |
 |
| Module-wise count rates for Quadrant D Data is divided into 100 sec bins |
 |
 |
| Parameter | Plot |
|---|---|
| CZT HV Monitor | 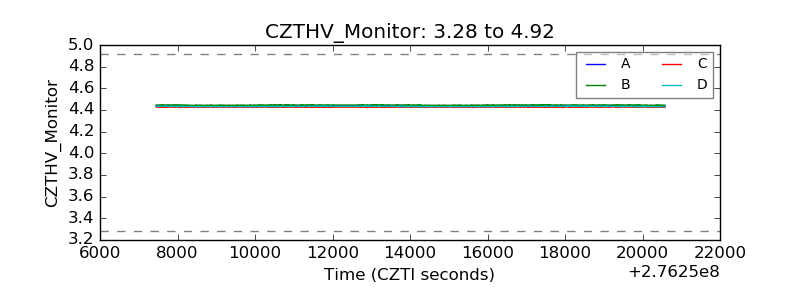 |
| D_VDD | 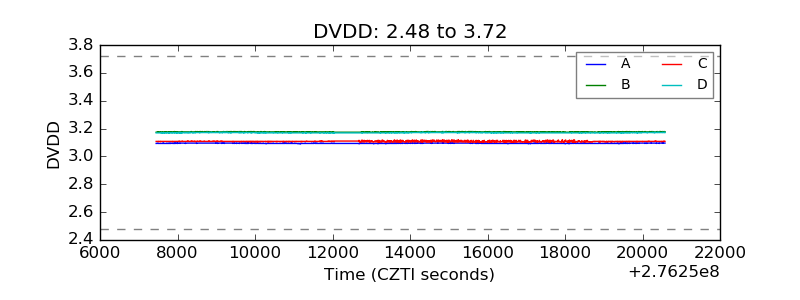 |
| Temperature 1 | 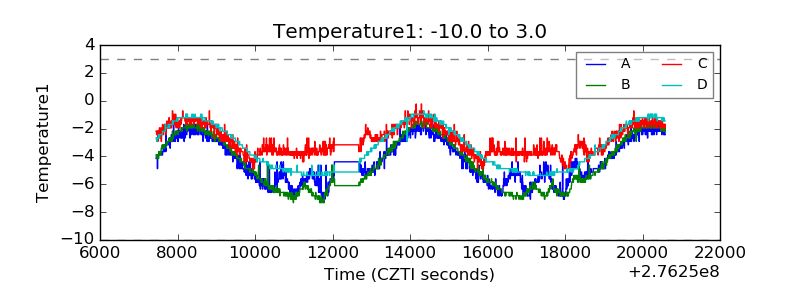 |
| Veto HV Monitor | 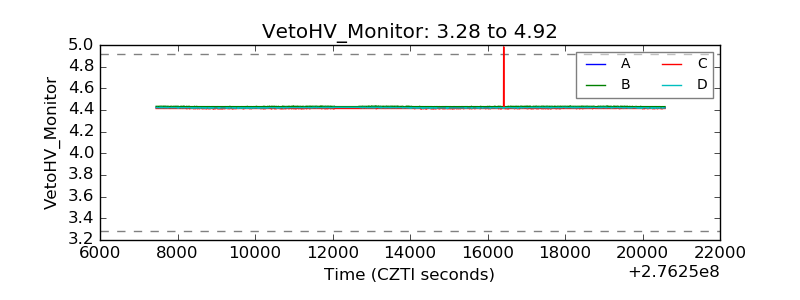 |
| Veto LLD | 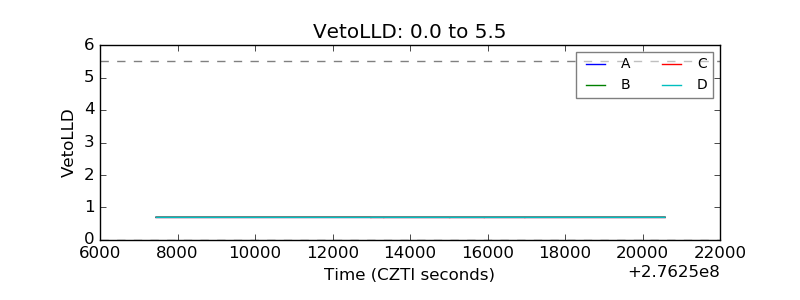 |
| Alpha Counter | 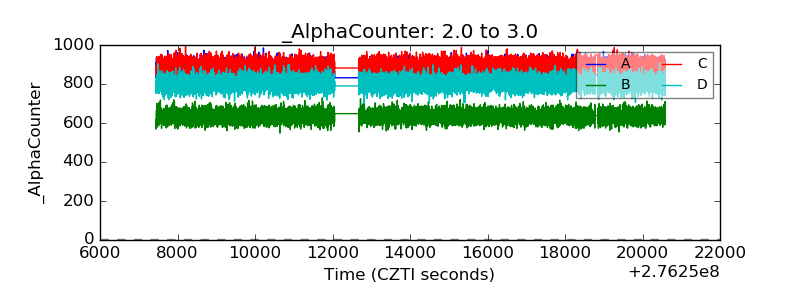 |
| _CPM_Rate | 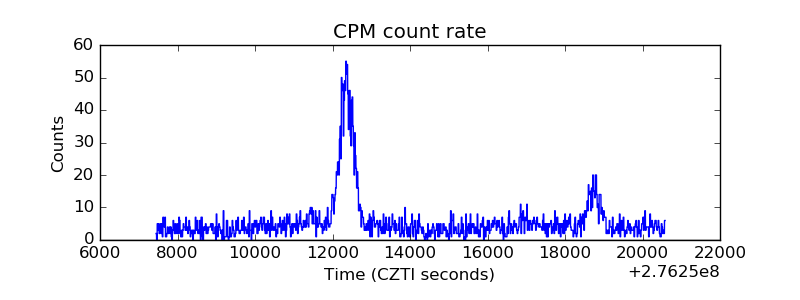 |
| CZT Counter | 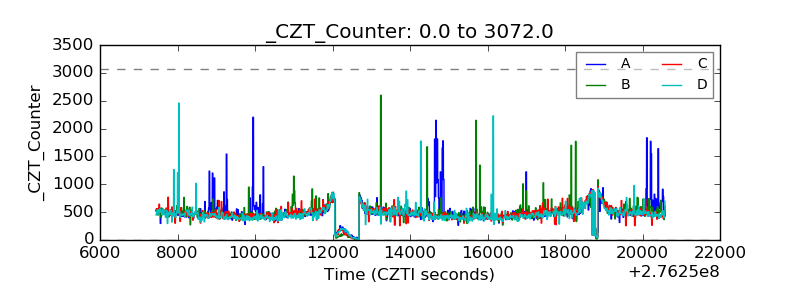 |
| +2.5 Volts monitor |  |
| +5 Volts monitor | 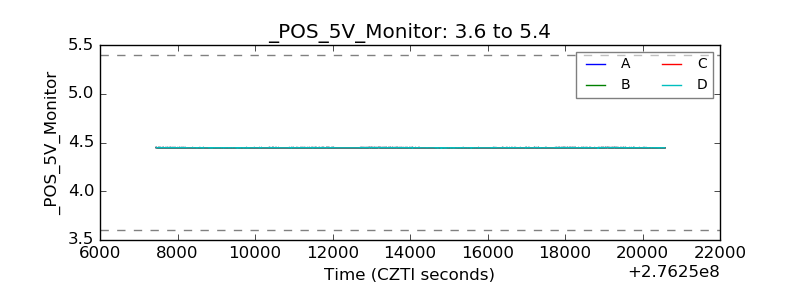 |
| _ROLL_ROT | 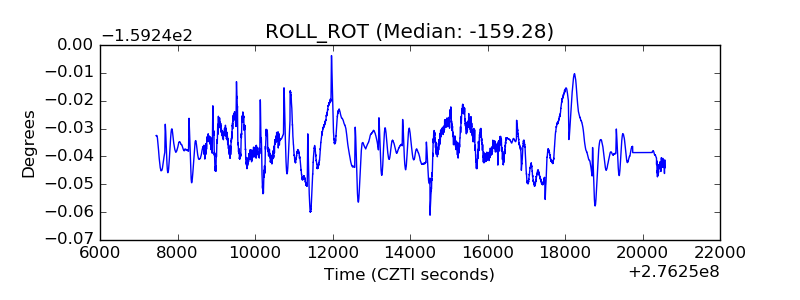 |
| _Roll_DEC | 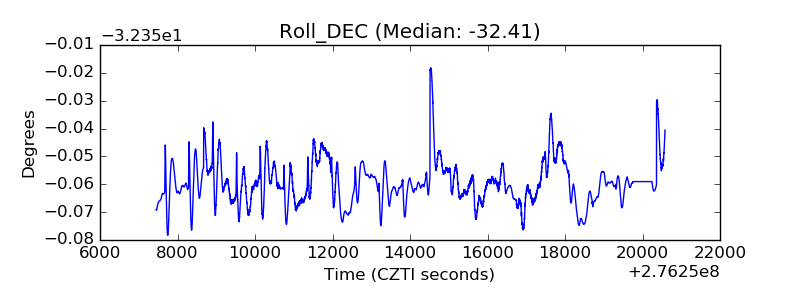 |
| _Roll_RA | 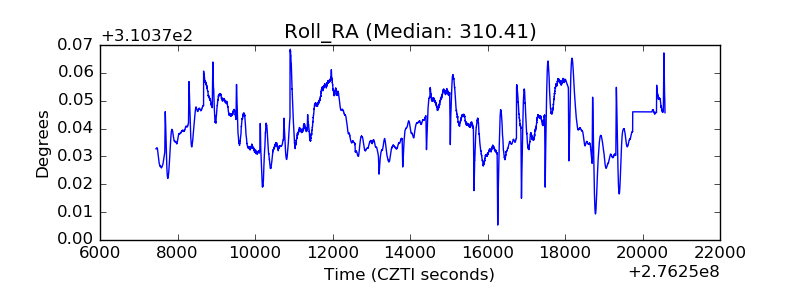 |
| Veto Counter | 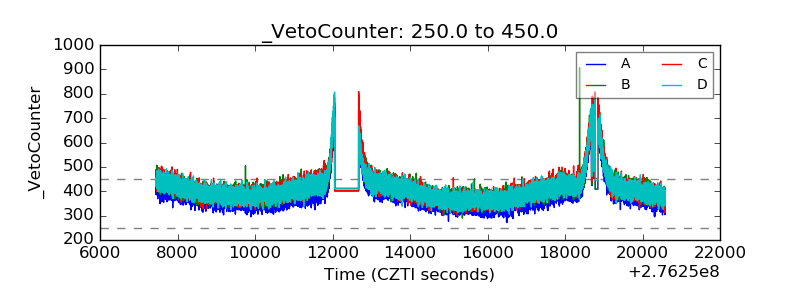 |