| Param | Original file | Final file |
|---|---|---|
| Filename | modeM0/AS1A05_034T01_9000002404_16303cztM0_level2.evt | modeM0/AS1A05_034T01_9000002404_16303cztM0_level2_quad_clean.evt |
| Size (bytes) | 504,239,040 | 101,787,840 |
| Size | 480.9 MB | 97.1 MB |
| Events in quadrant A | 3,727,841 | 639,244 |
| Events in quadrant B | 3,780,416 | 653,001 |
| Events in quadrant C | 3,606,374 | 643,854 |
| Events in quadrant D | 3,657,667 | 635,861 |
| Mode M0 | |||
|---|---|---|---|
| Quadrant | BADHDUFLAG | Total packets | Discarded packets |
| A | 0 | 15851 | 2 |
| B | 0 | 15820 | 1 |
| C | 0 | 15501 | 1 |
| D | 0 | 15891 | 1 |
| Mode SS | |||
|---|---|---|---|
| Quadrant | BADHDUFLAG | Total packets | Discarded packets |
| A | 0 | 148 | 0 |
| B | 0 | 148 | 0 |
| C | 0 | 148 | 0 |
| D | 0 | 148 | 0 |
| Mode M9 | |||
|---|---|---|---|
| Quadrant | BADHDUFLAG | Total packets | Discarded packets |
| A | 0 | 1 | 0 |
| B | 0 | 1 | 0 |
| C | 0 | 1 | 0 |
| D | 0 | 1 | 0 |
| Quadrant | Total seconds | Saturated seconds | Saturation percentage |
|---|---|---|---|
| A | 7340 | 137 | 1.866485% |
| B | 7340 | 157 | 2.138965% |
| C | 7340 | 170 | 2.316076% |
| D | 7340 | 140 | 1.907357% |
Noise dominated data is calculated using 1-second bins in cleaned event files. If a bin has >2000 counts, and if more than 50% of those come from <1% of pixels, then it is considered to be noise-dominated and hence unusable.
| Quadrant | # 1 sec bins | Bins with >0 counts | Bins with >2000 counts | High rate bins dominated by noise | Noise dominated (total time) | Noise dominated (detector-on time) | Marked lightcurve |
|---|---|---|---|---|---|---|---|
| A | 7451 | 7343 | 11 | 11 | 0.15% | 0.15% | 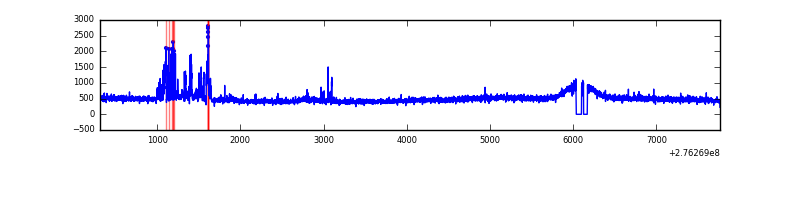 |
| B | 7451 | 7343 | 9 | 9 | 0.12% | 0.12% |  |
| C | 7451 | 7343 | 0 | 0 | 0.00% | 0.00% | 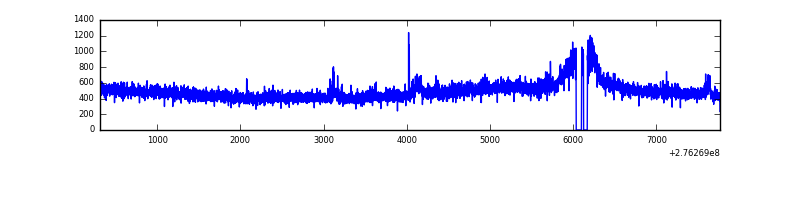 |
| D | 7451 | 7343 | 44 | 44 | 0.59% | 0.60% | 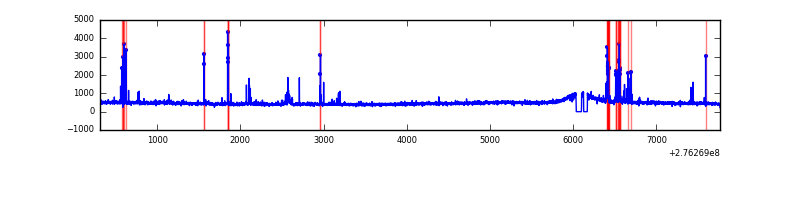 |
Top three noisy pixels from each quadrant. If the there are fewer than three noisy pixels in the level2.evt file, extra rows are filled as -1
| Pixel properties | Quadrant properties | ||||||
|---|---|---|---|---|---|---|---|
| Quadrant | DetID | PixID | Counts | Sigma | Mean | Median | Sigma |
| A | 15 | 174 | 240877 | 1304.37 | 905 | 884 | 184.0 |
| A | 0 | 226 | 7946 | 38.38 | 905 | 884 | 184.0 |
| A | 3 | 137 | 6632 | 31.24 | 905 | 884 | 184.0 |
| B | 0 | 189 | 63593 | 361.17 | 902 | 879 | 173.6 |
| B | 0 | 198 | 51888 | 293.76 | 902 | 879 | 173.6 |
| B | 4 | 216 | 30113 | 168.36 | 902 | 879 | 173.6 |
| C | 14 | 238 | 132124 | 648.49 | 865 | 871 | 202.4 |
| C | 3 | 233 | 68575 | 334.51 | 865 | 871 | 202.4 |
| C | 0 | 207 | 15876 | 74.14 | 865 | 871 | 202.4 |
| D | 10 | 70 | 188645 | 801.17 | 875 | 852 | 234.4 |
| D | 1 | 52 | 46266 | 193.75 | 875 | 852 | 234.4 |
| D | 2 | 234 | 31265 | 129.75 | 875 | 852 | 234.4 |
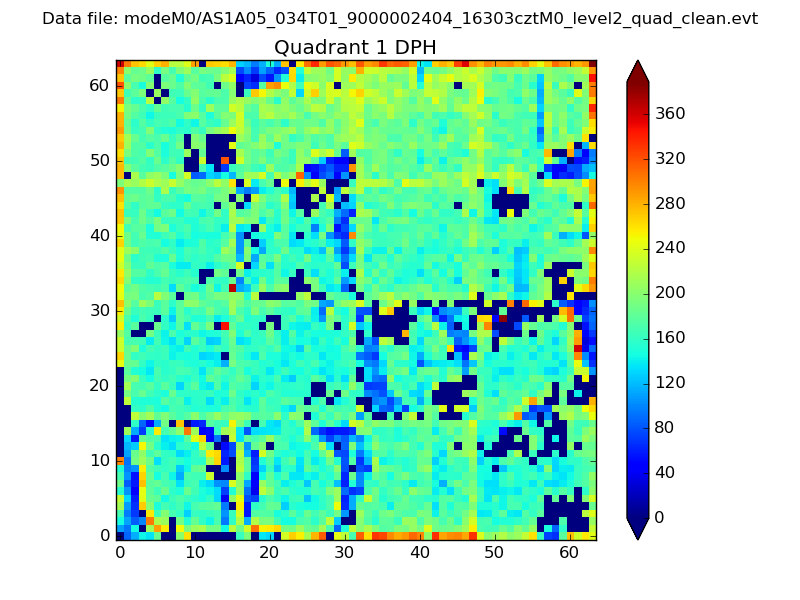
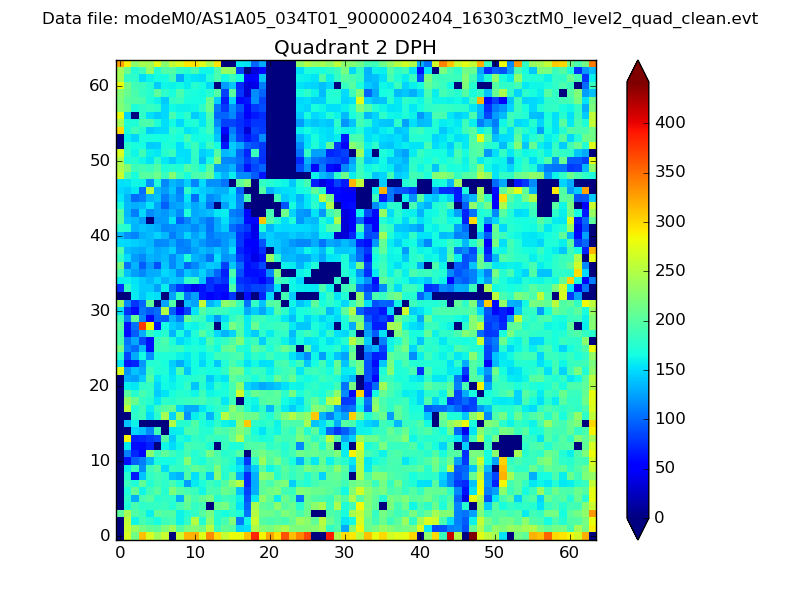
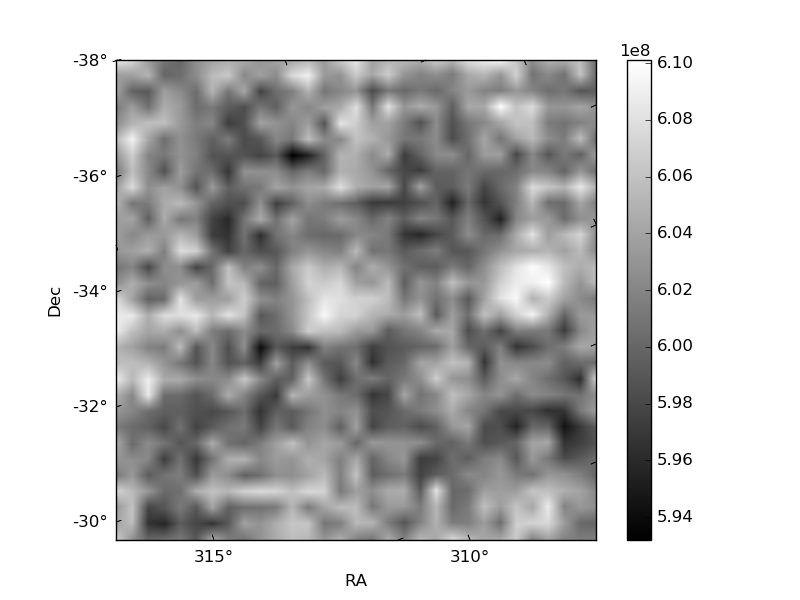
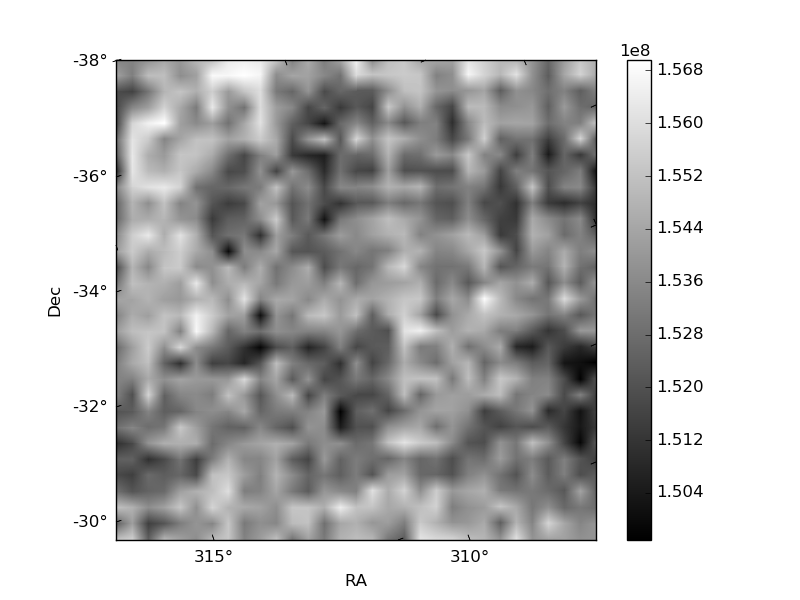
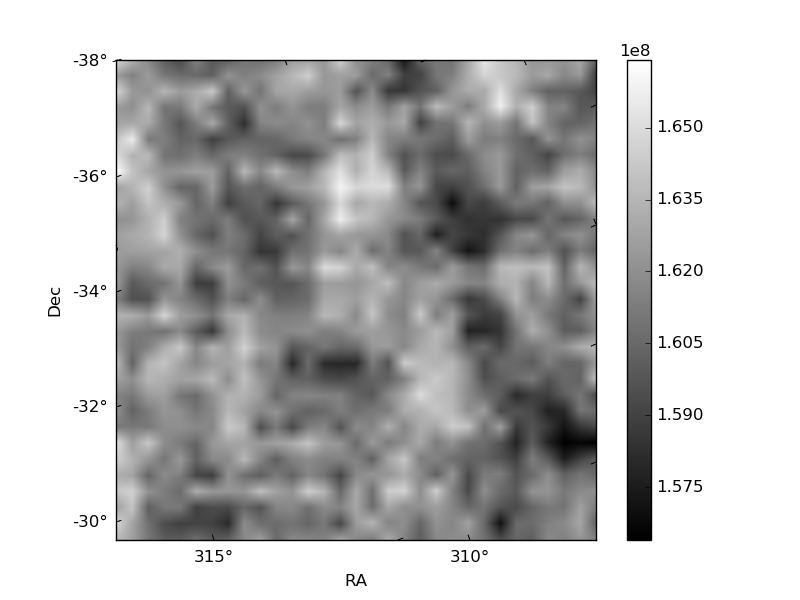
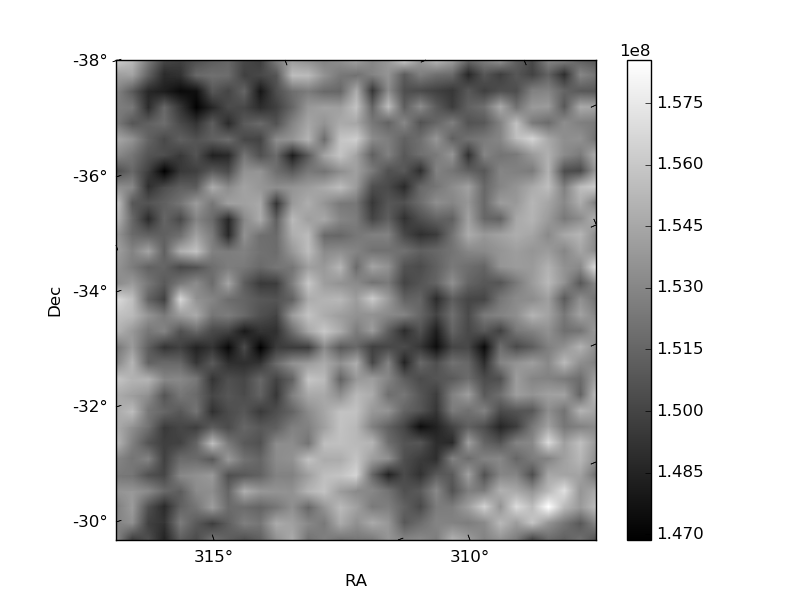
Histogram calculated using DETX and DETY for each event in the final _common_clean file
| Quadrant A | 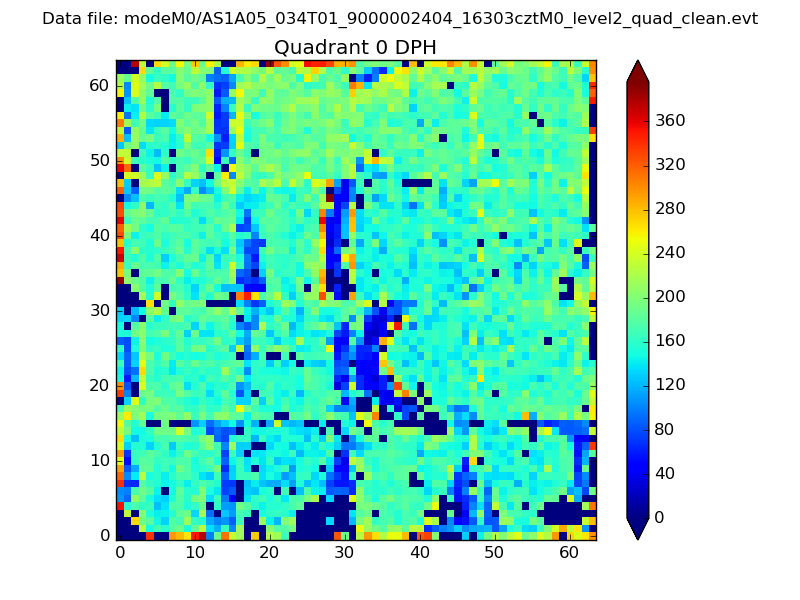 |
 |
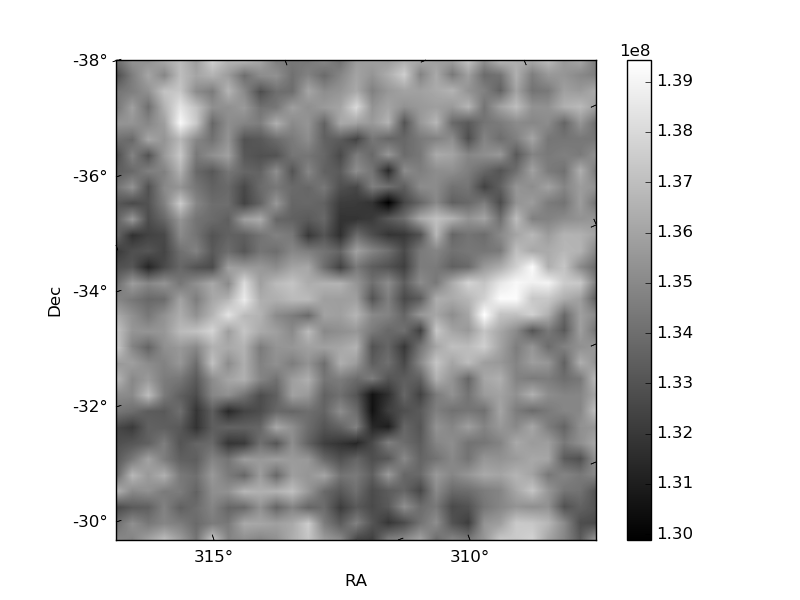
Quadrant B |
|---|---|---|---|
| Quadrant D | 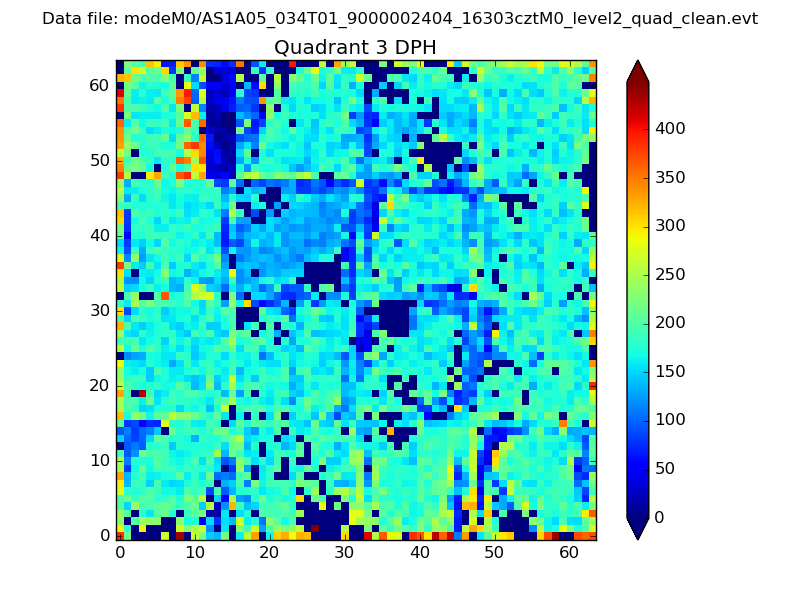 |
 |
Quadrant C |
| Plot type | Count rate plots | Images |
|---|---|---|
| Comparison with Poisson distribution Blue bars denote a histogram of data divided into 1 sec bins. Red curve is a Poisson curve with rate = median count rate of data. |
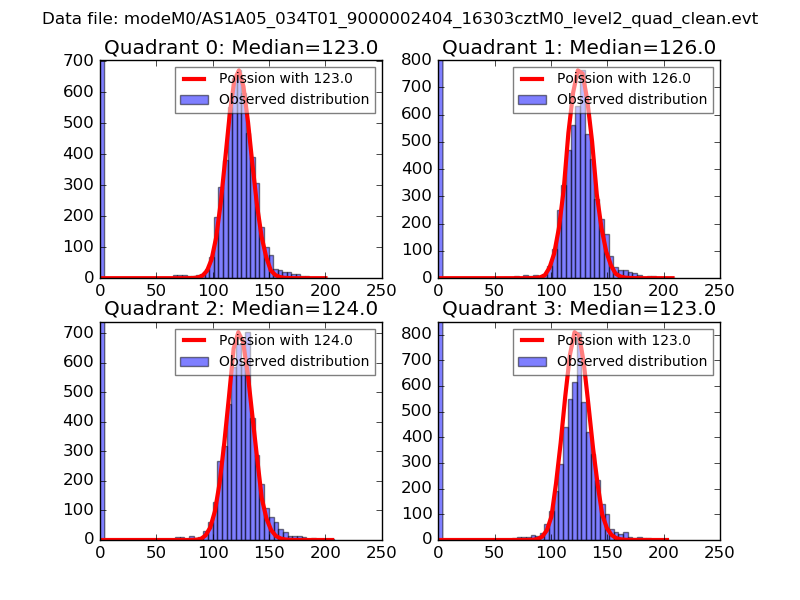 |
 |
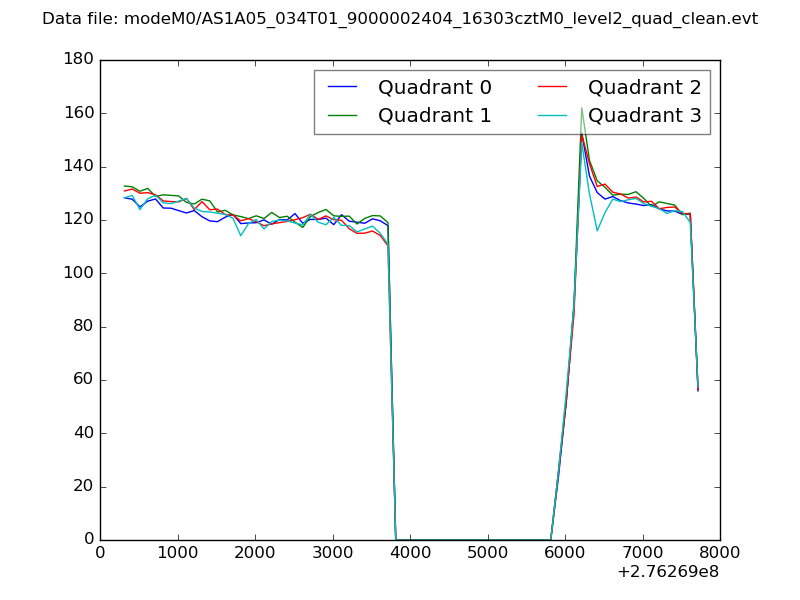
| Quadrant-wise count rates Data is divided into 100 sec bins |
 |
|
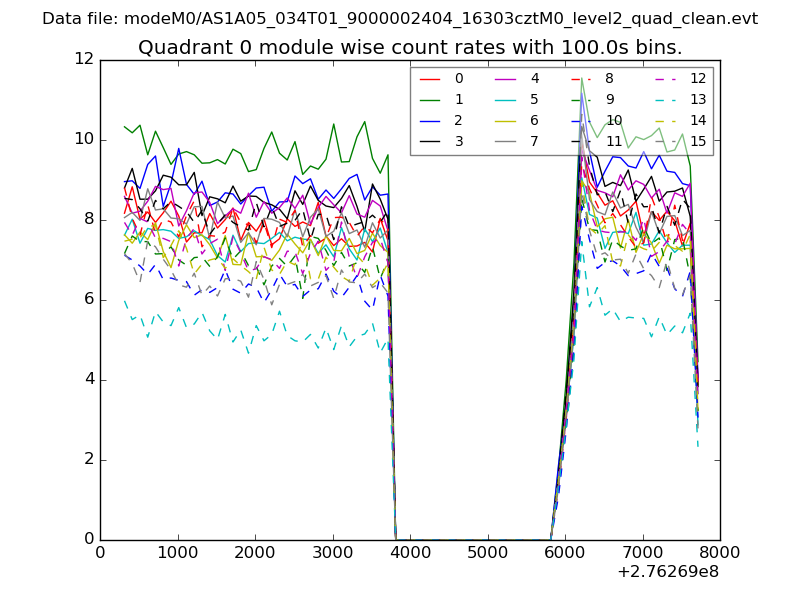
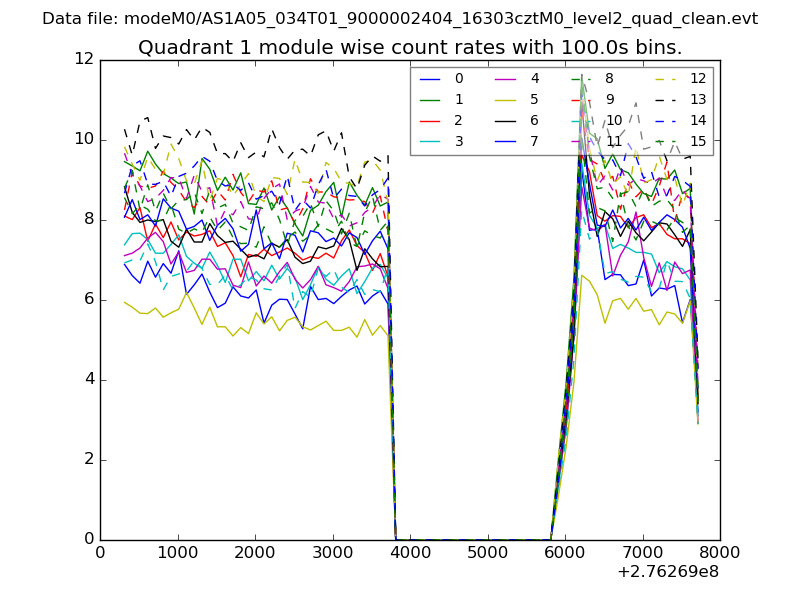
| Module-wise count rates for Quadrant A Data is divided into 100 sec bins |
 |
 |
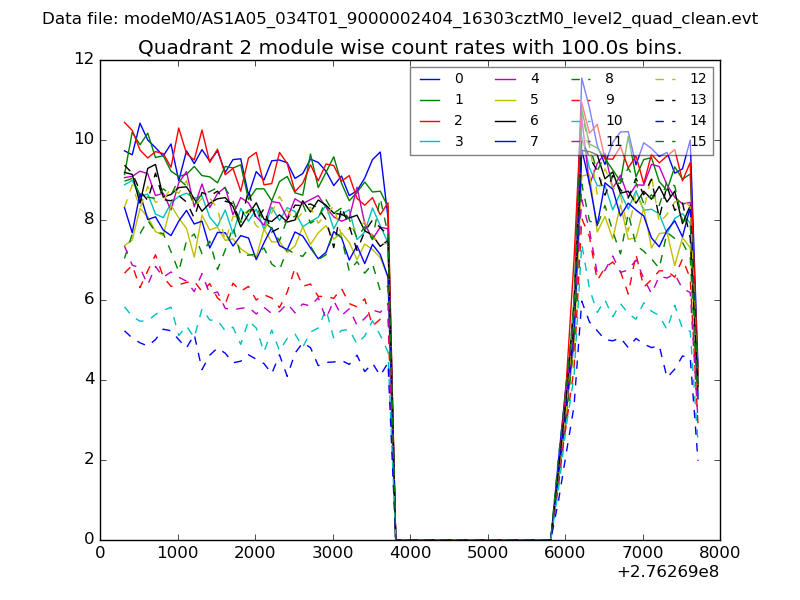
| Module-wise count rates for Quadrant B Data is divided into 100 sec bins |
 |
 |
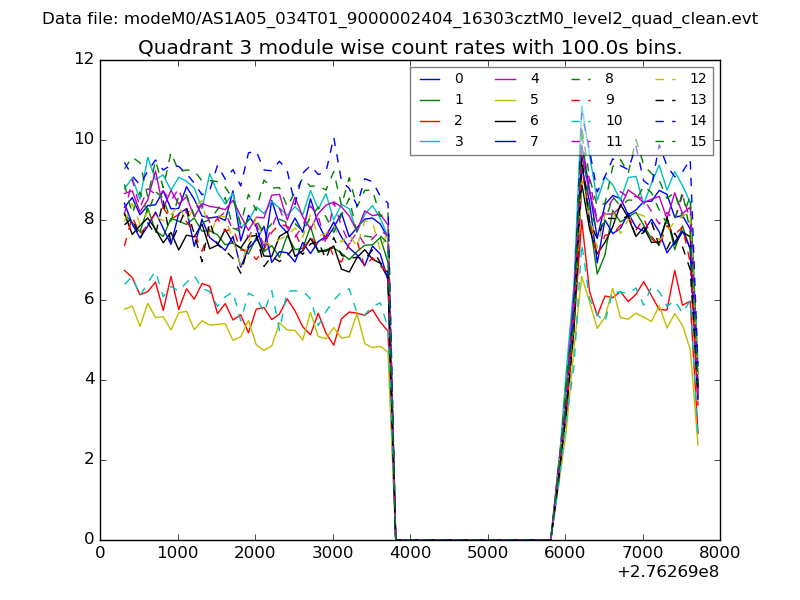
| Module-wise count rates for Quadrant C Data is divided into 100 sec bins |
 |
 |
| Module-wise count rates for Quadrant D Data is divided into 100 sec bins |
 |
 |
| Parameter | Plot |
|---|---|
| CZT HV Monitor | 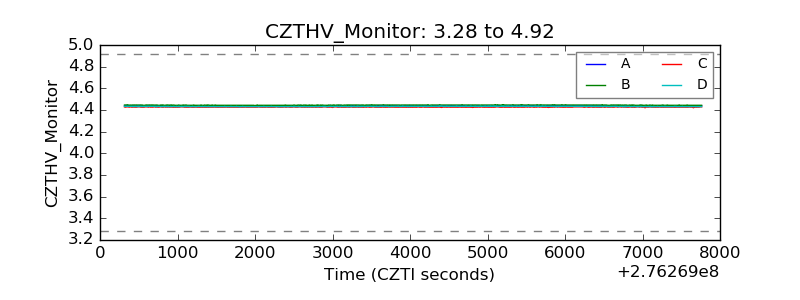 |
| D_VDD |  |
| Temperature 1 |  |
| Veto HV Monitor | 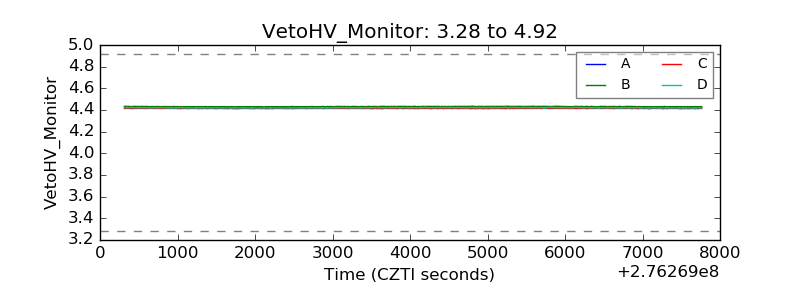 |
| Veto LLD | 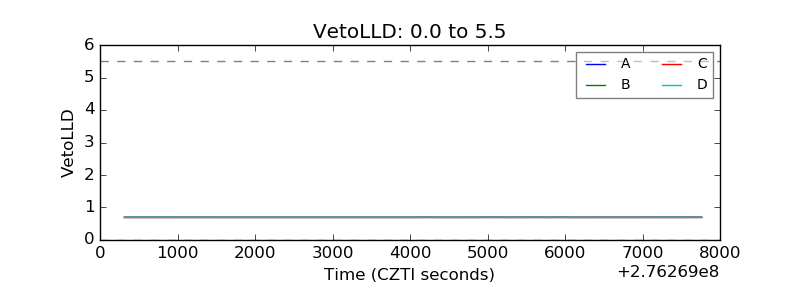 |
| Alpha Counter | 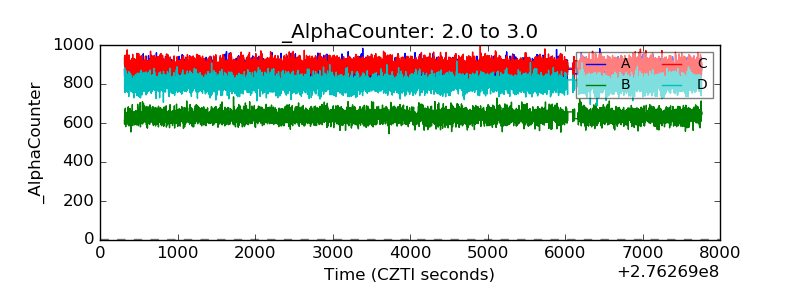 |
| _CPM_Rate | 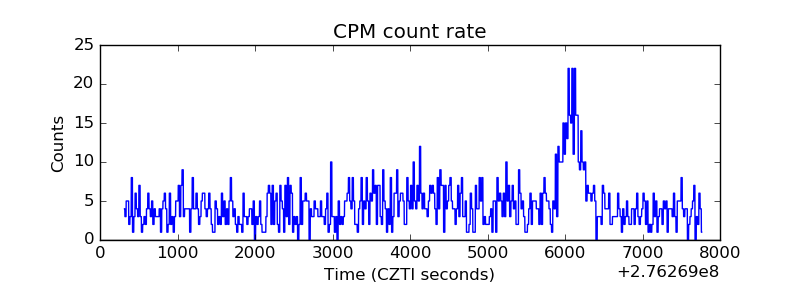 |
| CZT Counter | 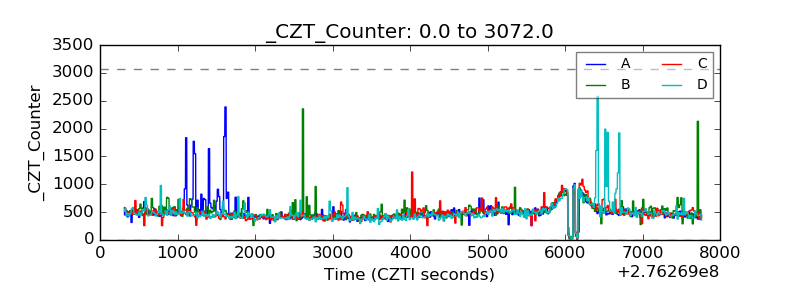 |
| +2.5 Volts monitor |  |
| +5 Volts monitor |  |
| _ROLL_ROT | 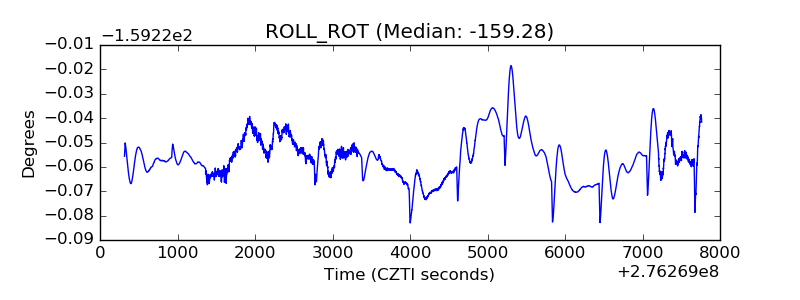 |
| _Roll_DEC | 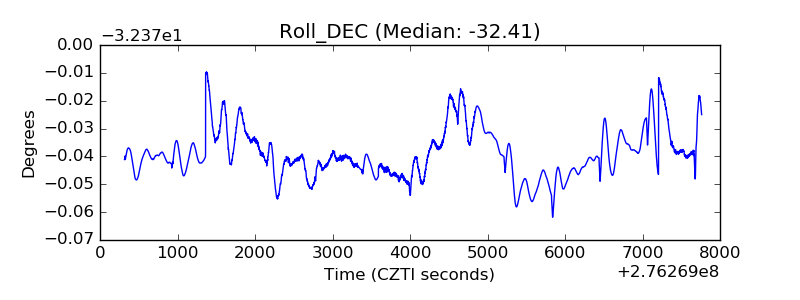 |
| _Roll_RA | 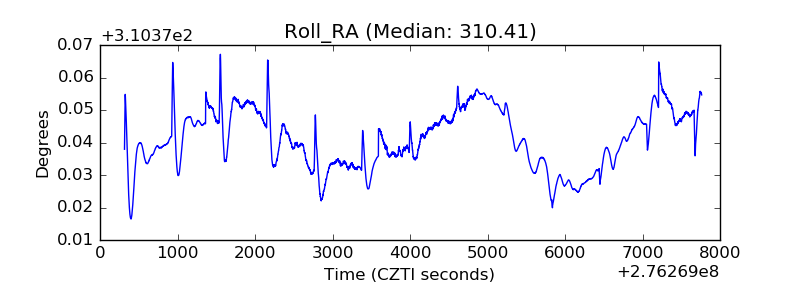 |
| Veto Counter | 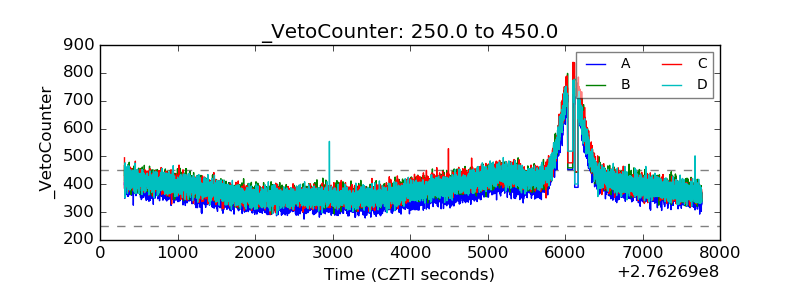 |