| Param | Original file | Final file |
|---|---|---|
| Filename | modeM0/AS1A05_034T01_9000002404_16308cztM0_level2.evt | modeM0/AS1A05_034T01_9000002404_16308cztM0_level2_quad_clean.evt |
| Size (bytes) | 455,869,440 | 88,490,880 |
| Size | 434.8 MB | 84.4 MB |
| Events in quadrant A | 3,509,760 | 551,060 |
| Events in quadrant B | 3,445,792 | 568,046 |
| Events in quadrant C | 3,174,188 | 553,628 |
| Events in quadrant D | 3,224,385 | 543,376 |
| Mode M0 | |||
|---|---|---|---|
| Quadrant | BADHDUFLAG | Total packets | Discarded packets |
| A | 0 | 14739 | 3 |
| B | 0 | 14445 | 2 |
| C | 0 | 13563 | 2 |
| D | 0 | 14133 | 2 |
| Mode SS | |||
|---|---|---|---|
| Quadrant | BADHDUFLAG | Total packets | Discarded packets |
| A | 0 | 134 | 0 |
| B | 0 | 134 | 0 |
| C | 0 | 134 | 0 |
| D | 0 | 134 | 0 |
| Mode M9 | |||
|---|---|---|---|
| Quadrant | BADHDUFLAG | Total packets | Discarded packets |
| A | 0 | 15 | 0 |
| B | 0 | 15 | 0 |
| C | 0 | 15 | 0 |
| D | 0 | 16 | 0 |
| Quadrant | Total seconds | Saturated seconds | Saturation percentage |
|---|---|---|---|
| A | 6654 | 44 | 0.661256% |
| B | 6654 | 38 | 0.571085% |
| C | 6654 | 41 | 0.616171% |
| D | 6654 | 43 | 0.646228% |
Noise dominated data is calculated using 1-second bins in cleaned event files. If a bin has >2000 counts, and if more than 50% of those come from <1% of pixels, then it is considered to be noise-dominated and hence unusable.
| Quadrant | # 1 sec bins | Bins with >0 counts | Bins with >2000 counts | High rate bins dominated by noise | Noise dominated (total time) | Noise dominated (detector-on time) | Marked lightcurve |
|---|---|---|---|---|---|---|---|
| A | 7755 | 6656 | 8 | 8 | 0.10% | 0.12% | 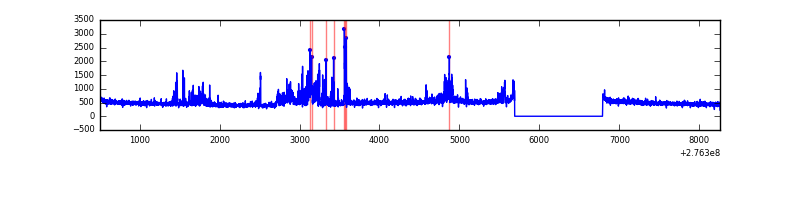 |
| B | 7755 | 6656 | 5 | 5 | 0.06% | 0.08% | 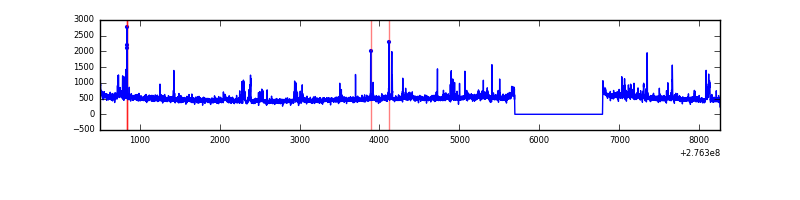 |
| C | 7755 | 6656 | 0 | 0 | 0.00% | 0.00% | 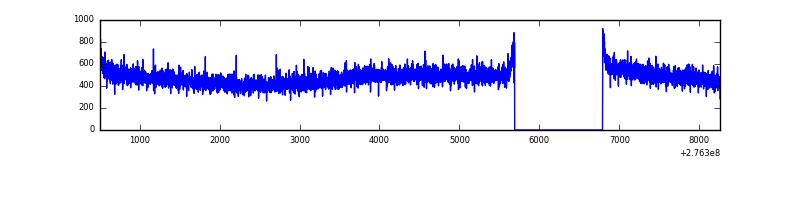 |
| D | 7755 | 6656 | 24 | 24 | 0.31% | 0.36% | 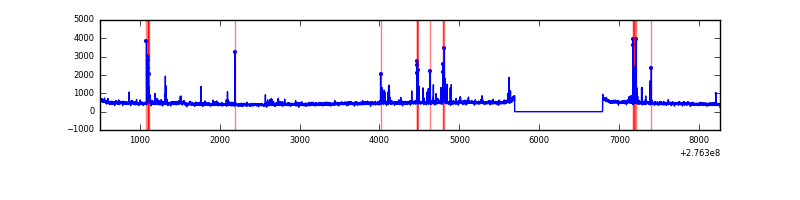 |
Top three noisy pixels from each quadrant. If the there are fewer than three noisy pixels in the level2.evt file, extra rows are filled as -1
| Pixel properties | Quadrant properties | ||||||
|---|---|---|---|---|---|---|---|
| Quadrant | DetID | PixID | Counts | Sigma | Mean | Median | Sigma |
| A | 15 | 174 | 428178 | 2628.93 | 802 | 787 | 162.6 |
| A | 0 | 226 | 6914 | 37.69 | 802 | 787 | 162.6 |
| A | 12 | 194 | 5904 | 31.48 | 802 | 787 | 162.6 |
| B | 4 | 173 | 81434 | 528.06 | 810 | 790 | 152.7 |
| B | 15 | 35 | 73114 | 473.58 | 810 | 790 | 152.7 |
| B | 0 | 198 | 64433 | 416.74 | 810 | 790 | 152.7 |
| C | 14 | 238 | 120362 | 663.57 | 780 | 786 | 180.2 |
| C | 3 | 233 | 7747 | 38.63 | 780 | 786 | 180.2 |
| C | 13 | 61 | 5500 | 26.16 | 780 | 786 | 180.2 |
| D | 10 | 70 | 99056 | 529.1 | 779 | 760 | 185.8 |
| D | 1 | 52 | 87639 | 467.65 | 779 | 760 | 185.8 |
| D | 2 | 122 | 41776 | 220.78 | 779 | 760 | 185.8 |
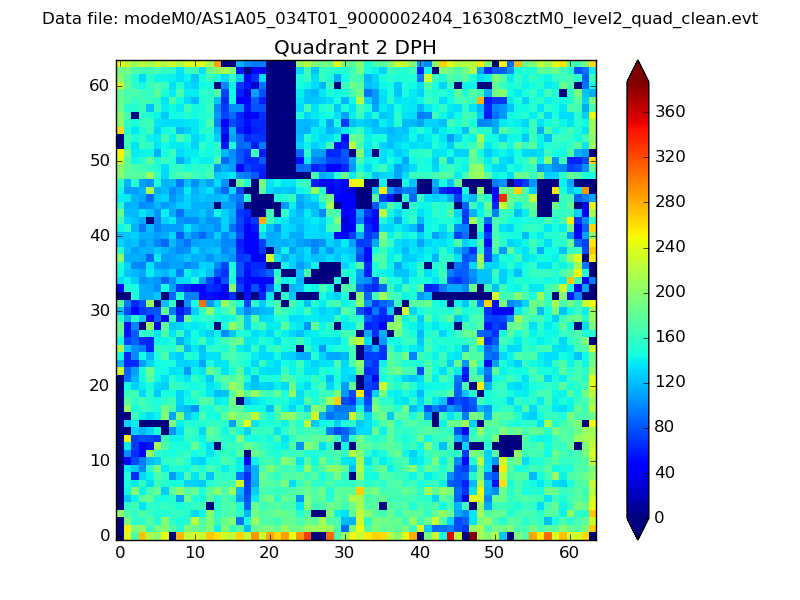
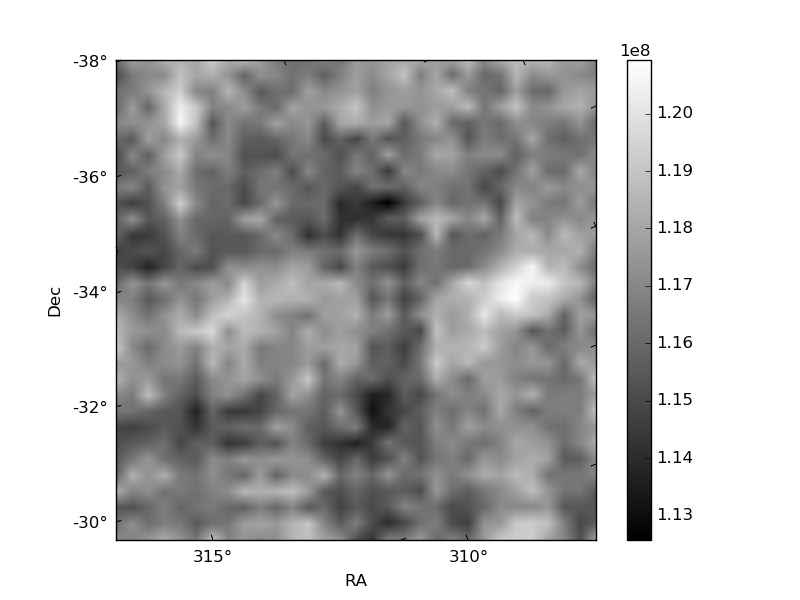
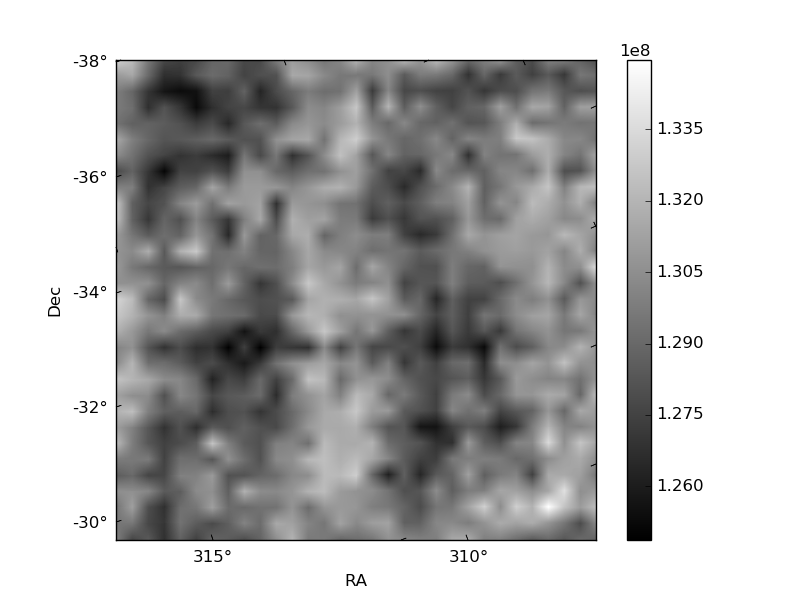
Histogram calculated using DETX and DETY for each event in the final _common_clean file
| Quadrant A | 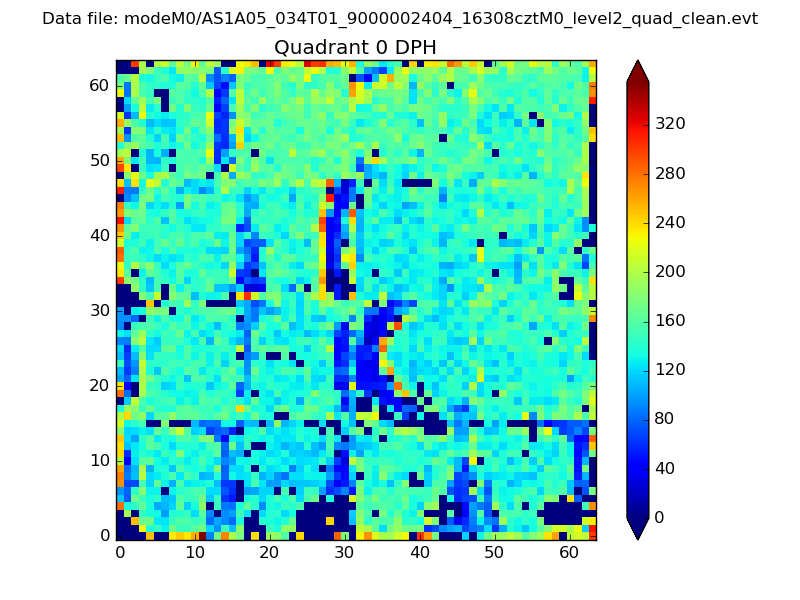 |
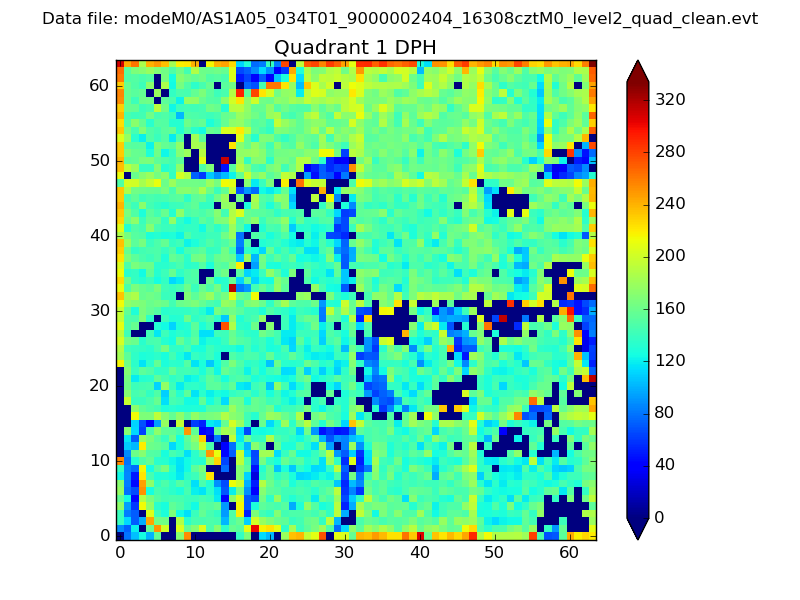 |
Quadrant B |
|---|---|---|---|
| Quadrant D | 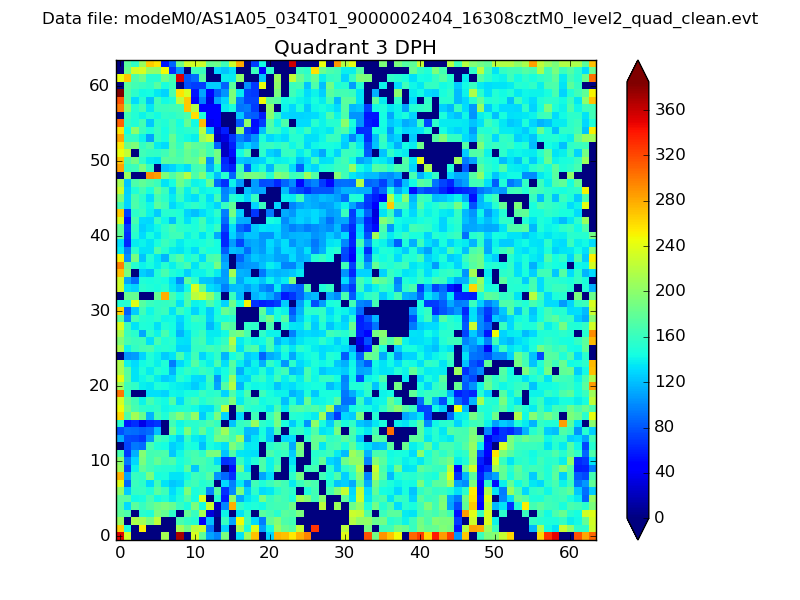 |
 |
Quadrant C |
| Plot type | Count rate plots | Images |
|---|---|---|
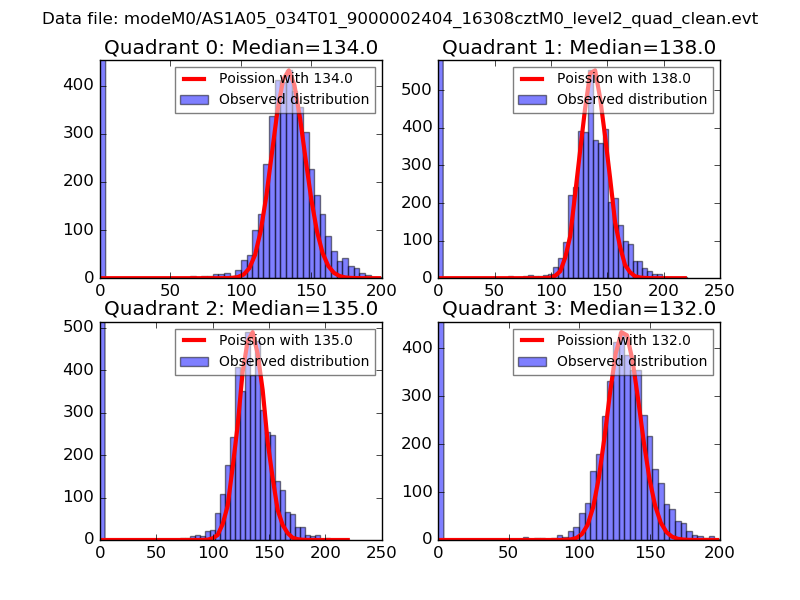
| Comparison with Poisson distribution Blue bars denote a histogram of data divided into 1 sec bins. Red curve is a Poisson curve with rate = median count rate of data. |
 |
 |
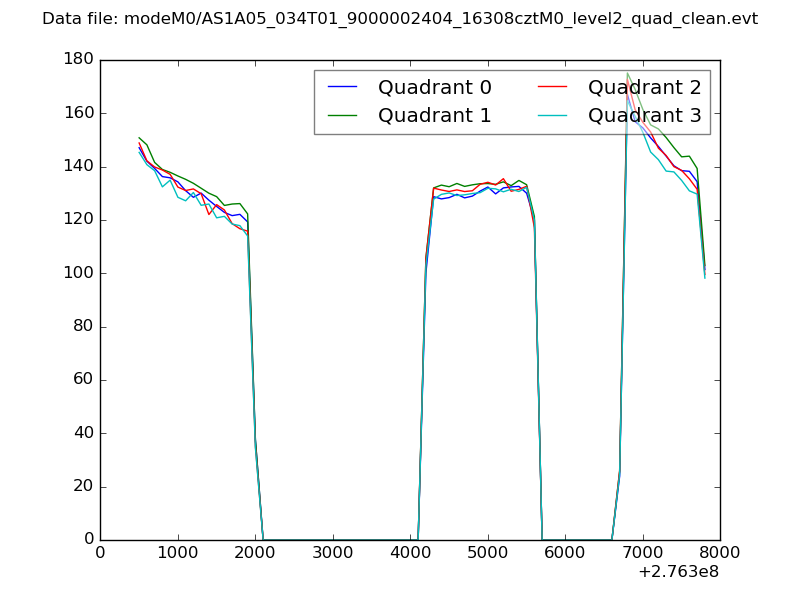
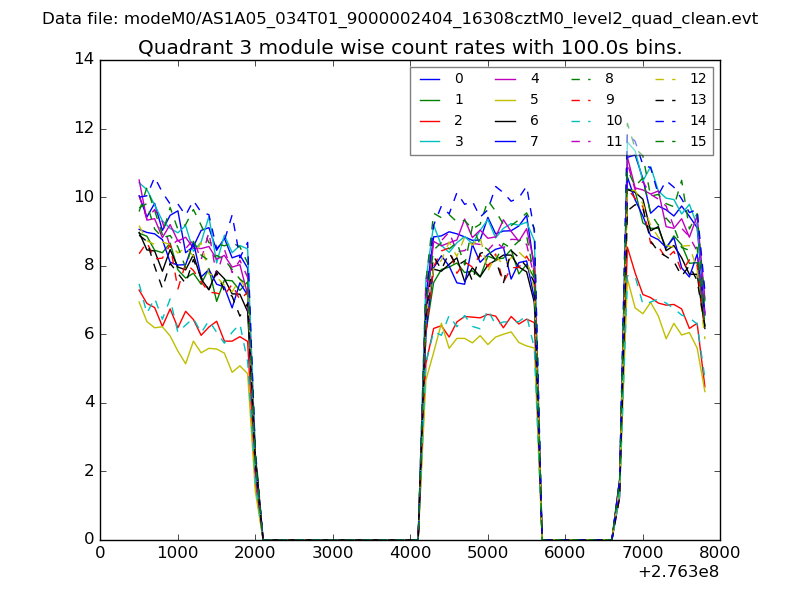
| Quadrant-wise count rates Data is divided into 100 sec bins |
 |
|
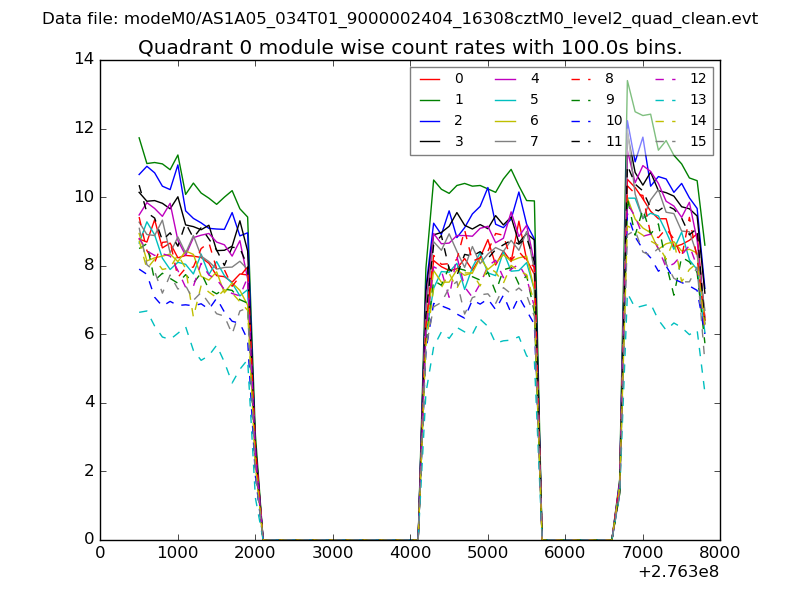
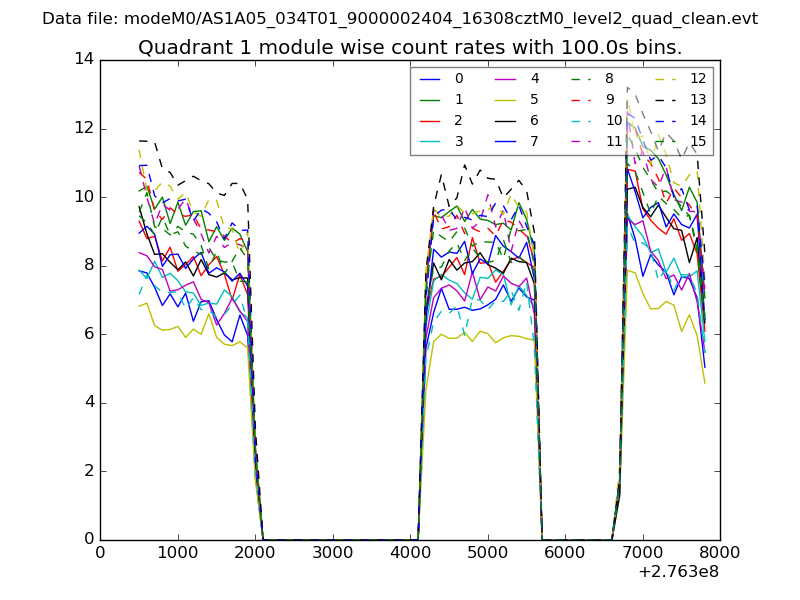
| Module-wise count rates for Quadrant A Data is divided into 100 sec bins |
 |
 |
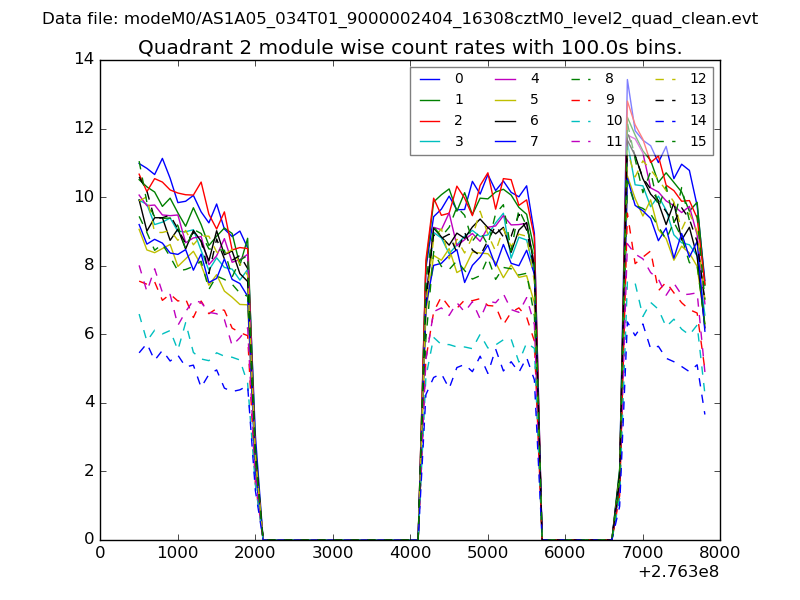
| Module-wise count rates for Quadrant B Data is divided into 100 sec bins |
 |
 |
| Module-wise count rates for Quadrant C Data is divided into 100 sec bins |
 |
 |
| Module-wise count rates for Quadrant D Data is divided into 100 sec bins |
 |
 |
| Parameter | Plot |
|---|---|
| CZT HV Monitor | 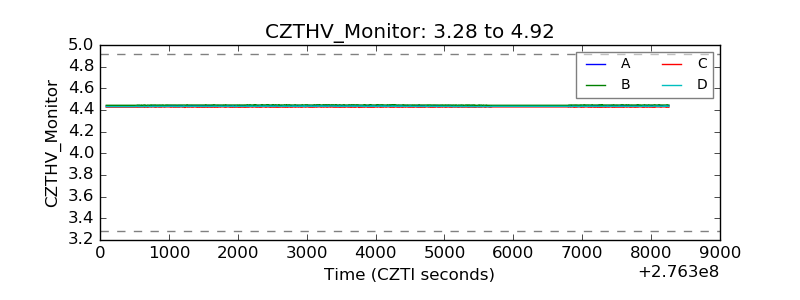 |
| D_VDD | 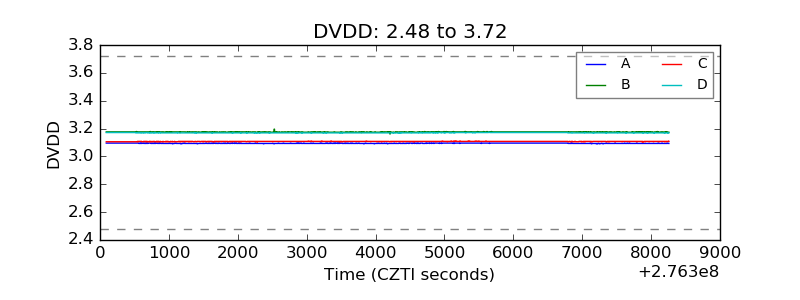 |
| Temperature 1 | 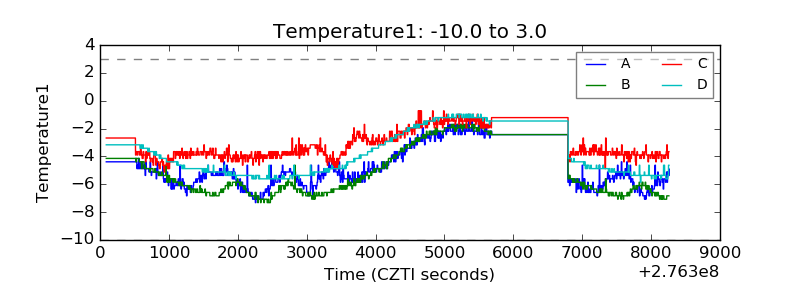 |
| Veto HV Monitor | 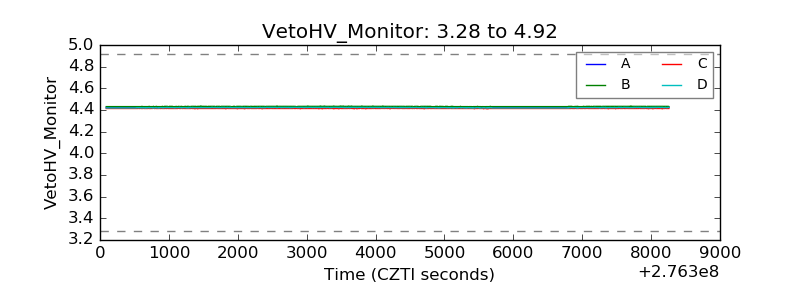 |
| Veto LLD | 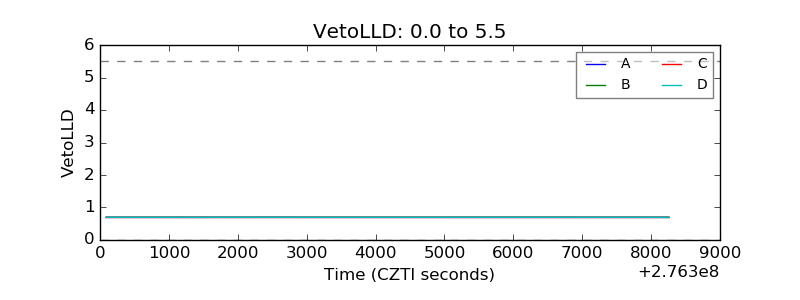 |
| Alpha Counter | 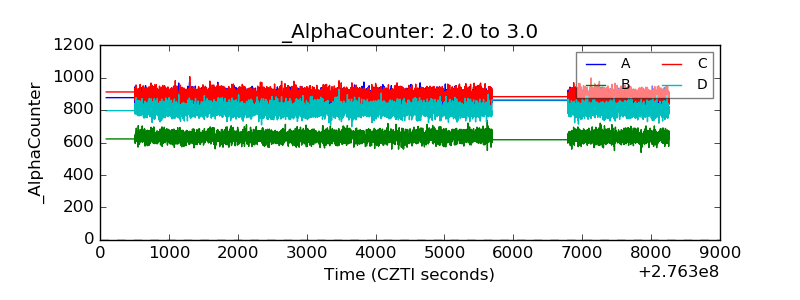 |
| _CPM_Rate | 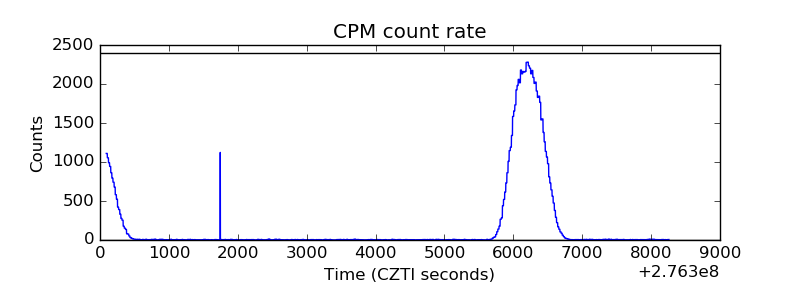 |
| CZT Counter | 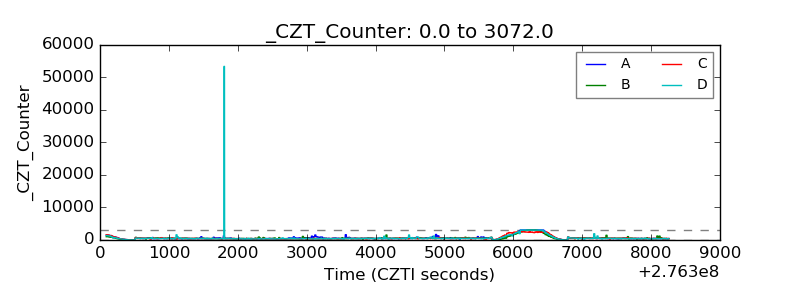 |
| +2.5 Volts monitor |  |
| +5 Volts monitor |  |
| _ROLL_ROT | 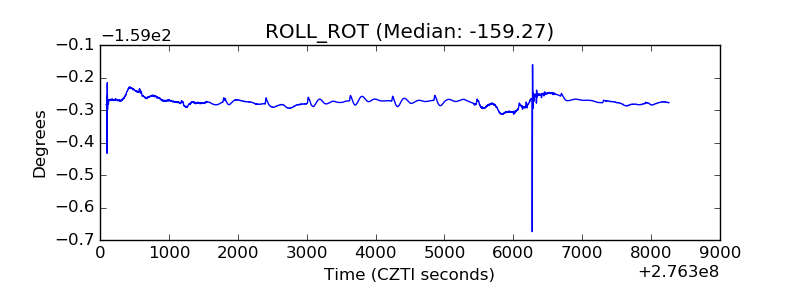 |
| _Roll_DEC | 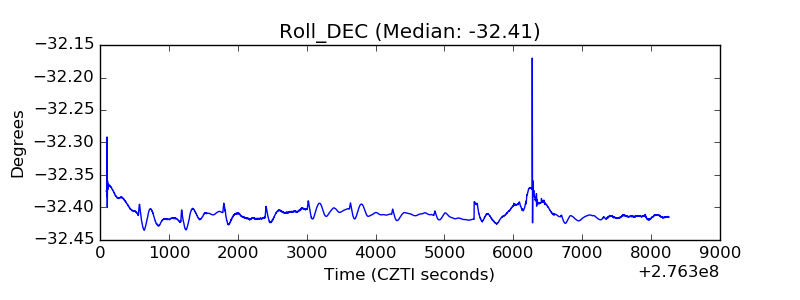 |
| _Roll_RA | 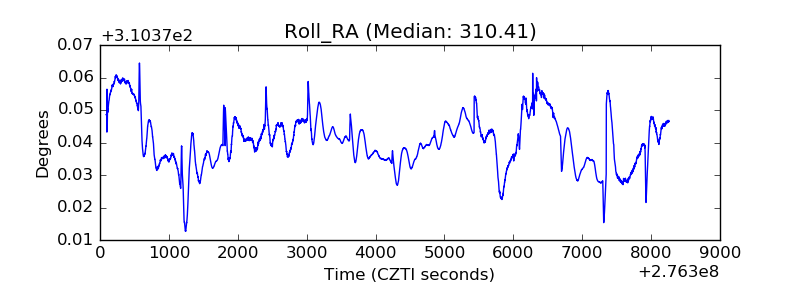 |
| Veto Counter | 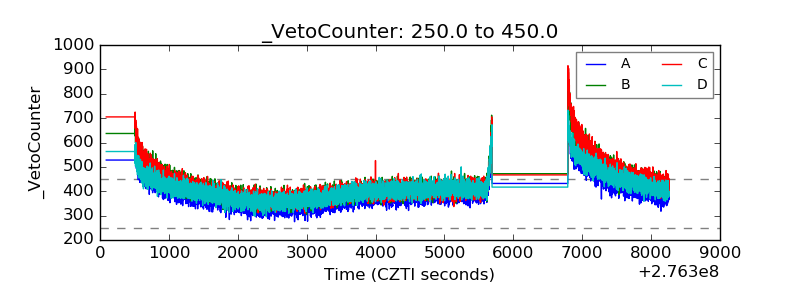 |